. 2024 May 25;14(1):12007.
doi: 10.1038/s41598-024-62934-y.

Discriminating orientation information with phase consistency in alpha and low-gamma frequency bands: an EEG study

Affiliations

Discriminating orientation information with phase consistency in alpha and low-gamma frequency bands: an EEG study

Alireza Khadir et al. Sci Rep. .

Abstract

Recent studies suggest that noninvasive imaging methods (EEG, MEG) in the human brain scalp can decode the content of visual features information (orientation, color, motion, etc.) in Visual-Working Memory (VWM). Previous work demonstrated that with the sustained low-frequency Event-Related Potential (ERP under 6 Hz) of scalp EEG distributions, it is possible to accurately decode the content of orientation information in VWM during the delay interval. In addition, previous studies showed that the raw data captured by a combination of the occi-parietal electrodes could be used to decode the orientation. However, it is unclear whether the orientation information is available in other frequency bands (higher than 6 Hz) or whether this information is feasible with fewer electrodes. Furthermore, the exploration of orientation information in the phase values of the signal has not been well-addressed. In this study, we propose that orientation information is also accessible through the phase consistency of the occipital region in the alpha band frequency. Our results reveal a significant difference between orientations within 200 ms after stimulus offset in early visual sensory processing, with no apparent effect in power and Event-Related Oscillation (ERO) during this period. Additionally, in later periods (420-500 ms after stimulus offset), a noticeable difference is observed in the phase consistency of low gamma-band activity in the occipital area. Importantly, our findings suggest that phase consistency between trials of the orientation feature in the occipital alpha and low gamma-band can serve as a measure to obtain orientation information in VWM. Furthermore, the study demonstrates that phase consistency in the alpha and low gamma band can reflect the distribution of orientation-selective neuron numbers in the four main orientations in the occipital area.


Conflict of interest statement

The authors declare no competing interests.

Figures

Figure 1
Figure 1
Stimulus characteristics and presentation. (A) Four different orientations of luminance-defined sinusoidal Gabor gratings (0, 45, 90, 135, spatial frequency = 0.1 Hz, phase = 0) presented with Black and White colors on a gray background. (B) The visual paradigm consists of 24 randomly selected stimuli, starting with a 500 ms fixation point, after which participants were presented with one Gabor gratings for 100 ms followed by a 3000 ms delay period of fixation. (C) The location of the electrodes is based on the 10–20 system, and the areas marked on the electrodes are the regions mentioned in this paper. The occipital area includes O1 and O2 electrodes that are marked with the purple; the parietal region includes Pz, P3, P4, P7, P8 (all marked with blue), the central region includes Cz, C3, C4 (marked with green); frontal area (F3, F4, F7, F8) marked with cyan, and prefrontal area (Fp1, Fp2) marked with orange.
Figure 2
Figure 2
Flowchart of the procedure.
Figure 3
Figure 3
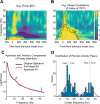
Time-Frequency decomposition of neural EEG responses to visual stimuli in occipital (O1 and O2) electrodes. Average time-frequency plots of 15 participants around stimulus onset using the Morlet Wavelets Convolution method. Plots are averaged over all orientation conditions. for (A) power analysis, values are normalized by baseline (z-score) of a 300–100 ms time-window before stimulus onset. In the map, yellow indicates that the power is higher than baseline periods, and blue indicates the opposite. The highlighted cluster in the delta & theta-frequency band (under 8 Hz) indicates a significant power increase immediately after stimuli onset, and in alpha-frequency band (8–12 Hz) indicates an evident power suppression during long periods after stimulus offset (permutation test with 1000 permutations, participant = 15, cluster-forming threshold p < 0.05, corrected significance level p < 0.001). Dash lines indicate the time of stimulus onset (t = 0 ms) and stimulus offset (t = 100 ms). (B) ITPC analysis, and for each frequency, values are subtracted from baseline periods (300–100 ms time-window before stimulus onset). The highlighted cluster showed a significant increase of under 25 Hz activity immediately after the presentation of the stimulus (permutation test with 1000 permutations, participant = 15, cluster-forming threshold p < 0.05, corrected significance level p < 0.001). (C) The power-spectral density represents the average across subjects and all conditions, and the FOOOF model is fitted to these average power spectra. Model parameters are extracted, with the indicated arrow highlighting the identified peaks. (D) The distribution illustrates all periodic peaks extracted from the FOOOF model for each subject and each condition. Notably, two prominent peaks are observed around 12 and 42 Hz.
Figure 4
Figure 4
Orientation information in alpha-band frequency. (A) Each line shows the average of ITPC values from 15 participants in the occipital area (90 (blue), 135 (red), 45 (black), and 0 (green)). The dashed line indicates the time of stimuli onset (t = 0 ms) and stimuli offset (t = 100 ms). The Horizontal black lines show the clusters of significant differences between orientations in the time window of 235- to 270 ms (within-subject Friedman, 1000 permutations, participant = 15, cluster-forming threshold p < 0.025, corrected significance threshold p < 0.05). The bar plot indicates averaged ITPC values across the time window of significant periods (235- to 270-ms) of each orientation. Error bars show 95 confidence intervals calculated across participants (n = 15). The Friedman showed a significant effect on the orientation’s average ITPC value for this time period. Asterisks above horizontal lines indicate significant differences between each pair of orientations (Post-hoc two-sided Wilcoxon tests). n.s: p > 0.05, *p < 0.05, **p < 0.01, ***p < 0.001. (B) Same as panel A, the average of ITPC values only for orientation 90 (blue), 135 (red) with Error shadings show 95% confidence intervals, calculated across participants (n = 15). The Horizontal lines show clusters of significant differences between orientation 90 against 135 (two-sided Wilcoxon tests, 5000 permutations, cluster-forming threshold Z>1.96, corrected significance threshold p < 0.05). Topography shows the associated differences of orientation 90 against 135 in alpha z-scored p-values of ITPC (8–12 Hz) in the 190-310 ms window (indicated in the solid line). Star indicates O1 and O2 significant site (5000 permutations, cluster-forming threshold Z > 2.56, corrected significance threshold p < 0.01). (C) ERO of alpha-band frequency of 90 and 135 orientations, which demonstrated no significant effect (5000 permutations, cluster-forming threshold Z > 1.96). (D) The alpha-band power of 90 and 135 orientations also showed no significant effect (5000 permutations, cluster-forming threshold Z > 1.96).
Figure 5
Figure 5
Orientation information in low-gamma-band frequency. (A) Each line shows the average of ITPC values from 15 participants in the occipital area (90 (blue), 135 (red), 45 (black), and 0o (green)). The dashed line indicates the time of stimuli onset (t = 0 ms) and stimuli offset (t = 100 ms). The Horizontal black lines show the clusters of significant differences between orientations in the time window of 520- to 600-ms (within-subject Friedman, permutation test with 1000 permutations, participant = 15, cluster-forming threshold p < 0.05, corrected significance threshold p < 0.05). The bar plot illustrates the averaged ITPC values across the time window of significant periods (520 - 600 -ms) of each orientation. Error bars indicate 95 confidence intervals calculated across participants (n = 15). The Friedman showed a significant effect on the orientation’s average ITPC value for this time period. Asterisks above horizontal lines indicate significant differences between each pair of orientations (Post-hoc two-sided Wilcoxon tests). n.s: p > 0.05 , * p < 0.05, ** p < 0.01, *** p < 0.001. (B). Same as panel A, the average of ITPC values only for orientation 90 (blue), 45 (black) with Error shadings show 95 confidence intervals, calculated across participants (n = 15). The Horizontal lines show clusters of significant differences between orientation 90 against 45 (two-sided Wilcoxon tests, 5000 permutations, cluster-forming threshold Z > 1.96, the corrected significance threshold p < 0.05). Topography shows the associated differences of orientation 90 against 45 in low-gamma z-scored p-values of ITPC (30–50 Hz) in the 520–600 ms window (indicated in the solid line). Star indicates O2 significant site (5000 permutations, cluster-forming threshold Z > 2.56, corrected significance threshold p < 0.01). (C) ERO of low-gamma-band frequency for 90 and 45 orientations, which showed no significant effect (5000 permutations, cluster-forming threshold Z > 1.96). (D) The low-gamma-band power of 90 and 45 orientations also showed no significant effect (5000 permutations, cluster-forming threshold Z > 1.96).

Similar articles

References

    1. Kleinschmidt A, Lee BB, Requardt M, Frahm J. Functional mapping of color processing by magnetic resonance imaging of responses to selective p-and m-pathway stimulation. Exp. Brain Res. 1996;110:279–288. doi: 10.1007/BF00228558. - DOI - PubMed
    1. Engel S, Zhang X, Wandell B. Colour tuning in human visual cortex measured with functional magnetic resonance imaging. Nature. 1997;388:68–71. doi: 10.1038/40398. - DOI - PubMed
    1. Brouwer GJ, Heeger DJ. Decoding and reconstructing color from responses in human visual cortex. J. Neurosci. 2009;29:13992–14003. doi: 10.1523/JNEUROSCI.3577-09.2009. - DOI - PMC - PubMed
    1. Florian, S., Miller, E. K., Siegel, M. et al. Monkey EEG links neuronal color and motion information across species and scales. eLife8 (2019). - PMC - PubMed
    1. Hajonides J, Nobre A, Ede F, Stokes M. Decoding visual colour from scalp electroencephalography measurements. Neuroimage. 2021;237:118030. doi: 10.1016/j.neuroimage.2021.118030. - DOI - PMC - PubMed