. 2024 May 25;7(1):634.
doi: 10.1038/s42003-024-06300-8.

Impact of Ebola virus nucleoprotein on VP40 virus-like particle production: a computational approach

Affiliations

Impact of Ebola virus nucleoprotein on VP40 virus-like particle production: a computational approach

Xiao Liu et al. Commun Biol. .

Abstract

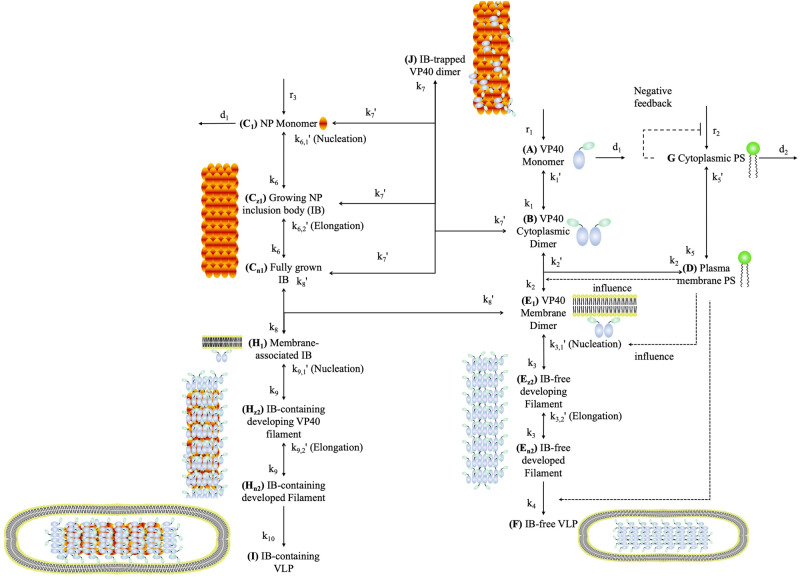
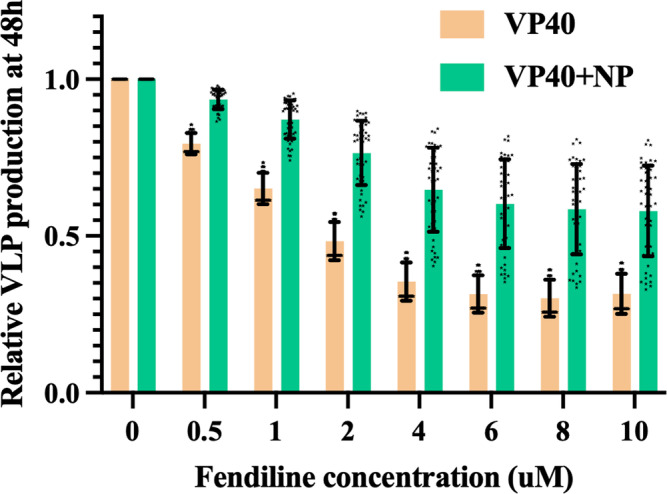
Ebola virus (EBOV) matrix protein VP40 can assemble and bud as virus-like particles (VLPs) when expressed alone in mammalian cells. Nucleoprotein (NP) could be recruited to VLPs as inclusion body (IB) when co-expressed, and increase VLP production. However, the mechanism behind it remains unclear. Here, we use a computational approach to study NP-VP40 interactions. Our simulations indicate that NP may enhance VLP production through stabilizing VP40 filaments and accelerating the VLP budding step. Further, both the relative timing and amount of NP expression compared to VP40 are important for the effective production of IB-containing VLPs. We predict that relative NP/VP40 expression ratio and time are important for efficient production of IB-containing VLPs. We conclude that disrupting the expression timing and amount of NP and VP40 could provide new avenues to treat EBOV infection. This work provides quantitative insights into EBOV proteins interactions and how virion generation and drug efficacy could be influenced.


Conflict of interest statement

The authors declare no competing interests.

Figures

Fig. 1
Fig. 1. Scheme of the NP-VP40 model.
The right side outlines the VP40 and PS model structure from prior work,; the left side outlines new model components relating to NP interactions. The VP40 model (right side) includes: VP40 monomer production (r1); VP40 monomer degradation (d1); reversible dimerization of VP40 monomers (forward rate k1, reverse rate k1’); reversible VP40 dimer association with host cell membrane PS (forward rate k2, reverse rate k2’); reversible oligomerization of VP40 dimers in a nucleation process (forward rate k3, reverse rate k3,1’); reversible oligomerization of VP40 dimers into mature filaments in an elongation process (forward rate k3, reverse rate k3,2’); and budding of mature empty VLPs from the host cell membrane (k4). This VP40 model is influenced by host cell PS levels (top right): cytoplasmic PS production (r2) and degradation (d2); cytoplasmic PS incorporation into the host cell membrane (forward rate k5, reverse rate k5’); and reversible association of membrane PS with cytoplasmic VP40 (forward rate k2, reverse rate k2’). Cytoplasmic PS has negative feedback on its own production (r2); and positive feedback on VP40 dimer membrane association (k2), reverse reaction of VP40 dimer oligomerization during nucleation (k3,1’), and VLP budding (k4). The NP-VP40 model (left side) includes NP monomer production (r3) and degradation (d1), reversible oligomerization of NP monomers in a nucleation process (forward rate k6, reverse rate k6,1’); reversible oligomerization of NP monomers into mature IBs in an elongation process (forward rate k6, reverse rate k6,2’); mature IBs binding to membrane associated VP40 dimers to become membrane associated IBs (forward rate k8, reverse rate k8’); membrane associated IBs producing IB-containing VP40 filaments (forward rate k9, reverse rate k9’); and budding of IB-containing VLPs (k10). In addition, cytoplasmic NP monomers and IBs bind and trap cytoplasmic VP40 dimers (forward rate k7, reverse rate k7’). Further details on model construction and equations can be found in the Materials and Methods section. Figure was generated in Microsoft Powerpoint using elements from our prior work,.
Fig. 2
Fig. 2. Simulation from NP-VP40 model reproduces experimental observations.
Experimental data represented in blue bars were data extracted from the published figures using Adobe Photoshop and Microsoft Excel,, and is summarized in Methods. Orange bars represent our model simulation results that were calibrated to the experimental data shown. a Simulated relative VLP production at 24 h is increased 1.96-fold on average when NP is co-expressed comparing to VP40-only, which falls within experimental the range of 3.6 ± 1.96 at 24 to 30 h. One sample t test results show that the simulations are significantly different from a ratio of 1 (p < 0.0001, n = 50). While the experimental ratio was not statistically significantly different from 1 (p = 0.15, n = 3), the sample size is small and all experimental data points are above 1. b Simulated plasma membrane VP40 ratio is 5.83 at 24 h when WT NP is co-expressed and significantly reduces to 1.2 when mutant NP is co-expressed (p < 0.0001, n = 50). This corresponds to ratios of 6.33 ± 1.55 and 0.64 ± 0.14 at 24 h in the experimental data (p = 0.01, n = 4), respectively. c Simulated relative VLP production when mutant NP is co-expressed with VP40 is 0.57 of the value for WT NP at 36 h (n = 50, significantly different from 1, p < 0.0001). This aligns with the experimental observations that the mutant NP leads to VLP production that is 0.31 ± 0.13 of WT production at 36 h (p = 0.002, n = 4). Error bars indicate SD.
Fig. 3
Fig. 3. Simulation-predicted VLP production from NP-VP40 system.
Total VLP production is increased during NP-VP40 co-expression compared to VP40-only, and the dominant form of VLPs is IB-containing VLP. On the other hand, IB-free VLP production is reduced compared to VP40-only system. Error bars indicate SEM.
Fig. 4
Fig. 4. Range of important parameter ratios between NP + VP40 and VP40-only system.
Our calibrated parameter values indicate that co-expression of NP decreases the dissociation constant for filament growth and increases VLP budding rate. Monomer production rate for NP is predicted to be much lower than VP40 in our system. Error bars indicate SD.
Fig. 5
Fig. 5. Simulation-predicted influence of IB-containing filament growth dissociation constant on VLP production.
a, b IB-free VLP production elevates as kD9,1 and kD9,2 increase from 0.1× to 10×. c, d IB-containing VLP production decreases when kD9,1 and kD9,2 increases. The reduction under large kD9,1 and kD9,2 is more obvious. Error bars indicate SEM.
Fig. 6
Fig. 6. Simulation-predicted influence of IB-containing VLP budding rate on VLP production.
a, b IB-free VLP production is not influenced by k10. c, d IB-free VLP production increases as k10 increases from 0.1× to 10×. Error bars indicate SEM.
Fig. 7
Fig. 7. Simulation-predicted influence of NP production rate on VLP production.
a, b IB-free VLP production decreases as r3 increases from 0.1× to 10×. c, d IB-containing VLP production decreases when r3 is either very small or large. Error bars indicate SEM. 31 out of 50 groups are used for analysis as others have met tolerance problems in ode-solver.
Fig. 8
Fig. 8. Simulation-predicted influence of NP/VP40 expression time on VLP production.
a, b IB-free VLP production increases as NP expression time (relative to VP40) becomes later. c, d IB-containing VLP production decreases as the expression time difference between NP and VP40 becomes larger. The highest IB-containing VLP production appears when NP expression time is between 0 and 5 h earlier than VP40 expression time. Error bars indicate SEM. 41 out of 50 groups are used for analysis as others have met tolerance problems in ode-solver. Simult.: Simultaneous start of expression of NP and VP40.
Fig. 9
Fig. 9. Simulation-predicted inhibition of VLP production by fendiline on VP40-only and NP-VP40 system.
While total VLP production is inhibited in both VP40-only and NP-VP40 system by fendiline, the reduction in VLP is smaller in NP-VP40 system. Error bars indicate SD.

Similar articles

References

    1. Groseth A, Feldmann H, Strong JE. The ecology of Ebola virus. Trends Microbiol. 2007;15:408–416. doi: 10.1016/j.tim.2007.08.001. - DOI - PubMed
    1. McElroy AK, et al. Ebola hemorrhagic fever: novel biomarker correlates of clinical outcome. J. Infect. Dis. 2014;210:558–566. doi: 10.1093/infdis/jiu088. - DOI - PMC - PubMed
    1. Ebola Virus Disease Distribution Map: Cases of Ebola Virus Disease in Africa Since 1976 | History | Ebola (Ebola Virus Disease) | CDC. https://www.cdc.gov/vhf/ebola/history/distribution-map.html (2021).
    1. Barbiero VK. Ebola: a hyperinflated emergency. Glob. Health Sci. Pract. 2020;8:178–182. doi: 10.9745/GHSP-D-19-00422. - DOI - PMC - PubMed
    1. Aschenbrenner DS. Monoclonal antibody approved to treat Ebola. Am. J. Nurs. 2021;121:22. - PubMed

Publication types

MeSH terms