. 2024 May 25;14(1):11985.
doi: 10.1038/s41598-024-62738-0.

Bioinformatics analysis and experimental verification of the cancer-promoting effect of DHODH in clear cell renal cell carcinoma

Affiliations

Bioinformatics analysis and experimental verification of the cancer-promoting effect of DHODH in clear cell renal cell carcinoma

Songsong Wang et al. Sci Rep. .

Abstract

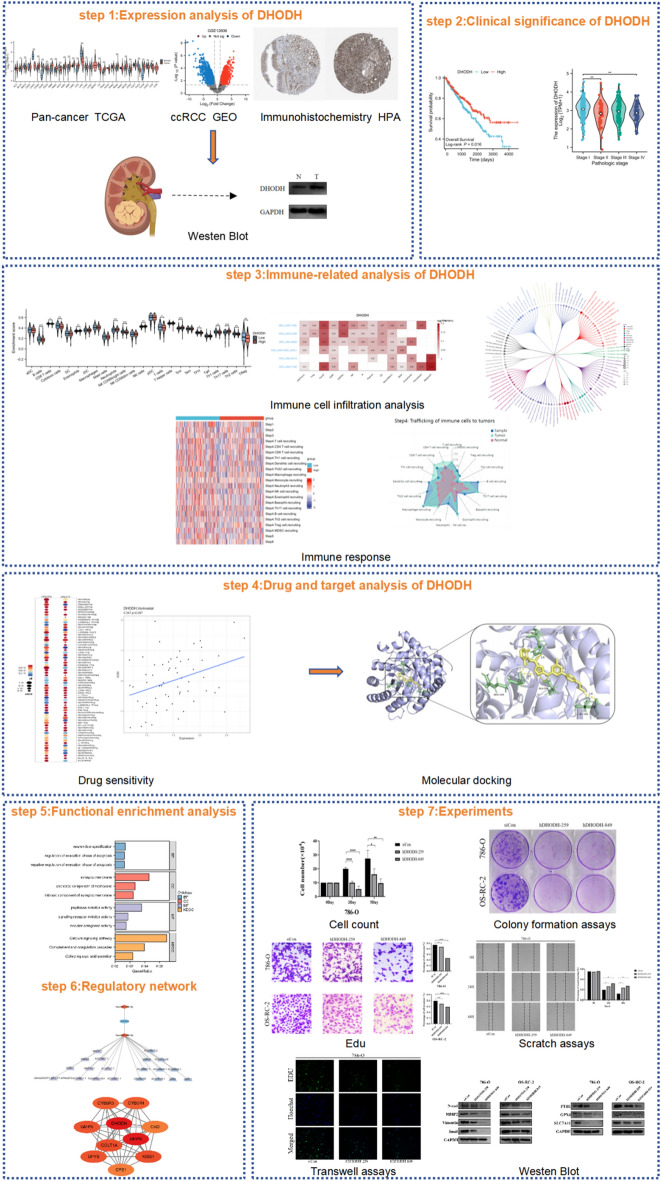
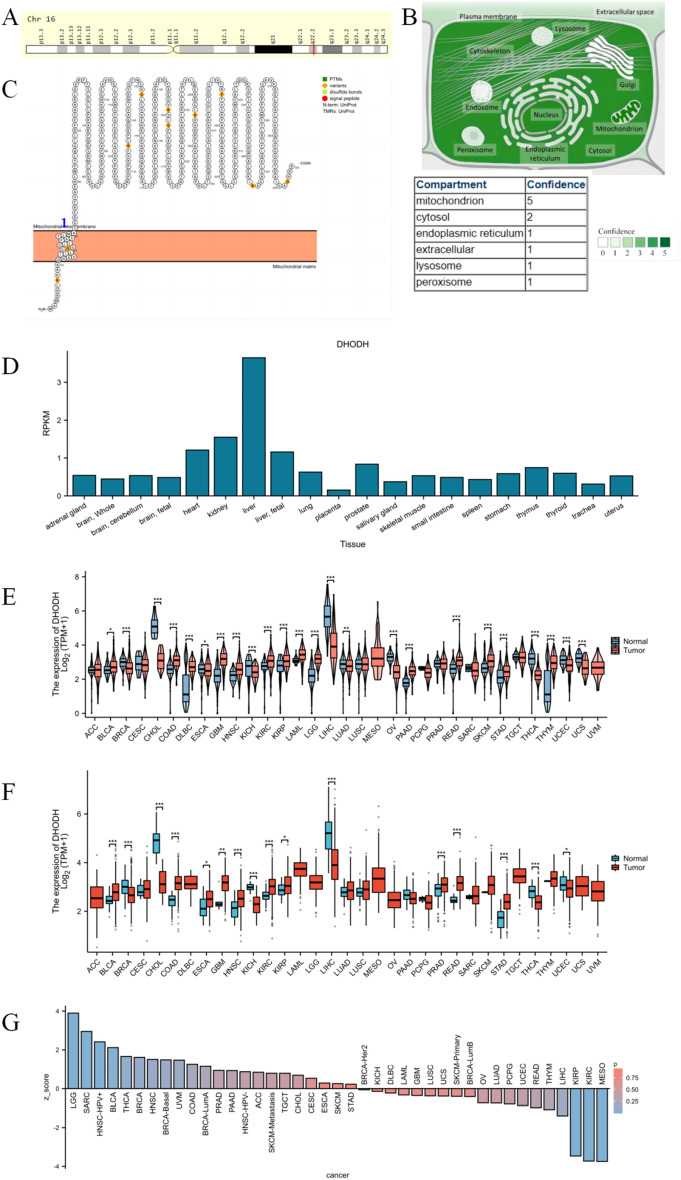
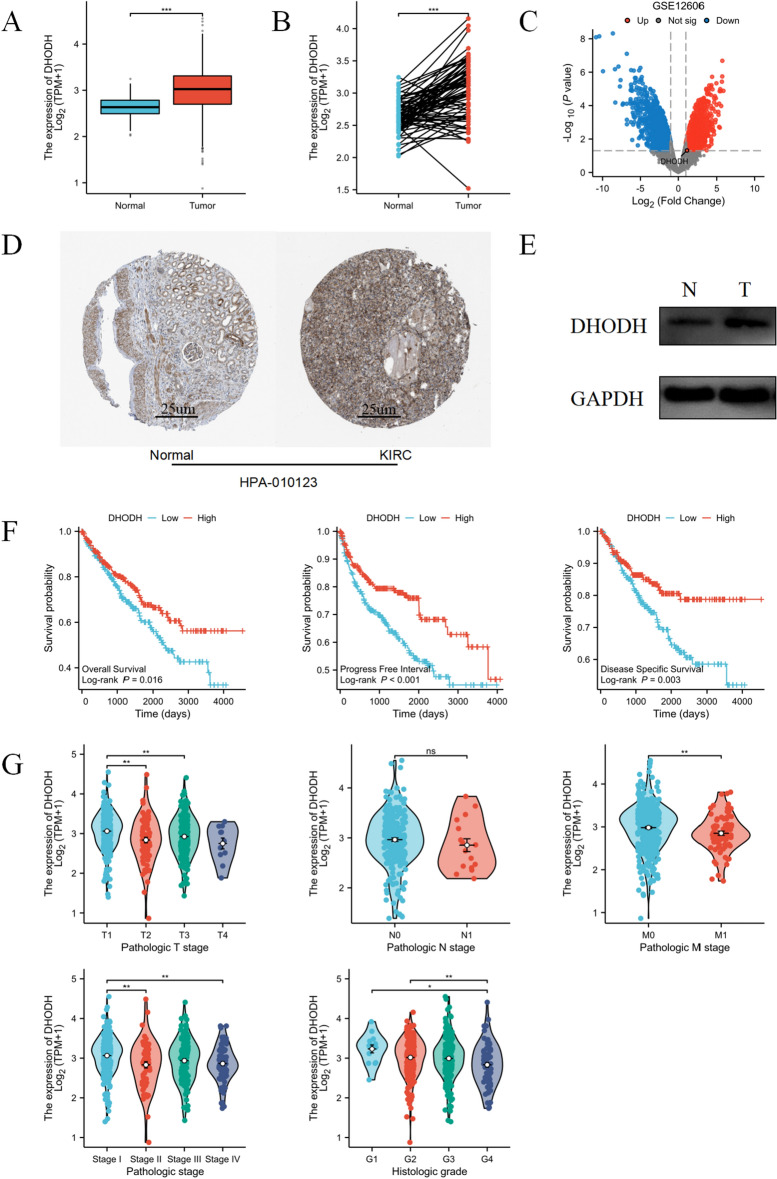
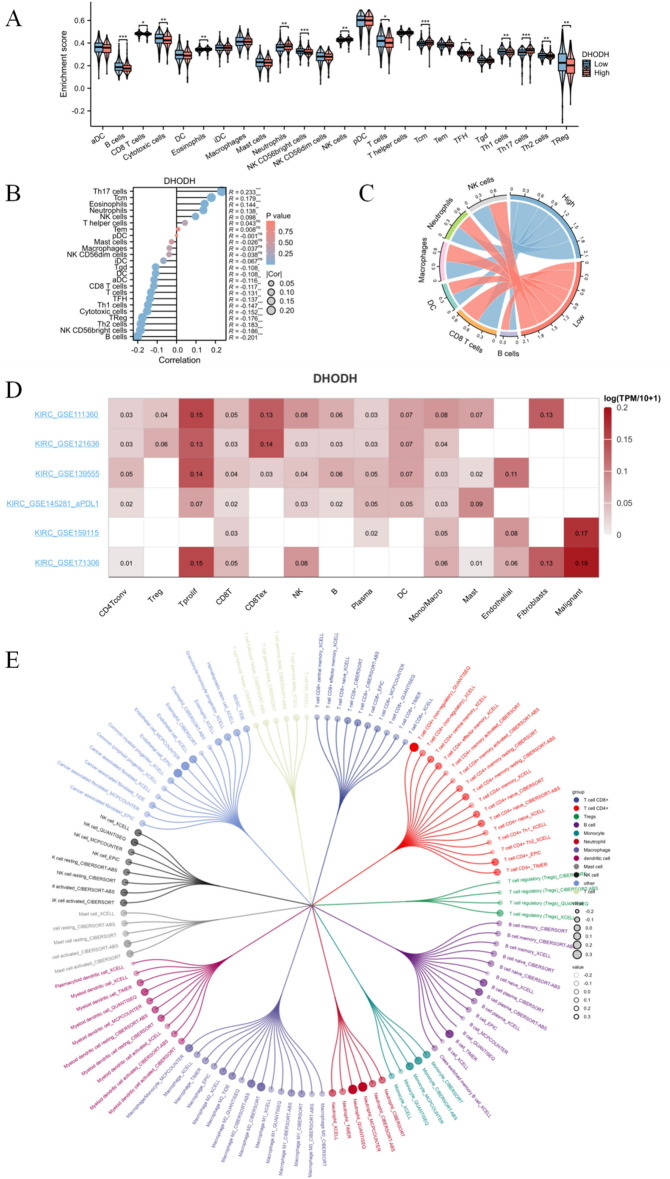
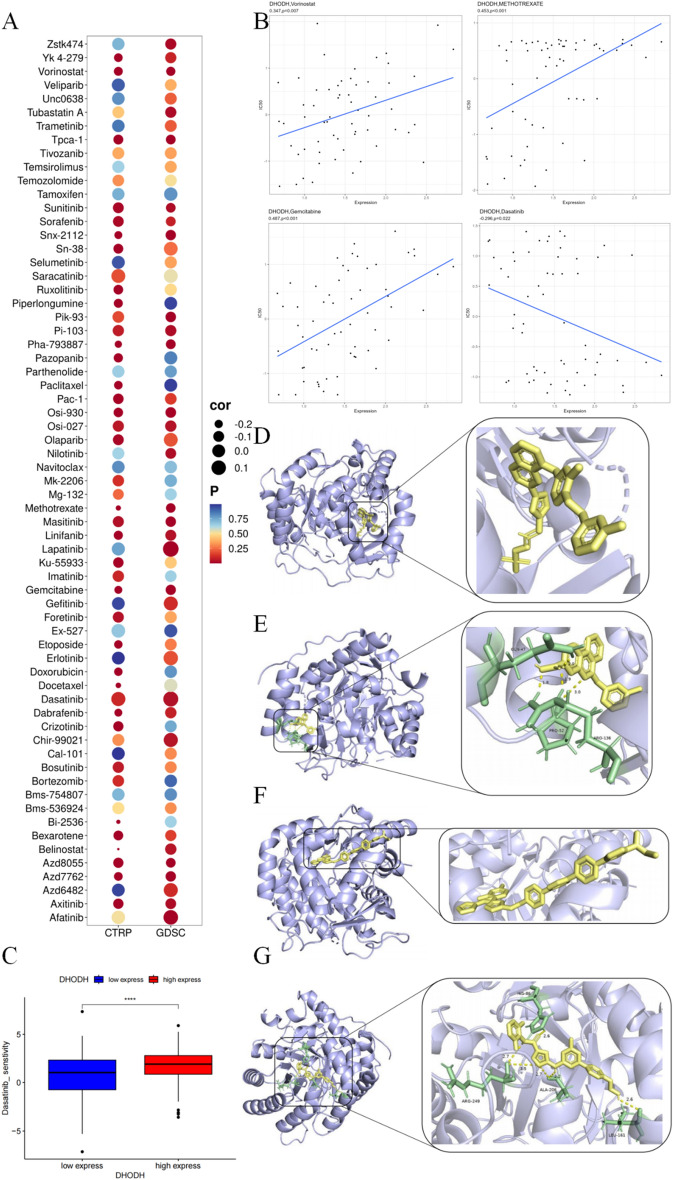
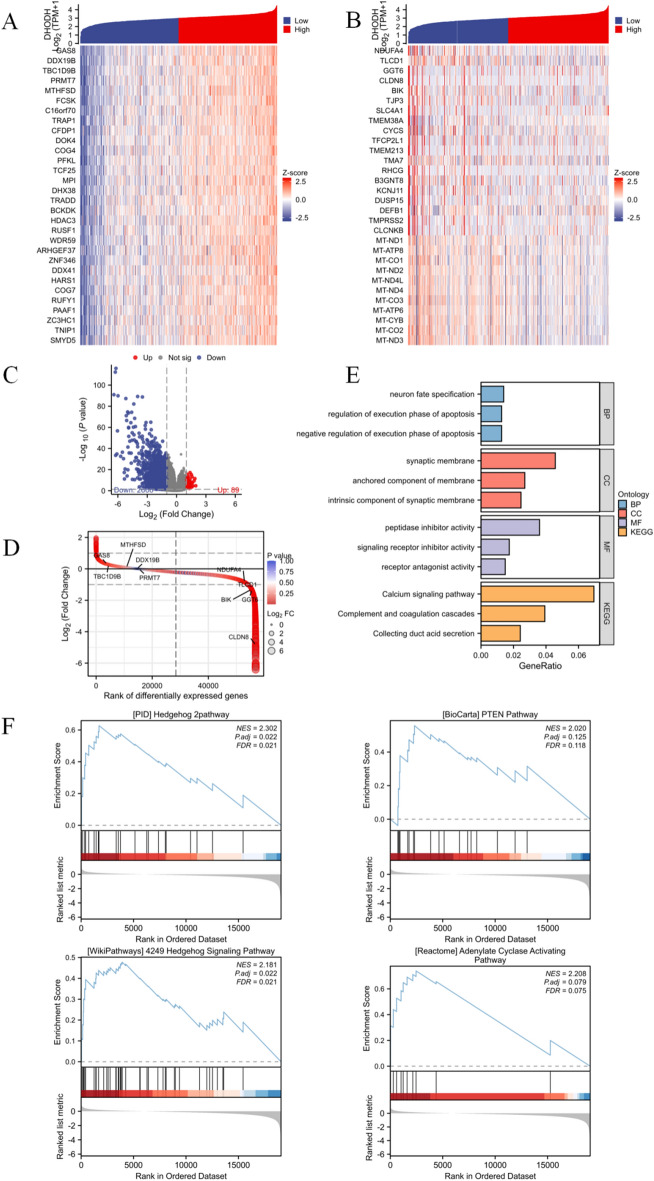
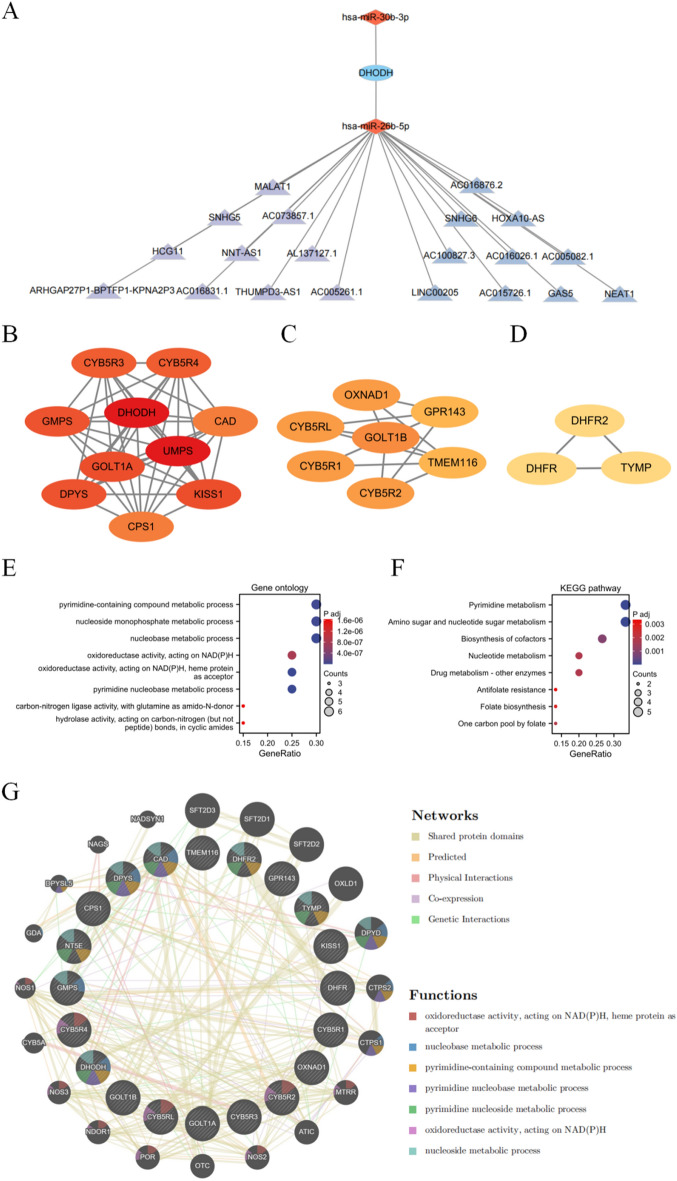
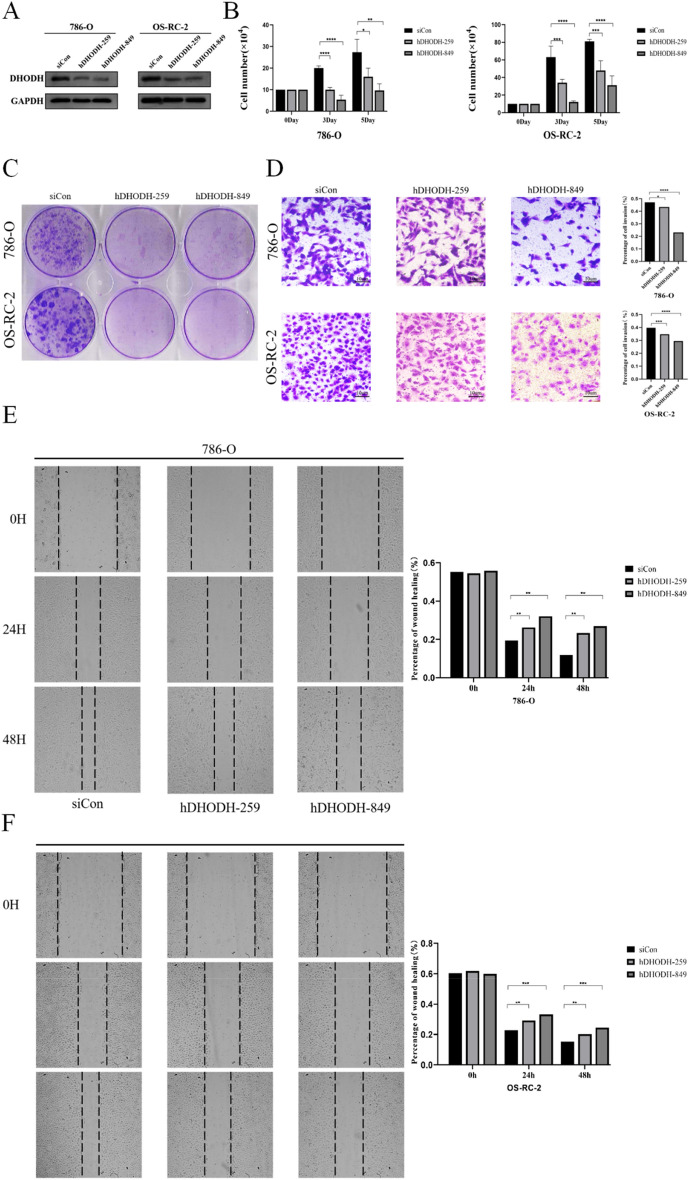
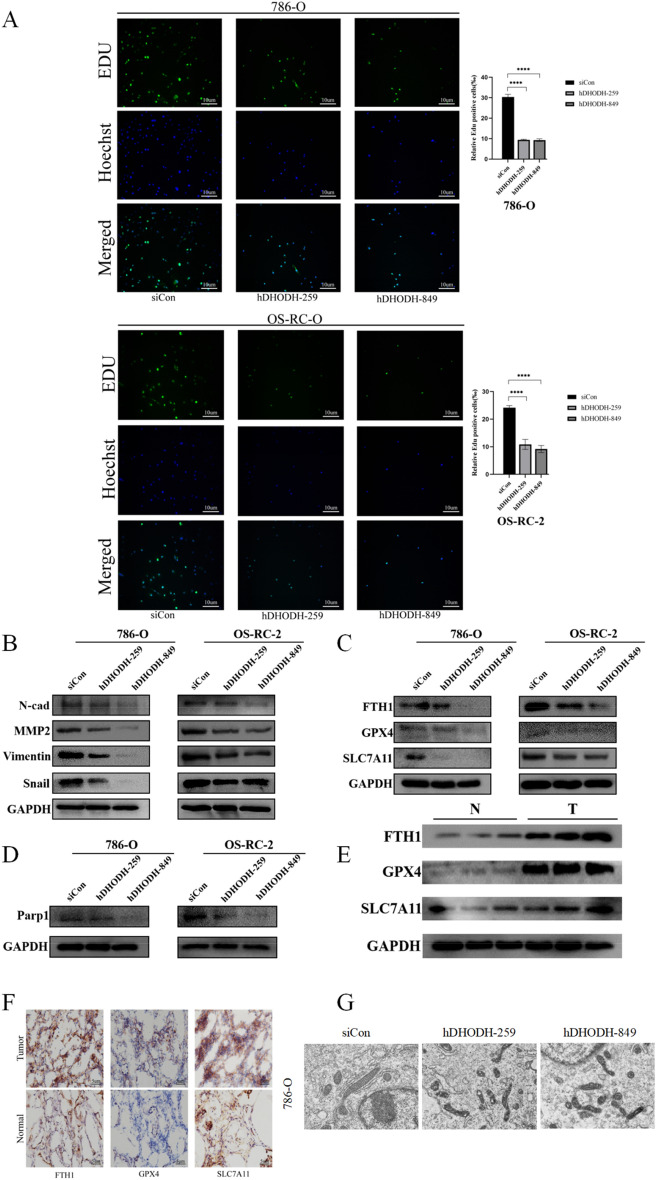
Clear cell renal cell carcinoma (ccRCC) is a malignant tumor of the urinary system. To explore the potential mechanisms of DHODH in ccRCC, we analyzed its molecular characteristics using public databases. TCGA pan-cancer dataset was used to analyze DHODH expression in different cancer types and TCGA ccRCC dataset was used to assess differential expression, prognosis correlation, immune infiltration, single-gene, and functional enrichment due to DHODH. The GSCALite and CellMiner databases were employed to explore drugs and perform molecular docking analysis with DHODH. Protein-protein interaction networks and ceRNA regulatory networks of DHODH were constructed using multiple databases. The effect of DHODH on ccRCC was confirmed in vitro. DHODH was highly expressed in ccRCC. Immune infiltration analysis revealed that DHODH may be involved in regulating the infiltration of immunosuppressive cells such as Tregs. Notably, DHODH influenced ccRCC progression by forming regulatory networks with molecules, such as hsa-miR-26b-5p and UMPS and significantly enhanced the malignant characteristics of ccRCC cells. Several drugs, such as lapatinib, silmitasertib, itraconazole, and dasatinib, were sensitive to DHODH expression and exhibited strong molecular binding with it. Thus, DHODH may promote ccRCC progression and is a candidate effective therapeutic target for ccRCC.

Keywords: Apoptosis; Bioinformatics; Clear cell renal cell carcinoma; DHODH; Ferroptosis; Immunotherapy.


Conflict of interest statement

The authors declare no competing interests.

Figures

Figure 1
Figure 1
Overview of research design, to provide a more understandable research ideas.
Figure 2
Figure 2
DHODH gene features and their pan-cancer relationship. (A) Chromosomal location of the DHODH gene; (B) Subcellular localization of the protein encoded by the DHODH gene, dihydroorotate dehydrogenase; (C) Topological structure of dihydroorotate dehydrogenase; (D) Expression of DHODH in various normal organs; (E) Pan-cancer differential expression of DHODH using TCGA database combined with the GTEx database; (F) Pan-cancer differential expression of DHODH using TCGA database; (G) Pan-cancer prognostic correlation of DHODH according to the TIMER database.
Figure 3
Figure 3
DHODH is highly expressed in ccRCC and indicates a better patient prognosis. (A) Differential expression of DHODH in paired samples of ccRCC in TCGA database. (B) Differential expression of DHODH in non-paired samples of ccRCC in TCGA database. (C) Differentially expressed genes from the ccRCC dataset, GSE12606, in the GEO database. (D) Protein expression differences in ccRCC tissues based on the immunohistochemical results obtained from the HPA public database (antibody number HPA-010123). (E) Western blot verification of the expression differences in DHODH at the protein level in ccRCC tissues. (F) Prognostic analysis of SH3PXD2B expression in patients with ccRCC, specifically OS, PFI, and DSS, using TCGA data. (G) Relationship between DHODH expression and T staging, N staging, M staging, pathologic stage, and histologic grade in patients with ccRCC.
Figure 4
Figure 4
Correlation analysis between immune cell infiltration and DHODH in ccRCC. (A) Differences in the infiltration scores of the following 24 immune cell types, activated DC cells (aDC), B cells, CD8 T cells, cytotoxic cells, DC cells, eosinophils, immature DC cells (iDC), macrophages, mast cells, neutrophils, NK CD56bright cells, NK CD56dim cells, NK cells, plasmacytoid DC cells (pDC), T cells, T helper cells, T central memory (Tcm), T effector memory cells (Tem), T follicular helper cells (Tfh), T gamma delta cells (Tgd), Th1 cells, Th17 cells, Th2 cells, and Treg cells between high and low DHODH expression groups. (B) Lollipop plots showing the correlation between infiltration scores of 24 immune cell types and DHODH gene expression in patients with ccRCC from TCGA database. (C) Chord diagram displaying the correlation between the expression of DHODH and that of six common immune cell types. (D) DHODH expression profile in different single cells across multiple GEO datasets. (E) Circular dendrogram demonstrating the correlation between DHODH and infiltration of 115 different subtypes of tumor-infiltrating immune cells.
Figure 5
Figure 5
Analysis of drug sensitivity and molecular docking of DHODH. (A) Correlation between DHODH expression and sensitivity to various drugs in CTRP and GDSC databases. (B) Four drugs significantly associated with DHODH expression in the CellMiner database. (C) Box plots demonstrating the sensitivity of dasatinib in samples with high and low DHODH expression. (D-G) Molecular docking of DHODH with lapatinib, silmitasertib, itraconazole, and dasatinib, respectively.
Figure 6
Figure 6
Correlation analysis and functional enrichment analysis of DHODH in ccRCC. (A) Top 30 coding genes that positively correlated with DHODH expression at the mRNA level in TCGA database according to Pearson correlation coefficient. (B) Top 30 coding genes that negatively correlated with DHODH expression at the mRNA level in TCGA database according to Pearson correlation coefficient. (C) Gene volcano plot of differential expression between high and low DHODH expression groups in TCGA-KIRC samples. (D) Ranking map of genes differentially expressed between high and low DHODH expression groups in TCGA-KIRC samples (ranked by lgFC). (E) KEGG enrichment analysis of the differentially expressed genes associated with DHODH. (F) Gene set enrichment genes of DEGs associated with DHODH.
Figure 7
Figure 7
The regulatory relationship of DHODH. (A) lncRNA-miRNA-mRNA network; the construction of a ceRNA network. (B-D) Highly connected target mRNAs were identified using MCODE. (E–F) GO and KEGG analyses of proteins interacting with DHODH. (G) DHODH co-expression network and function analysis based on the GeneMANIA database.
Figure 8
Figure 8
DHODH knockout attenuates the proliferation and migration of 786-O and OS-RC-2. (A) The expression of DHODH following knockout based on western blot analysis. (B) 786-O and OS-RC-2 cells were transfected with the control or DHODH siRNA and counted on days 0, 3, and 5. (C) 786-O and OS-RC-2 cells were transfected with the control or DHODH siRNA, and cell proliferation was detected via colony formation. (D) 786-O and OS-RC-2 cells were transfected with the control or DHODH siRNA, and cell invasion ability was analyzed using the transwell assay. (E–F) 86-O and OS-RC-2 cells were transfected with the control or DHODH siRNA, and cell migration ability was analyzed using the cell scratch assay. *P < 0.05, **P < 0.01, ***P < 0.001, ****P < 0.0001. The asterisk represents the degree of statistically significant difference (*P) (n = 3).
Figure 9
Figure 9
DHODH knockout attenuates the proliferation, migration, and ferroptosis of 786-O and OS-RC-2 cells. (A) Knockdown of DHODH in 786-O and OS-RC-2 cells and evaluation of the cell proliferation ability using the EDU assay. (B) Western Blotting was performed to determine the expression of EMT-related proteins in 786-O and OS-RC-2 cells transfected with DHODH or the control for 48 h. (C) Western blot analysis was performed to determine the expression of ferroptosis-related proteins in 786-O and OS-RC-2 cells after knockdown of DHODH. (D) Western blot analysis was performed to determine the expression of the apoptotic protein, Parp-1, after DHODH knockdown. (E) Expression of ferroptosis-related protein in ccRCC tissues and normal renal tissues. (F) Immunohistochemistry was performed to visualize the expression of ferroptosis-associated protein in normal renal tissue and renal clear cell carcinoma. (G) Changes in the mitochondria of renal clear cancer cells after DHODH knock down via transmission electron microscopy. Scale bar represents 1 µm (× 12000). *P < 0.05, **P < 0.01, ***P < 0.001, ****P < 0.0001. The asterisk represents the degree of statistically significant difference (n = 3).

Similar articles

Cited by

References

    1. Hou W, Ji Z. Generation of autochthonous mouse models of clear cell renal cell carcinoma: Mouse models of renal cell carcinoma. Exp. Mol. Med. 2018;50(4):1–10. doi: 10.1038/s12276-018-0059-4. - DOI - PMC - PubMed
    1. Wang Q, et al. Immune-associated gene signatures serve as a promising biomarker of immunotherapeutic prognosis for renal clear cell carcinoma. Front. Immunol. 2022;13:890150. doi: 10.3389/fimmu.2022.890150. - DOI - PMC - PubMed
    1. Zhou J, et al. High PRAS40 mRNA expression and its role in prognosis of clear cell renal cell carcinoma. Transl. Androl. Urol. 2020;9(4):1650–1660. doi: 10.21037/tau-20-741. - DOI - PMC - PubMed
    1. Larroquette C, et al. Combining immune checkpoint inhibitors with chemotherapy in advanced solid tumours: A review. Eur. J. Cancer. 2021;158:47–62. doi: 10.1016/j.ejca.2021.09.013. - DOI - PubMed
    1. Guven DC, et al. The association between albumin levels and survival in patients treated with immune checkpoint inhibitors: A systematic review and meta-analysis. Front. Mol. Biosci. 2022;9:1039121. doi: 10.3389/fmolb.2022.1039121. - DOI - PMC - PubMed

MeSH terms

Substances