. 2024 Jul 3;32(7):2150-2175.
doi: 10.1016/j.ymthe.2024.05.030. Epub 2024 May 24.

Neuroglobin overexpression in cerebellar neurons of Harlequin mice improves mitochondrial homeostasis and reduces ataxic behavior

Affiliations

Neuroglobin overexpression in cerebellar neurons of Harlequin mice improves mitochondrial homeostasis and reduces ataxic behavior

Hélène Cwerman-Thibault et al. Mol Ther. .

Abstract

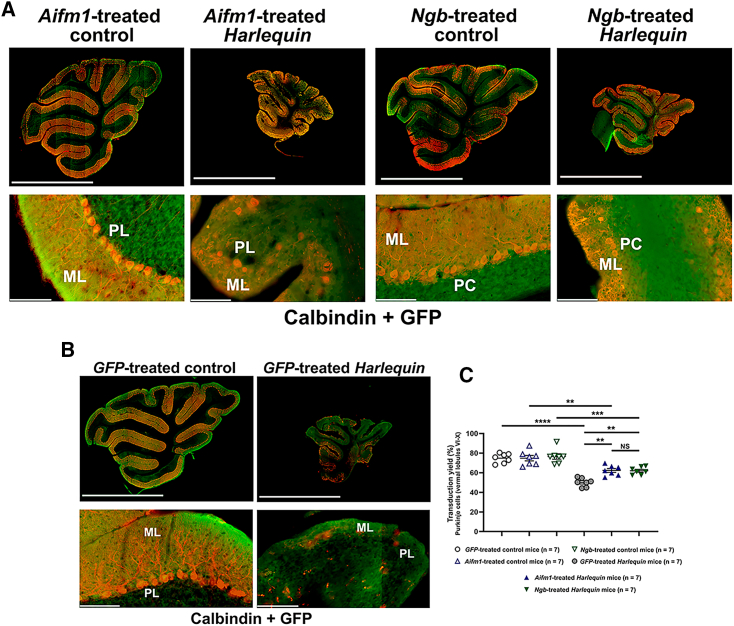
Neuroglobin, a member of the globin superfamily, is abundant in the brain, retina, and cerebellum of mammals and localizes to mitochondria. The protein exhibits neuroprotective capacities by participating in electron transfer, oxygen supply, and protecting against oxidative stress. Our objective was to determine whether neuroglobin overexpression can be used to treat neurological disorders. We chose Harlequin mice, which harbor a retroviral insertion in the first intron of the apoptosis-inducing factor gene resulting in the depletion of the corresponding protein essential for mitochondrial biogenesis. Consequently, Harlequin mice display degeneration of the cerebellum and suffer from progressive blindness and ataxia. Cerebellar ataxia begins in Harlequin mice at the age of 4 months and is characterized by neuronal cell disappearance, bioenergetics failure, and motor and cognitive impairments, which aggravated with aging. Mice aged 2 months received adeno-associated viral vectors harboring the coding sequence of neuroglobin or apoptosis-inducing factor in both cerebellar hemispheres. Six months later, Harlequin mice exhibited substantial improvements in motor and cognitive skills; probably linked to the preservation of respiratory chain function, Purkinje cell numbers and connectivity. Thus, without sharing functional properties with apoptosis-inducing factor, neuroglobin was efficient in reducing ataxia in Harlequin mice.

Keywords: AAV2/9 vectors; Apoptosis-inducing factor; Harlequin mice; Purkinje cells; gene therapy; mitochondria; neuroglobin; respiratory chain.


Conflict of interest statement

Declaration of interests An application for a patent has been filed on neuroglobin in Europe (EP22306002.1) and the United States (PCTEP2023/068369) in 2022 and 2023 (M.C.-D. and P.G).

Figures

None
Graphical abstract
Figure 1
Figure 1
Body and cerebellar weights of Harlequin mice subjected to gene therapy Comparison of body and cerebellar weights in control and Hq mice subjected to gene therapy with AAV2/9-GFP, AAV2/9-Aifm1, or AAV2/9-Ngb vector, at the age of 2 months and euthanized 6 months later. (A) Body weights follow a normal distribution; thus, the two-way ANOVA test was used. (B) Ratios of cerebellar weights to body weights were calculated to compare cerebellar weights in mice subjected to gene therapy. Data follow a Gaussian distribution, so the two-way ANOVA test was applied.The number of mice for each group evaluated appears below each column of the histograms. To compare the different groups, the GraphPad Prism 10.2 software was used. Adjusted p values in each histogram are as follows: p > 0.05: NS; ∗p ≤ 0.05; ∗∗p ≤ 0.01; ∗∗∗p ≤ 0.001; ∗∗∗∗p ≤ 0.0001. The detailed statistical analyses of the data are available in Table S3.
Figure 2
Figure 2
Gene therapy to target cerebellar neurons in Harlequin mice (A and B) Sagittal floating sections (40 μm) were prepared using a freezing microtome and stained with antibodies against calbindin (red) associated with antibody against GFP (green). The reconstruction of cerebellar sections obtained with the NanoZoomer Digital Pathology 2.0 HT scanner are illustrated for control mice treated with AAV2/9-GFP, AAV2/9-Aifm1, or AAV2/9-Ngb and Hq mice treated with AAV2/9-GFP, AAV2/9-Aifm1, or AAV2/9-Ngb; scale bars correspond to 2.5 mm. For each mouse, a higher magnification within lobule 9 was also shown (scale bar, 100 μm). The entire cerebellar area of the sections illustrated was calculated with ImageJ (in mm2) taking as reference the CALB labeling for GFP-treated Harlequin, 2.146; GFP-treated control, 8.622; Aifm1-treated Harlequin, 4.033; Aifm1-treated control, 8.522; Ngb-treated Harlequin, 3.934; Ngb-treated control, 8.46. ML, molecular layer; PL, Purkinje cell layer; PC, Purkinje cells. The concentrations of the primary and secondary antibodies used for immunohistochemistry are shown in Table S1. (C) The total number of Purkinje cells (Calbindin-positive cells), which were also stained with the GFP antibody, were counted in the posterior lobules (VI to X) for up to eight independent slices per mouse, this number is considered as the transduction yield of Purkinje cells in this region. Each bar corresponds to the means ± SEM obtained for each mouse group studied; their numbers are indicated in brackets (legend for each group). The overall data have been processed with GraphPad Prism 10.2. software and compared with the two-way ANOVA test (normal distribution of the data). The detailed statistical analyses of the data are available in Table S3.
Figure 3
Figure 3
Neuronal cell loss in cerebella from Harlequin mice (A) The reconstruction of cerebellar sections was obtained in scanned sections. DAPI labeling of nuclei (blue) is shown for one GFP-treated control mouse, one GFP-treated Hq mouse, one Aifm1-treated control mouse, one Aifm1-treated control mouse, one Ngb-treated control mouse, and one Ngb-treated Hq mouse. Each lobule is numbered from I to X in the images corresponding to the cerebellum from a control mouse and a Harlequin mouse (left side of the figure). The scale bars correspond to 2.5 mm. (B) Calbindin-positive cells were counted in reconstructed sections scanned with the NanoZoomer scanner using the NDP.view2 software. (C) The total number of Purkinje cells, labeled with the antibody against calbindin, was determined in the posterior lobules (VI to X) for up to six independent slices per mouse (left panel). (D) The total length of the Purkinje cell layer was calculated in the posterior part of the tissue between lobules VI to X a for up to six independent slices per mouse and is expressed in mm. (E) The number of Purkinje cells was normalized against the total length (mm) of the Purkinje cell layer between lobules VI to X (right panel). Histograms illustrate the means of values ± SEM for control and Hq mice, 6 months after vector administration. The numbers of mice evaluated for each vector are indicated in brackets.To compare the different groups, GraphPad Prism 10.2 software was used. The p values were determined by applying the Kruskal-Wallis test for Purkinje cell numbers since the groups deviated from a Gaussian distribution. For Purkinje cell layer length and the Purkinje cell number per mm, the groups were compared with the two-way ANOVA test (data followed a Gaussian distribution). p values in each histogram are as follow: p > 0.05: NS (not significant); ∗p ≤ 0.05; ∗∗p ≤ 0.01; ∗∗∗p ≤ 0.001; ∗∗∗∗p ≤ 0.0001. The detailed statistical analyses of the data are available in Table S3.
Figure 4
Figure 4
Relative abundance of neuroglobin and apoptosis-inducing factor in treated cerebella To estimate the steady-state levels of Ngb or Aifm1 mRNA, qPCR assays were performed using total RNAs isolated from cerebella of untreated control mice and Hq mice aged ∼8 months as well as Hq mice treated with either AAV2/9-Aifm1 and AAV2/9-Ngb at the age of 2 months and euthanized 6 months later. The number of RNA samples assessed is indicated below each bar of the histograms. The steady-state levels of the following mRNAs were measured: Aifm1, Ngb, calbindin (Calb), and Nd4; this latter is transcribed from the mitochondrial DNA and encodes the subunit 4 of respiratory chain complex I (NADH:ubiquinone oxidoreductase).Steady-state levels of Aifm1 mRNA (A), Ngb mRNA (B), Calb mRNA (C), and Nd4 mRNA (D) are shown as means ± SEMs after normalization against the mean signals for Aifm1, Ngb, Calb, or Nd4 mRNA measured in cerebellar preparations from untreated control mice. Statistical analyses were performed with the GraphPad Prism 10.2 software. The p values shown were calculated with respect to data collected from untreated control mice. Specific primers used for Aifm1, Ngb, Calb, and Nd4 mRNAs are shown in Table S2. (E) Representative images obtained when whole-protein extracts (30 μg) from Hq and control cerebella were subjected to western blot analyses; mice were euthanized at the age of 8 months. Proteins isolated from eight GFP-treated controls, six GFP-treated Hq mice, six Hq mice treated with the AAV2/9-Aifm1, and six Hq mice treated with the AAV2/9-Ngb vector were evaluated. The membranes were successively incubated with antibodies against neuroglobin (NGB), apoptosis-inducing factor (AIF), TOMM 20, ATP synthase subunit β, NDUFA9, and β-actin (as the loading control). Protein extracts from one GFP-treated control and one GFP-treated Hq mouse are shown in the left part of the image. Next, results for three cerebella from Hq mice injected with AAV2/9-Aifm1 and three cerebella of Hq mice injected with AAV2/9-Ngb are shown; all these samples run in the same SDS gel. Automatic molecular weight calculations for each band using GeneTools from Syngene are mentioned below each image: 65 kDa for AIF, 39 kDa for NDUFA9, 15 kDa for TOMM 20, 55 kDa for subunit β of ATP synthase and 42 kDa for β-actin, measures close from their theoretical molecular masses. The antibody against NGB yielded two main signals, with apparent molecular masses of 21 kDa, 19 kDa, and 17 kDa. The concentrations of the primary and secondary antibodies used are shown in Table S1. (F) Bar charts show the relative amounts of each of these proteins after the normalization of their signals against β-actin signal in cerebella from GFP-treated control mice, GFP-treated Hq mice, and cerebella isolated from Aifm1-or Ngb-treated Hq mice. The number of independent cerebella evaluated is shown for each group in the legend (bottom-right); each sample was run at least three times. The histograms were obtained using the means ± SEM for each sample. The p values shown were calculated with the GraphPad Prism 10.2 and detailed statistical analyses are available in Table S3.
Figure 5
Figure 5
Morphological analysis of cerebellar sections from Harlequin and control mice (A and B) Sagittal sections (40 μm) were prepared from control or Hq mice treated with either AAV2/9-Aifm1, AAV2/9-Ngb, or AAV2/9-GFP euthanized 6 months post-treatment and stained with the antibody against AIF or NGB combined with the antibody against calbindin (Calb). Illustrated are fluorescent signals for Ngb or AIF protein (green), calbindin (red), and the overlaying of the two labeling (Merge) for treated mice and two untreated Hq mice aged ∼8 months. DAPI was used to visualize all the nuclei (blue). Images were obtained from Leica TCS SP8 confocal microscope and the LAS X software; scale bars correspond to 100 μm (20× objective with a 0.75× zoom). The concentrations of the primary and secondary antibodies used for immunohistochemistry are shown in Table S1. (C) and (D) The intensity of AIF or NGB in order to be in agreement of the order (C) and (D) staining in cerebellar sections and their overall area in mm2 for NGB- or AIF-labeled slides were estimated with the ImageJ software using reconstructed cerebellar sections generated by the NDP 2.0 HT scanner and exported as tiff images. Values were plotted as means ± SEMs, the number of mice analyzed is indicated below each bar of the histograms. Reports of statistical significance, p values, from GraphPad Prism in each histogram are as follows: p > 0.05: NS (not significant); ∗p ≤ 0.05; ∗∗p ≤ 0.01; ∗∗∗p ≤ 0.001; ∗∗∗∗p ≤ 0.0001. The detailed statistical analyses of the data are illustrated in Table S3.
Figure 6
Figure 6
Ultrastructural changes in Purkinje cells from Harlequin mice subjected to gene therapy (A) Purkinje cells in untreated mice aged 8 months (control and Hq), one Aifm1-treated Hq mouse, and one Ngb-treated Hq mouse (from left to right in the figure). The top part shows Purkinje cell soma at low magnification (scale bar, 5 μm). The bottom part shows a zoom at high magnification (scale bar, 1 μm) to better assess the ultrastructure within the Purkinje cell soma of mitochondria (M); ∗ illustrates swollen mitochondria in untreated Hq mice (bottom part of the image). The following are the groups of mice examined: untreated control mice, 2; untreated Harlequin mice, 4; Ngb-treated control mice, 5; Aifm1-treated Harlequin mice, 5; Ngb-treated Harlequin mice, 5. (B) The histogram shows the percentage of highly swollen mitochondria (Category 4) in each mouse group; the number of Purkinje cell somas examined is indicated under each column. The comparison of each mouse group (by pairs) was performed using the unpaired Mann-Whitney test. (C) The histogram illustrates the number of synapses made between Purkinje cell axons and neurons located in the median deep nuclei per μm of length after the calculation of the neuron circumference (μm). The number of synapses counted is indicated under each column. Statistical evaluation was performed with GraphPad Prism; the detailed statistical analyses for each set of the data are available in Table S3.
Figure 7
Figure 7
Bioenergetics status of cerebella from Harlequin mice subjected to gene therapy (A) The enzymatic activity of respiratory chain complex I, complex III, complex IV (upper panel), complex V, citrate synthase and malate dehydrogenase (bottom panel) were assessed in cerebella isolated from Harlequin and control mice euthanized 6 months after the administration of recombinant AAV2/9 vectors. Cerebellar homogenates from the following groups were assessed: (1) GFP-treated control mice; (2) GFP-treated Harlequin mice; (3) Aifm1-treated control mice; (4) Aifm1-treated Harlequin mice; (5) Ngb-treated control mice; and (6) Ngb-treated Harlequin mice. Histograms illustrate the enzymatic activities as means ± SEM of each assay per sample measured in triplicate as described in the material and methods section. The numbers of independent samples tested are indicated below each column. Complex I and complex V activities are expressed as nanomoles of oxidized NADH/min/mg protein; complex IV activity is expressed as nanomoles of oxidized cytochrome c/min/mg protein. The citrate synthase activity is expressed as nanomoles of reduced 5.5′Dithio-bis 2-Nitrobenzoic acid (DTNB)/min/mg protein. Malate dehydrogenase activity is expressed as nanomoles of oxidized NADH/min/mg protein. (B) Ultra-performance liquid chromatography coupled with tandem mass spectrometry (UPLC-MS/MS) was carried out to determine the content of nucleotides and the energy charge (EC) in cerebellar homogenates from untreated control and Hq mice aged 8 months, Aifm1-treated Hq mice, and Ngb-treated Hq mice. Thus, the upper panel shows adenosine 5′-monophosphate (AMP); adenosine 5′-diphosphate (ADP); adenosine 5′-triphosphate (ATP); and energy charge, EC, which was calculated using the following formula: (ATP + 0.5 ADP)/(ATP + ADP + AMP). UPLC-MS/MS allowed also to determine three biomarkers of oxidative stress in frozen cerebellar samples belonging to the same groups used in the upper panel. Accordingly, the amounts of GSH, GSSG, cysteine, cystine, homocysteine and homocysteine were measured and the corresponding ratios were calculated. Graphic representations of values obtained for each group correspond to the means ± SEM, the number of mice per group are indicated in the corresponding legend. The overall statistical analyses were performed using the GraphPad Prism 10.2 program. p values in each histogram are as follows: p > 0.05: NS (not significant); ∗p ≤ 0.05; ∗∗p ≤ 0.01; ∗∗∗p ≤ 0.001; ∗∗∗∗p ≤ 0.0001. The detailed statistical analyses for the data are available in Table S3.
Figure 8
Figure 8
Assessment of motor and cognitive capacities of Harlequin mice subjected to gene therapy Control and Hq mice aged 2 months were subjected to gene therapy via stereotactic surgery, to deliver AAV2/9-GFP, AAV2/9-Aifm1, or AAV2/9-Ngb vector to each cerebellar hemisphere. Six months after vector administration, mice were subjected to an array of behavioral tests. (A and B) Representations of data obtained from two parameters evaluated with the Y-Maze test. (C) The overall locomotor activity of each mouse was evaluated by the measurement of the distance traveled in the whole arena (cm) of an open field device during the total duration of the test, i.e., 20 min. (D) Whole-limb grip strength test: Six trails were performed per mouse; this assay allows estimation of the muscular power of the four limbs and the mean ± SEM were plotted in the histogram shown. (E) Motor coordination and balance were assessed with the accelerating rotarod test, the latency time to fall in seconds is illustrated in the histogram as the mean ± SEM. (F) The open field test was used to estimate anxiogenic-like behavior. The percentage of time that the mouse remains close to the walls vs. in the center of the arena, during the first 10 min of the test, was plotted on the bar graph illustrated. (G) Stress-coping behavior was assessed by the tail suspension test, which allows measuring the immobilization time. This time is calculated during the last 4 min of the trail. The values for each test (A–G) were plotted using GraphPad Prism 10.2 software; they correspond to means ± SEMs. The number of animals evaluated per group is indicated below each bar chart. p values, from GraphPad Prism in each histogram are as follow: p > 0.05: NS (not significant); ∗p ≤ 0.05; ∗∗p ≤ 0.01; ∗∗∗p ≤ 0.001; ∗∗∗∗p ≤ 0.0001. The detailed statistical analyses of the data are available in Table S3.

References

    1. Rath S., Sharma R., Gupta R., Ast T., Chan C., Durham T.J., Goodman R.P., Grabarek Z., Haas M.E., Hung W.H.W., et al. MitoCarta3.0: an updated mitochondrial proteome now with sub-organelle localization and pathway annotations. Nucleic Acids Res. 2021;49:D1541–D1547. doi: 10.1093/nar/gkaa1011. - DOI - PMC - PubMed
    1. Rackham O., Filipovska A. Organization and expression of the mammalian mitochondrial genome. Nat. Rev. Genet. 2022;23:606–623. doi: 10.1038/s41576-022-00480-x. - DOI - PubMed
    1. Spinelli J.B., Haigis M.C. The multifaceted contributions of mitochondria to cellular metabolism. Nat. Cell Biol. 2018;20:745–754. doi: 10.1038/s41556-018-0124-1. - DOI - PMC - PubMed
    1. Bailey D.M. Oxygen and brain death; back from the brink. Exp. Physiol. 2019;104:1769–1779. doi: 10.1113/EP088005. - DOI - PubMed
    1. Seager R., Lee L., Henley J.M., Wilkinson K.A. Mechanisms and roles of mitochondrial localisation and dynamics in neuronal function. Neuronal Signal. 2020;4 doi: 10.1042/NS20200008. - DOI - PMC - PubMed

MeSH terms

LinkOut - more resources