. 2024 Nov;79(11):3047-3061.
doi: 10.1111/all.16174. Epub 2024 May 26.

Multi-omic integration reveals alterations in nasal mucosal biology that mediate air pollutant effects on allergic rhinitis

Affiliations

Multi-omic integration reveals alterations in nasal mucosal biology that mediate air pollutant effects on allergic rhinitis

Haritz Irizar et al. Allergy. 2024 Nov.

Abstract

Background: Allergic rhinitis is a common inflammatory condition of the nasal mucosa that imposes a considerable health burden. Air pollution has been observed to increase the risk of developing allergic rhinitis. We addressed the hypotheses that early life exposure to air toxics is associated with developing allergic rhinitis, and that these effects are mediated by DNA methylation and gene expression in the nasal mucosa.

Methods: In a case-control cohort of 505 participants, we geocoded participants' early life exposure to air toxics using data from the US Environmental Protection Agency, assessed physician diagnosis of allergic rhinitis by questionnaire, and collected nasal brushings for whole-genome DNA methylation and transcriptome profiling. We then performed a series of analyses including differential expression, Mendelian randomization, and causal mediation analyses to characterize relationships between early life air toxics, nasal DNA methylation, nasal gene expression, and allergic rhinitis.

Results: Among the 505 participants, 275 had allergic rhinitis. The mean age of the participants was 16.4 years (standard deviation = 9.5 years). Early life exposure to air toxics such as acrylic acid, phosphine, antimony compounds, and benzyl chloride was associated with developing allergic rhinitis. These air toxics exerted their effects by altering the nasal DNA methylation and nasal gene expression levels of genes involved in respiratory ciliary function, mast cell activation, pro-inflammatory TGF-β1 signaling, and the regulation of myeloid immune cell function.

Conclusions: Our results expand the range of air pollutants implicated in allergic rhinitis and shed light on their underlying biological mechanisms in nasal mucosa.

Keywords: DNA methylation; air pollution; allergic rhinitis; allergy; causal mediation; epigenome; gene expression; multi‐omic; nasal; systems biology; transcriptome.


Conflict of interest statement

Conflict of interest

The authors have declared that no conflict of interest exists.

Figures
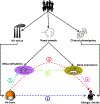
Figure 1:
Figure 1:. Study design.
For each participant, early-life air toxic data was obtained from the US EPA National Air Toxics Assessment, nasal samples were collected for DNA methylation and transcriptome profiling, and clinical phenotyping was undertaken. The following effects were systematically assessed: (1) air toxic on AR; (2) air toxic on DNA methylation; (3) DNA methylation on gene expression; and (4) gene expression on AR. Finally, casual mediation analysis (5) was performed to evaluate the degree to which CpG methylation and/or gene expression mediate air toxic effects on AR.
Figure 2:
Figure 2:. Associations between air toxic levels and allergic rhinitis.
(A) The volcano plot shows the coefficients (x-axis) and p-values (y-axis) obtained from logistic regression models for the 60 air toxics selected by elastic-net. Air toxics with a significant association (P < 0.05), as well as those that feature prominently in downstream analyses (acrylic acid and phosphine, in bold letters) are colored by red (positive association) or blue (negative association). (B) Bar plots showing the proportion of AR status (yes/no) by the quartiles of selected air toxics. The selected air toxics include the top two negatively-associated air toxics (cobalt compounds and quinone (p-benzoquinone)), the top two positively associated air toxics (antimony compounds and benzyl chloride), and two additional air toxics that feature prominently in downstream results (acrylic acid and phosphine).
Figure 3:
Figure 3:. Associations between air toxic levels and CpG methylation.
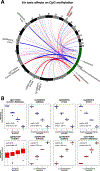
(A) The circos plot shows the 81 associations between air toxic and CpG methylation levels that were significant at P < 9e-8. The green section represents air toxics (ordered alphabetically) and the black/gray section represents CpGs by chromosome location. Edges indicate significant associations, with positive effects shown in red and negative effects shown in blue. The top three positive effects and top four negative effects are shown with thicker edges weighted by absolute t-statistic and labelled in black. Additionally, the association between phosphine and a CpG associated with THBS1, which factors prominently in downstream results, is also shown and labelled in maroon. (B) The boxplots show the covariate-adjusted methylation values for each air toxic by quartile for the eight associations shown in (A). Blue boxes are for negatively associated air toxics and red boxes indicate positively associated air toxics.
Figure 4:
Figure 4:. Associations between CpG methylation and gene expression.
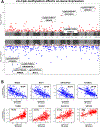
(A) Miami plot of cis-associations for CpGs located between 2.3KB upstream and 25.3KB downstream of the transcription start site. Positive associations are shown in the top panel and negative associations in the bottom. The effects are ordered by hg38 chromosome coordinates. The 374 significant associations (FDR < 0.05), as well as an additional association that features prominently in downstream results (cg04827020 – THBS1) are highlighted in red (positive) or blue (negative). The top effects by p-value, as well as the cg04827020-THBS1 effect, are labelled. (B) Scatterplots of relationships between gene expression and methylation levels for the associations labelled in (A). The percentage of variance in gene expression explained by variation in methylation of the corresponding CpG is in indicated on each scatterplot.
Figure 5:
Figure 5:. Gene expression associations with allergic rhinitis.
(A) Volcano plot for 19,995 genes associated with AR (FDR < 0.05). Genes overexpressed in AR are shown in red, and those under-expressed in blue. The top two under- and over-expressed genes, along with RHOH and THBS1, are labelled. (B) Miami plot of causal gene expression-phenotype associations identified by Mendelian randomization with −log10p-values shown on the y-axis either as positive associations (upper panel) or negative associations (lower panel) and ordered on the x-axis by hg38 genomic position. The 529 significant associations (FDR < 0.05) are shown either in red (positive associations, n=249) or blue (negative associations, n=280). The top three positively and negatively associated genes ranked by p-value, along with RHOH and THBS1, are labelled. (C) Scatterplot of the relationship between the −log10p-values obtained in the Mendelian randomization (B) and those obtained in the differential expression (A). Spearman’s Rho correlation values are shown. The 300 genes that show a significant association with AR in both MR and DE at p-value < 0.05 with matching directions of effect are highlighted in red (positive associations, n=42) or blue (negative associations, n=258). The top negatively and positively associated genes, ranked by p-value, along with THBS1 and RHOH, are labelled. (D) Bar plots showing the proportion of AR status by the SNP-score-adjusted-expression quartiles of selected genes. The selected genes include the top two negatively-associated genes (NUPR1 and CD74) and the top two positively associated genes (CD69 and ADGRE4P) identified based on the p-values obtained in the DE and MR analyses, as well as THBS1 and RHOH.
Figure 6:
Figure 6:. Significant paths identified in the multiple causal mediation analysis.
(A) Positive effect of phosphine concentration on AR mediated by an increase in methylation of a CpG in chromosome 15 (array ID: cg04827020) that leads to an increase in the expression of THBS1, which in turn is associated with increased odds of AR. (B) Positive effect of acrylic acid on AR mediated by the expression of RHOH, whose expression is increased by acrylic acid and is also positively associated with AR. While multiple serial mediation by CpG methylation and gene expression was also tested for this path, mediation by only gene expression yielded a lower p-value here.
Figure 7:
Figure 7:. Molecular context for the main findings of this study.
Four air toxics (benzyl chloride, antimony compounds, phosphine, and acrylic acid) are associated with increased odds of AR. Two additional air toxics (N,N-dimethylaniline and hexachloropentadiene) are not directly associated with AR but affect nasal mucosal biology by increasing or decreasing the methylation of genes involved in ciliary function and regulation of myeloid cells. Phosphine contributes to a pro-inflammatory environment by promoting DNA methylation of THBS1, resulting in increased gene expression that activates TGF-β1, which is known to promote effector T cell phenotypes in the airway. Acrylic acid increases the expression of RHOH, a gene known to be necessary for FCεR1 and IL33 receptor-mediated mast cell activation and degranulation. We also observed that additional genes known to be present in nasal secretions (e.g. PRB1, PRR4 and STATH) and pro-inflammatory mediators (e.g. CD69 and CCL4) show a positive causal relationship with AR. In contrast, genes previously known to be associated with viral airway infection (e.g. ZC3HAV1 and NUPR1) are negatively associated with AR.

References

    1. Zhang Y, Lan F, Zhang L. Advances and highlights in allergic rhinitis. Allergy 2021; 76:3383–9. - PubMed
    1. Dierick BJH, van der Molen T, Flokstra-de Blok BMJ, Muraro A, Postma MJ, Kocks JWH, van Boven JFM. Burden and socioeconomics of asthma, allergic rhinitis, atopic dermatitis and food allergy. Expert Rev Pharmacoecon Outcomes Res 2020; 20:437–53. - PubMed
    1. Vandenplas O, Vinnikov D, Blanc PD, Agache I, Bachert C, Bewick M, et al. Impact of Rhinitis on Work Productivity: A Systematic Review. Journal of Allergy and Clinical Immunology-in Practice 2018; 6:1274–+. - PubMed
    1. Devillier P, Bousquet J, Salvator H, Naline E, Grassin-Delyle S, de Beaumont O. In allergic rhinitis, work, classroom and activity impairments are weakly related to other outcome measures. Clinical and Experimental Allergy 2016; 46:1456–64. - PubMed
    1. Colas C, Brosa M, Anton E, Montoro J, Navarro A, Dordal MT, et al. Estimate of the total costs of allergic rhinitis in specialized care based on real-world data: the FERIN Study. Allergy 2017; 72:959–66. - PubMed

LinkOut - more resources