. 2024;18(3):101365.
doi: 10.1016/j.jcmgh.2024.101365. Epub 2024 May 24.

Hepatocellular RECK as a Critical Regulator of Metabolic Dysfunction-associated Steatohepatitis Development

Affiliations

Hepatocellular RECK as a Critical Regulator of Metabolic Dysfunction-associated Steatohepatitis Development

Ryan J Dashek et al. Cell Mol Gastroenterol Hepatol. 2024.

Abstract

Background & aims: Reversion-inducing cysteine-rich protein with Kazal motifs (RECK) is an extracellular matrix regulator with anti-fibrotic effects. However, its expression and role in metabolic dysfunction-associated steatohepatitis (MASH) and hepatic fibrosis are poorly understood.

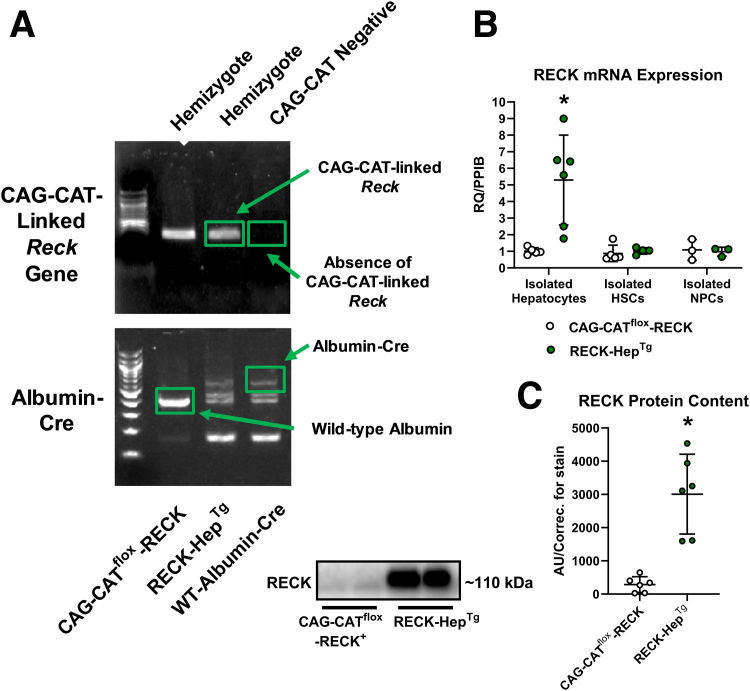
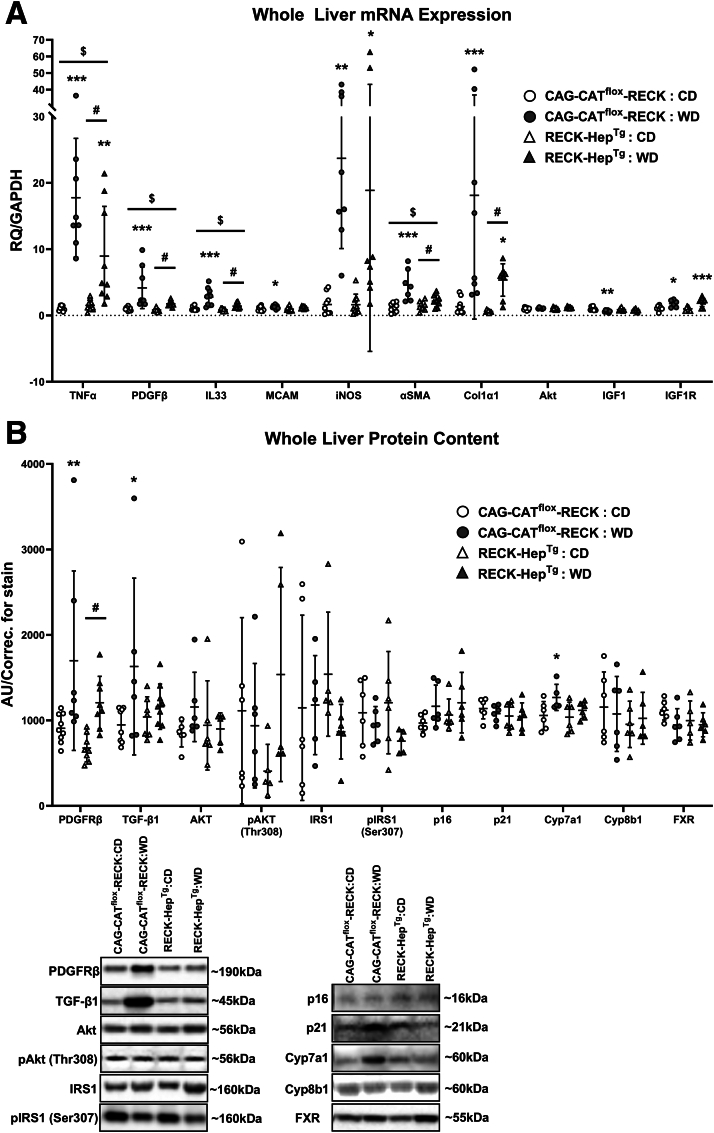
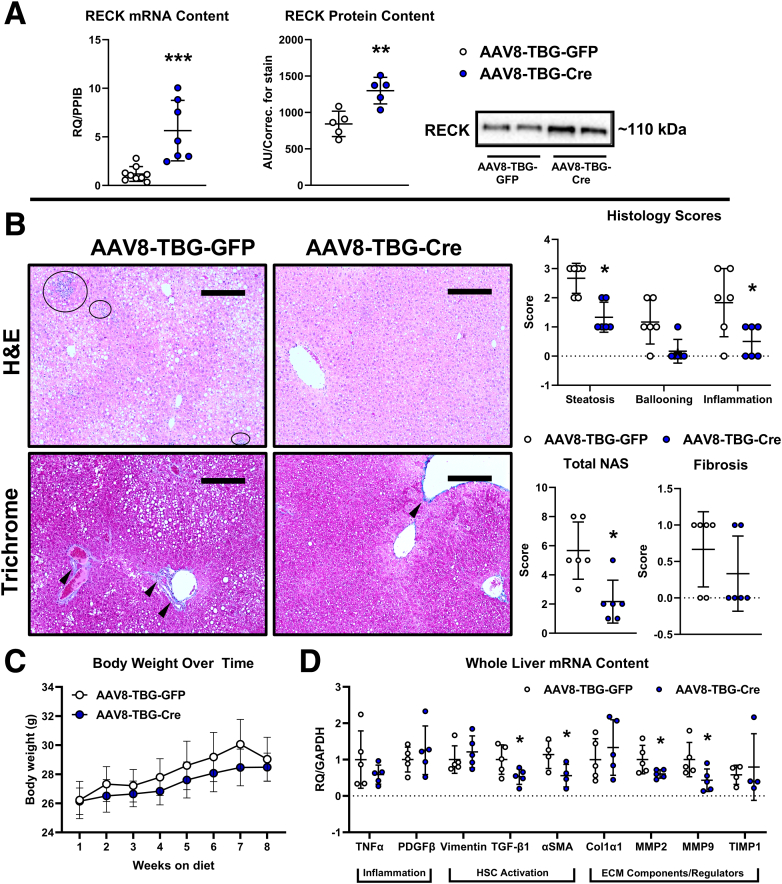
Methods: We generated a novel transgenic mouse model with RECK overexpression specifically in hepatocytes to investigate its role in Western diet (WD)-induced liver disease. Proteomic analysis and in vitro studies were performed to mechanistically link RECK to hepatic inflammation and fibrosis.

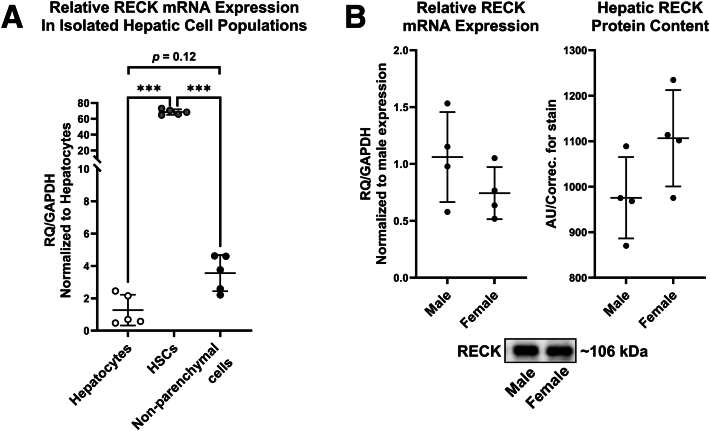
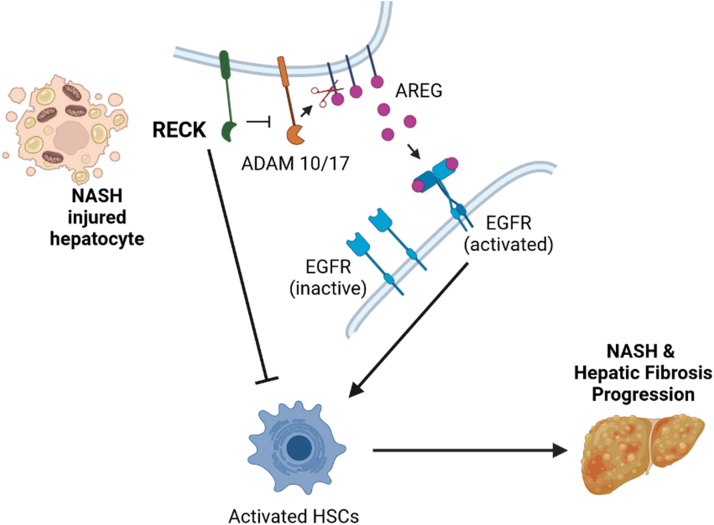
Results: Our results show that RECK expression is significantly decreased in liver biopsies from human patients diagnosed with MASH and correlated negatively with severity of metabolic dysfunction-associated steatotic liver disease (MASLD) and fibrosis. Similarly, RECK expression is downregulated in WD-induced MASH in wild-type mice. Hepatocyte-specific RECK overexpression significantly reduced hepatic pathology in WD-induced liver injury. Proteomic analysis highlighted changes in extracellular matrix and cell-signaling proteins. In vitro mechanistic studies linked RECK induction to reduced ADAM10 (a disintegrin and metalloproteinase domain-containing protein 10) and ADAM17 activity, amphiregulin release, epidermal growth factor receptor activation, and stellate cell activation.

Conclusion: Our in vivo and mechanistic in vitro studies reveal that RECK is a novel upstream regulator of inflammation and fibrosis in the diseased liver, its induction is hepatoprotective, and thus highlights its potential as a novel therapeutic in MASH.

Keywords: Amphiregulin; Epidermal Growth Factor Receptor; Extracellular Matrix; Fatty Liver Disease; MASH; MASLD; NAFLD; NASH; Reversion-inducing Cysteine-rich Protein With Kazal Motifs; Steatosis.


Figures

Figure 1
Figure 1
Downregulation of RECK in human patients withMASLD/NAFLD as well as mice fed a WD. (A) Representative H&E, trichrome, and RECK immunohistochemistry staining for each of the 3 NAS groupings (scale bar represents 50 μm). (B) Human patients presenting for bariatric surgery had diminished hepatic RECK protein content, correlating with worsening disease as assessed via NAS (C); and fibrosis (D) (n = 5–9/group). Feeding WT C57BL/6 mice a WD for 16 weeks significantly lowered hepatic RECK, and increased RECK-inhibitory targets mRNA content compared with CD-fed cohorts (n = 6–8/group). Bars in scatter plots indicate mean ± SD. ∗Indicates significance compared with control subjects or CD-fed animals, P ≤ .05, ∗∗Indicates P ≤ .01, and ∗∗∗Indicates P ≤ .001.
Figure 2
Figure 2
Cellular RECK expression data. (A) RECK mRNA expression from hepatocytes, HSCs, and NPCs isolated from male C57BL/6 mice fed a CD. (B) RECK mRNA and protein content from hepatocytes isolated from male and female C57BL/6 mice fed a CD. n = 4–6/group. Bars in scatter plots indicate mean ± SD. ∗∗∗indicates P ≤ .001 vs hepatocytes and NPCs.
Figure 3
Figure 3
Confirmation of transgenic Reck manipulation in mouse models using primary hepatocytes collected from animals on a CD. (A) Genotyping images displaying the presence of the CAG-CATflox-RECK transgene and the presence of Albumin-Cre in the CAG-CATflox-RECK and RECK-HepTg mouse lines; (B) mRNA expression; (C) total protein content, and representative Western images from isolated primary hepatocytes, including mRNA expression from isolated HSCs, and NPCs from CAG-CATflox-RECK and RECK-HepTg animals fed CD (n = 5–6/group). Bars in scatter plots indicate mean ± SD. ∗Indicates significance compared with controls, P ≤ .05.
Figure 4
Figure 4
Effects of germline hepatocyte-specificRECK overexpression in a murine model of diet-inducedMASH. (A) Representative liver H&E and (B) PSR staining from the CAG-CATflox-RECK (left) and RECK-HepTg (right) mice fed CD or WD for 24 weeks. Circles indicate regions of increased cellularity suggesting inflammatory foci; arrowheads indicate areas of fibrosis. Scale bar represents 100 μm. (C) Histological scoring and total NAS based on H&E images, and fibrosis scores based on PSR images. (D) Body weight of animals over the 24-week feeding regime. n = 8–11/group for all experiments. Bars in scatter plots indicate mean ± SD. ∗Indicates main effect of diet, #indicates main effect for genotype, $indicates a significant interaction between diet and genotype. ∗, #, and $indicate P ≤ .05, ∗∗, ##, and $$indicate P ≤ .01, and ∗∗∗indicates P ≤ .001.
Figure 5
Figure 5
Serum measurements of male CAG-CATflox-RECK and RECK-HepTgmice following a 24-week WD regime. n = 4–8/group. Bars in scatter plots indicate mean ± SD. ∗Indicates main effect of diet, $indicates a significant interaction between diet and genotype, ∗ and $indicate P ≤ .05, ∗∗indicates P ≤ .01, and ∗∗∗indicates P ≤ .001.
Figure 6
Figure 6
Effects of germline hepatocyte-specific RECK overexpression in a murine model of diet-induced NASH on markers of HSC activation and inflammation. Representative liver IHC staining for RECK (A), αSMA (B), and CD68 (C) from the CAG-CATflox-RECK and RECK-HepTg mice fed CD or WD for 24 weeks. Scale bar represents 100 μm.
Figure 7
Figure 7
Effects of germline hepatocyte-specificRECK overexpression in a murine model of diet-induced MASH. Whole liver (A) mRNA and (B) protein content of inflammatory, HSC activation markers, ECM components, insulin signaling components, senescence markers, and bile acid signaling proteins with representative Western images included (n = 5–10/group). Bars in scatter plots indicate mean ± SD. ∗Indicates main effect of diet, #indicates main effect for genotype, $indicates a significant interaction between diet and genotype. ∗, #, and $indicate P ≤ .05, ∗∗, ##, and $$indicate P ≤ .01, and ∗∗∗indicates P ≤ .001.
Figure 8
Figure 8
Effects of germline hepatocyte-specificRECK overexpression in a female murine model of diet-induced MASH. (A) Representative liver H&E and (B) PSR staining from the CAG-CATflox-RECK (left) and RECK-HepTg (right) mice fed CD or WD for 24 weeks. Circles indicate regions of increased cellularity suggesting inflammatory foci; arrowheads indicate areas of fibrosis. Scale bar represents 100 μm. (C) Histological scoring and total NAS based on H&E images, and fibrosis scores based on PSR images. (D) Body weight of animals over the 24-week feeding regime. n = 3–5 for all experiments. Bars in scatter plots indicate mean ± SD. ∗Indicates main effect of diet, #indicates main effect for genotype, $indicates a significant interaction between diet and genotype. ∗, #, and $indicate P ≤ .05, ∗∗, ##, and $$indicate P ≤ .01, and ∗∗∗indicates P ≤ .001.
Figure 9
Figure 9
Effects of induced hepatocyte-specificRECK overexpression on liver histology following 8 weeks of WD feeding. (A) RECK content of whole liver tissue, (B) representative liver H&E, trichrome staining, and histological scoring (histological scoring with total NAS based on H&E images, fibrosis scores based on trichrome images; circles indicate regions of increased cellularity suggesting inflammatory foci, arrowheads indicate areas of fibrosis), (C) body weight over the 8-week feeding regime, and (D) whole liver mRNA content of inflammatory, fibrosis, and HSC activation markers from CAG-CATflox-RECK animals injected with either AAV8-TBG-Cre or AAV8-TBG-GFP and fed a WD for 8 weeks (n = 6–8/group). Bars in scatter plots indicate mean ± SD. ∗Indicates main effect of AAV-driven RECK overexpression. ∗Indicates P ≤ .05, ∗∗indicates P ≤ .01, and ∗∗∗indicates P ≤ .001.
Figure 10
Figure 10
Effects of hepatocyte-specificRECK induction on liver physiology following establishment of diet-induced MASH. (A) RECK protein and mRNA content of whole liver tissue and isolated hepatocytes; (B) representative liver H&E (circles indicate regions of increased cellularity suggesting inflammatory foci); (C) body weight over the 20-week total feeding regime; and (D) whole liver protein content of inflammatory and HSC activation markers (n = 3–5/group). Bars in scatter plots indicate mean ± SD. ∗Indicates main effect of virus. ∗Indicates P ≤ .05, ∗∗indicates P ≤ .01, and ∗∗∗indicates P ≤ .001.
Figure 11
Figure 11
Proteomic analysis of CAG-CATflox-RECK and RECK-HEPTg mice. (A) The number of significantly differential proteins when comparing CAG-CATflox-RECK and RECK-HepTg mice fed a CD or a WD. (B) Predicted significantly altered pathways in RECK-HepTg mice compared with CAG-CATflox-RECK mice fed a WD ranked by absolute z-score; and (C) heat map comparison of the most significantly altered pathways between groups on a CD or a WD, with subset of significantly (q-value ≤ 0.10) altered proteins relating to tissue fibrosis as measured by proteomic analysis. Predictive pathway analysis examining probed proteins and their predicted upstream regulators involved in the processes of inflammation (D) and fibrosis (E), n = 6/group for all analyses.
Figure 12
Figure 12
Altered AREG content and EGFR phosphorylation in liver tissue of human patients undergoing bariatric surgery and WD-fed mice. (A) Hepatic AREG mRNA and pEGFR(Y1068)/EGFR protein ratio was increased in human patients with worsening NAFLD as evidenced by histological correlation (n = 5–9). (B) Mice fed a WD for 16 weeks had increased hepatic AREG mRNA (n = 7–8). (C) CAG-CAT-RECK and RECK-HepTg mice fed a CD or WD for 24 weeks displayed blunted AREG mRNA induction in RECK-HEPTg mice fed a WD, as well as decreased pEGFR(Y1068)/EGFR protein ratio (n = 7–9). We also assessed hepatic AREG and pEGFR(Y1173) protein from CAG-CAT-RECKflox mice (D) injected with an AAV-Cre or control virus (AAV-GFP) and fed a WD for 8 weeks (n = 5–7). Bars in scatter plots indicate mean ± SD. ∗Indicates significance compared with controls or main effect of diet where appropriate, #indicates main effect for genotype. ∗ and #indicate P ≤ .05, ∗∗ and ##indicate P ≤ .01, and ∗∗∗indicates P ≤ .001.
Figure 13
Figure 13
Effects of in vitro RECK manipulation on hepatocellular physiology, mechanistic effects on HSC activation. Primary hepatocytes harvested from WT adult male C57BL/6 mice were treated with either an siRNA targeting RECK mRNA (siRECK) (or a scrambled sequence of RNA [siScr] as a control) or an adenovirus encoding for a RECK plasmid (Adv-RECK) (or a control protein [Adv-β-Gal]) while in media containing 50 μg/ml TNF-α. RECK content, EGFR protein analysis, and ADAM proteolytic activity of siRNA treated cells (A) and adenovirus treated cells (C). A subset of isolated hepatocytes was treated with 10 μM of the ADAM10 and ADAM17 inhibitor GW280264X (ADAM10/17i) or control substrate (DMSO) and assessed for AREG protein content, mRNA expression, and secreted AREG in cell media in siRNA treated cells (B) and adenovirus treated cells (D), n = 4–6/group for all experiments. (E) Effects of exogenous AREG (100 μg/mL) and the EGFR inhibitor erlotinib (5M) (EGFRi) on primary hepatic stellate cells harvested from WT adult male C57BL/6 mice, n = 3. (F) Scratch wound assay results of isolated primary HSC taken from CAG-CATflox-RECK and RECK-HepTg mice fed a WD for 10 weeks with example images, n = 5–7. Bars in scatter plots indicate mean ± SD. ∗Indicates significance compared with control, #indicates significance compared with RECK-manipulated control (vs siRECK or RECK-Adv). ∗Indicates P ≤ .05, ∗∗indicates P ≤ .01, and ∗∗∗indicates P ≤ .001.
Figure 14
Figure 14
Proposed schematic of RECK mechanistic influence over pathogenesis and disease progression ofMASH/NASH through regulation of ADAM10/17, amphiregulin release, and EGFR activation in hepatic stellate cells, contributing to liver inflammation and fibrosis.

References

    1. Eslam M., Sanyal A.J., George J., International Consensus Panel. MAFLD: a consensus-driven proposed nomenclature for metabolic associated fatty liver disease. Gastroenterology. 2020;158:1999–2014.e1. - PubMed
    1. Zou B., Yeo Y.H., Nguyen V.H., Cheung R., Ingelsson E., Nguyen M.H. Prevalence, characteristics and mortality outcomes of obese, nonobese and lean NAFLD in the United States, 1999-2016. J Intern Med. 2020;288:139–151. - PubMed
    1. Nagini S. RECKing MMP: relevance of reversion-inducing cysteine-rich protein with kazal motifs as a prognostic marker and therapeutic target for cancer (a review) Anticancer Agents Med Chem. 2012;12:718–725. - PubMed
    1. Siddesha J.M., Valente A.J., Sakamuri S.S., et al. Angiotensin II stimulates cardiac fibroblast migration via the differential regulation of matrixins and RECK. J Mol Cell Cardiol. 2013;65:9–18. - PMC - PubMed
    1. Somanna N.K., Valente A.J., Krenz M., et al. Histone deacetyltransferase inhibitors Trichostatin A and Mocetinostat differentially regulate MMP9, IL-18 and RECK expression, and attenuate Angiotensin II-induced cardiac fibroblast migration and proliferation. Hypertens Res. 2016;39:709–716. - PubMed

MeSH terms

LinkOut - more resources