. 2024 May 27;40(1):40.
doi: 10.1007/s10565-024-09873-6.

Downregulation of MYBL1 in endothelial cells contributes to atherosclerosis by repressing PLEKHM1-inducing autophagy

Affiliations

Downregulation of MYBL1 in endothelial cells contributes to atherosclerosis by repressing PLEKHM1-inducing autophagy

Shi-Ao Ding et al. Cell Biol Toxicol. .

Abstract

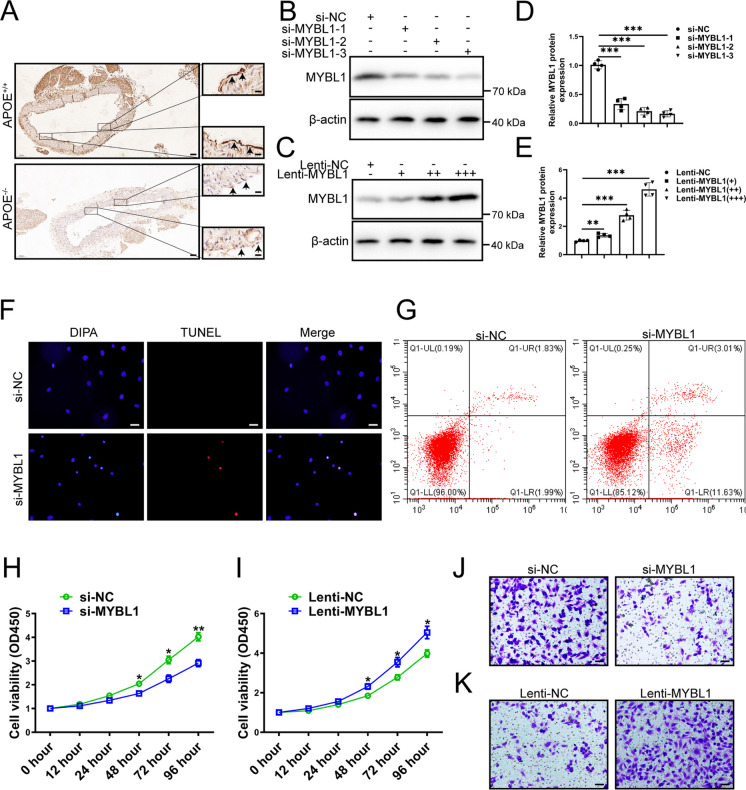
MYBL1 is a strong transcriptional activator involved in the cell signaling. However, there is no systematic study on the role of MYBL1 in atherosclerosis. The aim of this study is to elucidate the role and mechanism of MYBL1 in atherosclerosis. GSE28829, GSE43292 and GSE41571 were downloaded from NCBI for differentially expressed analysis. The expression levels of MYBL1 in atherosclerotic plaque tissue and normal vessels were detected by qRT-PCR, Western blot and Immunohistochemistry. Transwell and CCK-8 were used to detect the migration and proliferation of HUVECs after silencing MYBL1. RNA-seq, Western blot, qRT-PCR, Luciferase reporter system, Immunofluorescence, Flow cytometry, ChIP and CO-IP were used to study the role and mechanism of MYBL1 in atherosclerosis. The microarray data of GSE28829, GSE43292, and GSE41571 were analyzed and intersected, and then MYBL1 were verified. MYBL1 was down-regulated in atherosclerotic plaque tissue. After silencing of MYBL1, HUVECs were damaged, and their migration and proliferation abilities were weakened. Overexpression of MYBL1 significantly enhanced the migration and proliferation of HUVECs. MYBL1 knockdown induced abnormal autophagy in HUVEC cells, suggesting that MYBL1 was involved in the regulation of HUVECs through autophagy. Mechanistic studies showed that MYBL1 knockdown inhibited autophagosome and lysosomal fusion in HUVECs by inhibiting PLEKHM1, thereby exacerbating atherosclerosis. Furthermore, MYBL1 was found to repress lipid accumulation in HUVECs after oxLDL treatment. MYBL1 knockdown in HUVECs was involved in atherosclerosis by inhibiting PLEKHM1-induced autophagy, which provided a novel target of therapy for atherosclerosis.

Keywords: Atherosclerosis; Autophagy; MYB proto-oncogene-like 1; Pleckstrin Homology and RUN domain containing M1.


Conflict of interest statement

The authors declare no competing interests.

The authors declare that they have no competing interests.

Figures

Fig. 1
Fig. 1
The results of analysis to GSE28829 (A) Feature distribution profile of early atherosclerosis genomes and advanced atherosclerosis genomes (PERMANOVA p-value < 2.8e−13 (B-C) DESeq2, edgeR, and Limma R packages were used to analyze GSE28829 datasets. The Venn diagram of highly expressed genes and lowly expressed genes were shown. (D-F) The differentially expressed analysis results of GSE28829 by DESeq2, edgeR, and Limma R packages were shown by volcanic plot. |log FC (a fold change) |= 1.0 and P < 0. 05. (G) The results of differentially expressed genes were shown by heatmap. (H) GO enrichment analysis of differentially expressed genes
Fig. 2
Fig. 2
Different expression of MYBL1, ARHGAP30 and FAM20A was observed in GSE28829, GSE43292 and GSE41571 datasets (A) The intersection of differentially expressed genes of GSE28829, GSE43292 and GSE41571 datasets was selected. (B) Heat map of MYBL1, ARHGAP30 and FAM20A genes in early and late atherosclerotic tissues. (C-E) GEPIA analysis of the three genes MYBL1, ARHGAP30, and FAM20A was performed to obtain box plots of their expression. (F) Immumohistochemical staining was used to determine the protein expression of MYBL1 in advanced atherosclerotic plaques (AA) and normal atherosclerotic plaques (NA) (n = 8). Scale bars = 200 μm or 20 μm. (G)The protein expression of MYBL1 was detected by western blot in early atherosclerosis and advanced atherosclerosis (n = 8). (H) The quantitative analysis of MYBL1 protein expression in early atherosclerosis and advanced atherosclerosis were shown. *p < 0.05, **p < 0.01, ***p < 0.001, ****p < 0.0001
Fig. 3
Fig. 3
MYBL1 was involved in the development of atherosclerosis (A) Immunohistochemistry was performed on APOE+/+ and APOE.−/− to assess MYBL1 protein expression in atherosclerotic plaques (n = 7). Scale bars = 200 μm or 20 μm. (B) The effect of si-MYBL1-1, si-MYBL1-2, and si-MYBL1-3 were confirmed by western blot (n = 4). (C) The effect of Lenti-MYBL1 were confirmed by western blot (n = 4). (D-E) The quantitative analysis of MYBL1 protein expression were shown. (F) TUNEL assay of HUVECs showed that MYBL1 inhibition induced apoptosis (n = 5). Scale bars = 20 μm. (G) Flow cytometry was used to detect the apoptosis rate of HUVECs when MYBL1 was inhibited, and the results showed that the apoptosis rate of HUVECs was higher after MYBL1 inhibition (n = 5). (H-I) CCK-8 was used to detect the viability of HUVECs after transfection of si-MYBL1 or Lenti-MYBL1 (n = 3). (J-K) Transwell migration assay was used to detect HUVECs migration ability after transfection of si-MYBL1 or Lenti-MYBL1 (n = 5). Scale bars = 100 μm. *p < 0.05, **p < 0.01, ***p < 0.001
Fig. 4
Fig. 4
MYBL1 might regulate in the development of atherosclerosis by autophagy (A) Volcano map to differentially expressed genes of transcriptome sequencing after MYBL1 knockdown was shown (n = 5). (B) Heatmap to top 10 up-regulated and top 10 down-regulated genes of transcriptome sequencing after MYBL1 knockdown was shown. (C) GO enrichment analysis to up-regulated genes were shown. (D) GO enrichment analysis to down-regulated genes were shown. (E) KEGG enrichment analysis to differentially expressed genes were shown. (F) PLEKHM1, AMPK and GABARAP RNA expression in HUVECs transfected with Lenti-shMYBL1 or Lenti-shNC. *p < 0.05, **p < 0.01, ***p < 0.001
Fig. 5
Fig. 5
PLEKHM1 might act as a target of MYBL1 to regulate MYBL1 (A) Western blot detected the expressions of PLEKHM1, AMPK, GABARAP and β-actin when MYBL1 was overexpressed and the negative control (n = 4). (B) The quantitative analysis of PLEKHM1, AMPK and GABARAP protein expression were shown. (C) CHIP assay was used to detect the interaction between MYBL1 and the promoters of GAPDH, PLEKHM1, AMPK and GABARAP genes (n = 3). (D) PLEKHM1 corresponds to DNA binding site information map. (E) Luciferase reporter system was performed to examine the combination between PLEKHM1 and MYBL1 (n = 3). (F) Immunohistochemistry was performed on APOE+/+ and APOE.−/− to assess PLEKHM1 protein expression in atherosclerotic plaques (n = 8). Scale bars = 200 μm or 20 μm. (G) Immunofluorescence assay was used to detect whether MYBL1 entered the nucleus (n = 3). Scale bars = 200 μm or 20 μm. (H) Western blot was used to detect the apoptosis of cells with PLEKHM1, AMPK and GABARAP overexpression when MYBL1 was inhibited (n = 4). (I) The quantitative analysis of Cleaved-Caspase3, Bax and Bcl2 protein expression were shown. (J) Flow cytometry was used to detect the apoptosis rate of HUVECs (n = 5). *p < 0.05, **p < 0.01, ***p < 0.001
Fig. 6
Fig. 6
MYBL1 upregulated the function of HUVECs through PLEKHM1-induced autophagy (A) CO-IP was used to detect the binding of PLEKHM1 to hVps41, hVps11 and Rab7 (n = 3). (B) CO-IP was used to detect the binding of hVps41 to PLEKHM1, hVps11 and Rab7 (n = 3). (C) Western blot was used to detect the protein expression of PLEKHM1, p62, LC-3 and β-actin in HUVECs after treatments (n = 4). (D) The quantitative analysis of PLEKHM1, p62 and LC-3II were shown. (E) Track to autophagy performed by mCherry-GFP-LC3B was shown (n = 3). Scale bars = 10 μm. (F) The location and expression of LAMP1 and LC3B was determined by immunofluorescence (n = 3). Scale bars = 10 μm. (G) The migration of HUVECs was determined by Transwell assay after treatments (n = 5). *p < 0.05, **p < 0.01, ***p < 0.001
Fig. 7
Fig. 7
MYBL1 might regulated lipid accumulation by autophagy in HUVECs after oxLDL treatment (A) MYBL1 protein expression were determined by Western blot in HUVECs treated with oxLDL (0, 25, 50, 75, 100 and 125 μg/ml) (n = 6). (B) The quantitative analysis of MYBL1 protein expression were shown. (C-E) The total cholesterol, free cholesterol and cholesterol ester levels in HUVECs treated with oxLDL were determined by HPLC (n = 6). (F–H) The total cholesterol, free cholesterol and cholesterol ester levels in HUVECs were determined by HPLC. HUVECs were transfected with Lenti-NC or Lenti-MYBL1.Then HUVECs with vector or CQ. HUVECs were finally treated by oxLDL (100 μg/ml) (n = 6). *p < 0.05, **p < 0.01, ***p < 0.001
Fig. 8
Fig. 8
MYBL1/PLEKHM1 signal pathway reduced lipid accumulation in HUVECs (A-C) The total cholesterol, free cholesterol and cholesterol ester levels in HUVECs were determined by HPLC. HUVECs were transfected with Lenti-shNC or Lenti-shMYBL1.Then HUVECs with Lenti-shNC or Lenti-shMYBL1 were transfected with Lenti-NC or Lenti-PLEHKM1. HUVECs were finally treated by oxLDL (100 μg/ml) (n = 6). (D-F) The total cholesterol, free cholesterol and cholesterol ester levels in HUVECs were determined by HPLC. HUVECs were transfected with Lenti-NC or Lenti-MYBL1.Then HUVECs with Lenti-NC or Lenti-MYBL1 were transfected with Lenti-shNC or Lenti-shPLEHKM1. HUVECs were finally treated by oxLDL (100 μg/ml) (n = 6). (G) DiI-ox-LDL staining in HUVECs was evaluated. The DiI fluorescence intensity was quantified with Image Pro Plus. HUVECs were transfected with Lenti-shNC or Lenti-shMYBL1.Then HUVECs with Lenti-shNC or Lenti-shMYBL1 were transfected with Lenti-NC or Lenti-PLEHKM1. HUVECs were finally treated by oxLDL (100 μg/ml) (n = 6). (H) DiI-ox-LDL staining in HUVECs was evaluated. The DiI fluorescence intensity was quantified with Image Pro Plus. HUVECs were transfected with Lenti-NC or Lenti-MYBL1.Then HUVECs with Lenti-NC or Lenti-MYBL1 were transfected with Lenti-shNC or Lenti-shPLEHKM1. HUVECs were finally treated by oxLDL (100 μg/ml) (n = 5). Scale bars = 20 μm. *p < 0.05, **p < 0.01, ***p < 0.001
Fig. 9
Fig. 9
A schematic diagram for the underlying mechanism of the UPRmt in regulating IVDD. OxLDL attacked MYBL1 to induce apoptosis of endothelial cells in the atherosclerosis. PLEKHM1, as a downstream of MYBL1 in endothelial cells, promoted the fusion of autophagy and lysosomes in endothelial cells

References

    1. Alizadeh J, Kavoosi M, Singh N, Lorzadeh S, Ravandi A, Kidane B, et al. Regulation of autophagy via carbohydrate and lipid metabolism in cancer. Cancers. 2023;15(8). 10.3390/cancers15082195. - PMC - PubMed
    1. Ayari H, Bricca G. Identification of two genes potentially associated in iron-heme homeostasis in human carotid plaque using microarray analysis. J Biosci. 2013;38(2):311–5. 10.1007/s12038-013-9310-2. - PubMed
    1. Bungard D, Fuerth BJ, Zeng PY, Faubert B, Maas NL, Viollet B, et al. Signaling kinase AMPK activates stress-promoted transcription via histone H2B phosphorylation. Science (New York, NY). 2010;329(5996):1201–5. 10.1126/science.1191241. - PMC - PubMed
    1. Chiu TH, Ku CW, Ho TJ, Tsai KL, Yang YD, Ou HC, et al. Schisanhenol ameliorates oxLDL-caused endothelial dysfunction by inhibiting LOX-1 signaling. Environ Toxicol. 2023;38(7):1589–96. 10.1002/tox.23788. - PubMed
    1. Ding S, Ma N, Liu H, Tang M, Mei J. Sesn2 attenuates the damage of endothelial progenitor cells induced by angiotensin II through regulating the Keap1/Nrf2 signal pathway. Aging. 2020;12(24):25505–27. 10.18632/aging.104156. - PMC - PubMed

Publication types

MeSH terms

Substances