. 2024 May 26;22(1):502.
doi: 10.1186/s12967-024-05304-6.

A new integrative analysis of histopathology and single cell RNA-seq reveals the CCL5 mediated T and NK cell interaction with vascular cells in idiopathic pulmonary arterial hypertension

Affiliations

A new integrative analysis of histopathology and single cell RNA-seq reveals the CCL5 mediated T and NK cell interaction with vascular cells in idiopathic pulmonary arterial hypertension

Xincheng Li et al. J Transl Med. .

Abstract

Background: Inflammation and dysregulated immunity play vital roles in idiopathic pulmonary arterial hypertension (IPAH), while the mechanisms that initiate and promote these processes are unclear.

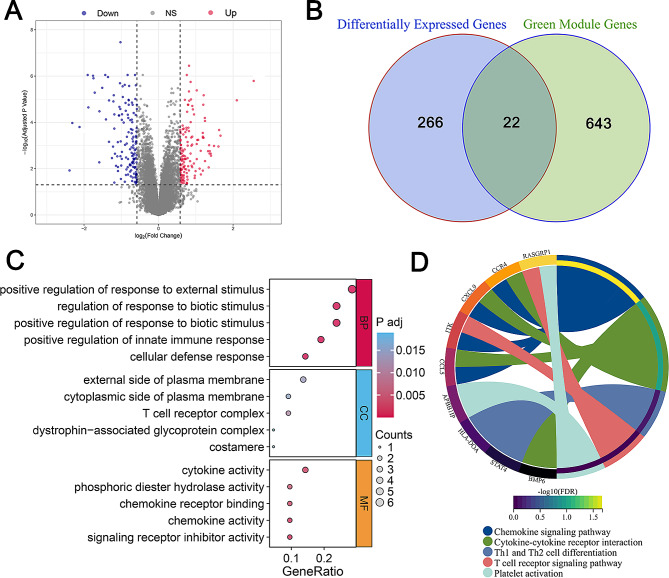
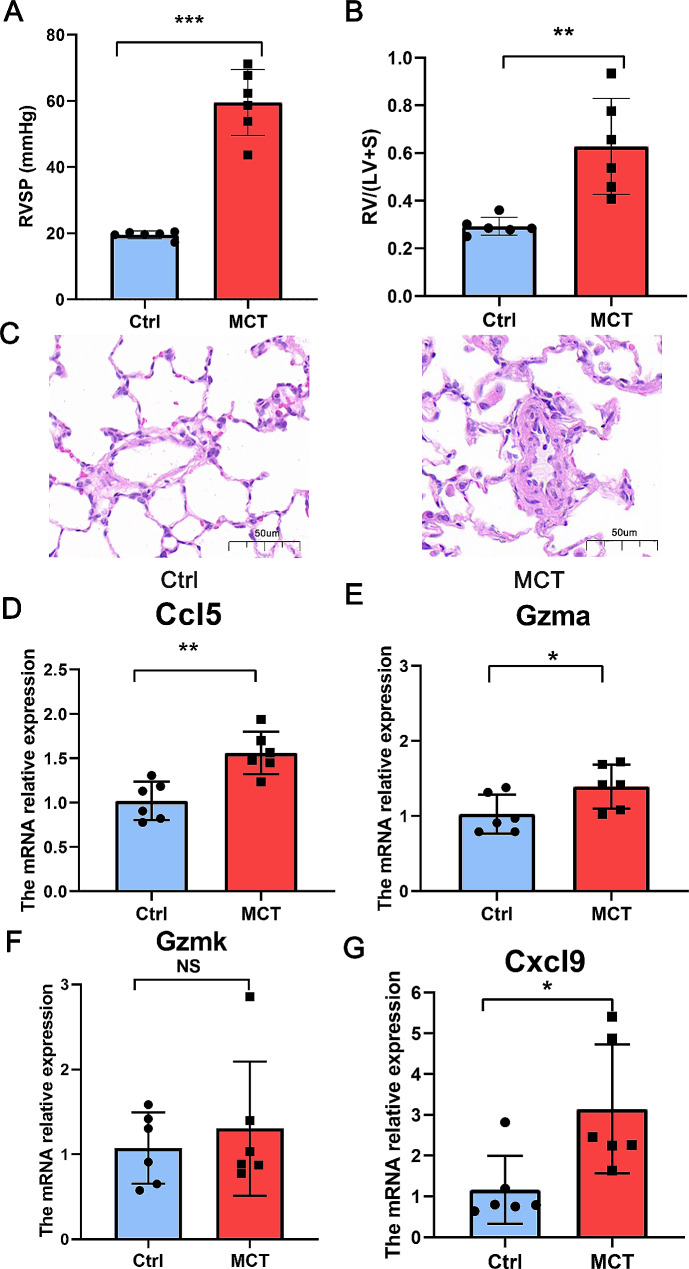
Methods: Transcriptomic data of lung tissues from IPAH patients and controls were obtained from the Gene Expression Omnibus database. Weighted gene co-expression network analysis (WGCNA), differential expression analysis, protein-protein interaction (PPI) and functional enrichment analysis were combined with a hemodynamically-related histopathological score to identify inflammation-associated hub genes in IPAH. The monocrotaline-induced rat model of pulmonary hypertension was utilized to confirm the expression pattern of these hub genes. Single-cell RNA-sequencing (scRNA-seq) data were used to identify the hub gene-expressing cell types and their intercellular interactions.

Results: Through an extensive bioinformatics analysis, CXCL9, CCL5, GZMA and GZMK were identified as hub genes that distinguished IPAH patients from controls. Among these genes, pulmonary expression levels of Cxcl9, Ccl5 and Gzma were elevated in monocrotaline-exposed rats. Further investigation revealed that only CCL5 and GZMA were highly expressed in T and NK cells, where CCL5 mediated T and NK cell interaction with endothelial cells, smooth muscle cells, and fibroblasts through multiple receptors.

Conclusions: Our study identified a new inflammatory pathway in IPAH, where T and NK cells drove heightened inflammation predominantly via the upregulation of CCL5, providing groundwork for the development of targeted therapeutics.

Keywords: Cell-cell interaction; IPAH; Inflammation; Single-cell RNA-sequencing.


Conflict of interest statement

The authors declare no competing financial interests.

Figures

Fig. 1
Fig. 1
Identification of inflammatory score-associated genes through weighted gene co-expression network analysis (WGCNA). A. Spearman correlation scatterplot showing the relationship between the inflammatory score and mean pulmonary artery pressure (mPAP), with a positive correlation indicated (R = 0.42, p = 0.03). B. Spearman correlation scatterplot of the inflammatory score against pulmonary vascular resistance (PVR), also depicting a positive correlation (R = 0.46, p = 0.02). C. Analysis of network topology for various soft-thresholding powers to ensure a scale-free network; the left panel illustrates the scale-free fit index (y-axis) as a function of the soft-thresholding power (x-axis), while the right panel displays the mean connectivity (degree of gene co-expression) as a function of the soft-thresholding power. D. Dendrogram generated from the hierarchical clustering of gene modules identified by WGCNA, with module colors below the dendrogram indicating gene clustering. Grey modules signify genes that could not be clustered into any of the modules. E. Heatmap displaying module-trait relationships, with color intensity reflecting the degree of correlation (red for positive, blue for negative). Each row represents a gene module designated by color, and each column represents a clinical trait. The green gene module had the highest correlation with the inflammation score, with a correlation coefficient of 0.69
Fig. 2
Fig. 2
Comprehensive gene expression and enrichment analysis of idiopathic pulmonary arterial hypertension (IPAH). A. Volcano plot displaying differentially expressed genes (DEGs) between IPAH and normal samples. DEGs were represented as dots, with upregulated genes in red, downregulated genes in blue, and non-significant genes in gray. B. Venn diagram showing the overlap between DEGs and genes from the green co-expression module associated with the inflammatory score, highlighting 22 genes common to both datasets. C. Gene Ontology (GO) enrichment analysis of the 22 intersecting genes, categorizing them into biological processes (BP), cellular components (CC), and molecular functions (MF), with the size of the dots indicating the gene count and color gradient representing the adjusted p-value. D. Kyoto Encyclopedia of Genes and Genomes (KEGG) pathway analysis for the intersecting genes, where each colored band represents a pathway linked to the genes listed, with the width of the bands correlating to the -log10 of the false discovery rate (FDR) adjusted p-values, indicating the significance of the gene-pathway association
Fig. 3
Fig. 3
Characterization and diagnostic potential of inflammation-associated hub genes in idiopathic pulmonary arterial hypertension (IPAH). A. Protein-protein interaction network illustrating the interconnectivity between 22 inflammation-related genes, with lines indicating the interactions. B. UpSet plot depicting the intersection of hub genes identified by six distinct algorithms, with bar height representing the intersection size and connected dots indicating the combination of algorithms identifying the hub genes. C. Violin plots comparing the expression levels of the four hub genes (CCL5, GZMA, GZMK, CXCL9) between IPAH and the control group, with statistical significance denoted by asterisks. ***p < 0.001. D. Receiver operating characteristic (ROC) curves for the four hub genes, with the area under the curve (AUC) scores demonstrating their diagnostic performance in distinguishing between IPAH and control samples
Fig. 4
Fig. 4
Expression of hub genes in the monocrotaline-induced rat model of pulmonary hypertension. A. Bar graph showing the right ventricular systolic pressure (RVSP), indicating a significant increase in the monocrotaline (MCT) group compared to controls (Ctrl) (***p < 0.001). B. Bar graph depicting the heart weight ratio (RV/(LV + S), right ventricle to the left ventricle plus septum), with the MCT group showing a significant increase (**p < 0.01). C. Hematoxylin and eosin (H&E) stained sections of the rat lung, revealing morphological changes of the pulmonary vasculature; scale bars represent 50 μm. D-G. Relative mRNA expression levels measured by RT-qPCR for the genes Gzma (D), Gzmk (E), Ccl5 (F), and Cxcl9 (G) between Ctrl and MCT groups, with statistical significance noted as *p < 0.05, **p < 0.01, NS: not significant
Fig. 5
Fig. 5
Single-cell RNA sequencing (scRNA-seq) analysis of cell-type-specific gene expression and intercellular interactions in idiopathic pulmonary arterial hypertension (IPAH). A. Uniform manifold approximation and projection (UMAP) visualization illustrating the diverse cell populations identified in normal and IPAH lung samples, with each cluster representing a unique cell type. B. Violin plots depicting the expression profiles of selected marker genes across the identified cell types, with each violin representing the distribution within a particular cell type C. UMAP plots showing the expression intensity of CCL5 and GZMA across all annotated cell types, with color intensity indicating expression levels. D. Violin plots contrasting the expression of CCL5 in T cells and natural killer (NK) cells between IPAH and normal samples, with significant differences highlighted (***p < 0.001). E. Ligand-receptor interaction circle plot detailing the potential communication pathways mediated by CCL5 among T cells, NK cells, vascular endothelial cells (VECs), smooth muscle cells (SMCs), and fibroblasts, suggesting a complex network of intercellular signaling in the IPAH lung tissue microenvironment. Statistical annotations: ***p < 0.001

References

    1. Humbert M, Kovacs G, Hoeper MM, Badagliacca R, Berger RMF, Brida M, Carlsen J, Coats AJS, Escribano-Subias P, Ferrari P, Ferreira DS, Ghofrani HA, Giannakoulas G, Kiely DG, Mayer E, Meszaros G, Nagavci B, Olsson KM, Pepke-Zaba J, Quint JK, Rådegran G, Simonneau G, Sitbon O, Tonia T, Toshner M, Vachiery JL, Vonk Noordegraaf A, Delcroix M, Rosenkranz S, ESC/ERS Scientific Document Group 2022 ESC/ERS guidelines for the diagnosis and treatment of pulmonary hypertension. Eur Heart J. 2022;43(38):3618–731. doi: 10.1093/eurheartj/ehac237. - DOI - PubMed
    1. Stacher E, Graham BB, Hunt JM, Gandjeva A, Groshong SD, McLaughlin VV, Jessup M, Grizzle WE, Aldred MA, Cool CD, Tuder RM. Modern age pathology of pulmonary arterial hypertension. Am J Respir Crit Care Med. 2012;186(3):261–72. doi: 10.1164/rccm.201201-0164OC. - DOI - PMC - PubMed
    1. Thenappan T, Ormiston ML, Ryan JJ, Archer SL. Pulmonary arterial hypertension: pathogenesis and clinical management. BMJ. 2018;360:j5492. doi: 10.1136/bmj.j5492. - DOI - PMC - PubMed
    1. Farber HW, Miller DP, Poms AD, Badesch DB, Frost AE, Muros-Le Rouzic E, Romero AJ, Benton WW, Elliott CG, McGoon MD, Benza RL. Five-year outcomes of patients enrolled in the REVEAL Registry. Chest. 2015;148(4):1043–54. doi: 10.1378/chest.15-0300. - DOI - PubMed
    1. Chang KY, Duval S, Badesch DB, Bull TM, Chakinala MM, De Marco T, Frantz RP, Hemnes A, Mathai SC, Rosenzweig EB, Ryan JJ, Thenappan T. PHAR investigators *. Mortality in pulmonary arterial hypertension in the modern era: early insights from the Pulmonary Hypertension Association Registry. J Am Heart Assoc. 2022;11(9):e024969. doi: 10.1161/JAHA.121.024969. - DOI - PMC - PubMed

Publication types

MeSH terms