[Preprint]. 2024 May 17:2024.05.15.593193.
doi: 10.1101/2024.05.15.593193.

A single-cell atlas characterizes dysregulation of the bone marrow immune microenvironment associated with outcomes in multiple myeloma

William C Pilcher  1 Lijun Yao  2 Edgar Gonzalez-Kozlova  3 Yered Pita-Juarez  4   5   6 Dimitra Karagkouni  4   5   6 Chaitanya R Acharya  7 Marina E Michaud  8 Mark Hamilton  7 Shivani Nanda  4   5   6 Yizhe Song  2 Kazuhito Sato  2 Julia T Wang  2 Sarthak Satpathy  9 Yuling Ma  4   5   6 Jessica Schulman  7 Darwin D'Souza  3 Reyka G Jayasinghe  2 Giulia Cheloni  4   5 Mojtaba Bakhtiari  8 Nick Pabustan  7 Kai Nie  3 Jennifer A Foltz  2 Isabella Saldarriaga  4 Rania Alaaeldin  8 Eva Lepisto  7 Rachel Chen  3 Mark A Fiala  10 Beena E Thomas  8 April Cook  7 Junia Vieira Dos Santos  11 I-Ling Chiang  2 Igor Figueiredo  3 Julie Fortier  10 Michael Slade  10 Stephen T Oh  12   13   14 Michael P Rettig  15 Emilie Anderson  16 Ying Li  16 Surendra Dasari  16 Michael A Strausbauch  16 Vernadette A Simon  16 Immune Atlas ConsortiumAdeeb H Rahman  3 Zhihong Chen  3 Alessandro Lagana  11 John F DiPersio  2 Jacalyn Rosenblatt  4   5   17 Seunghee Kim-Schulze  3 Madhav V Dhodapkar  18   19 Sagar Lonial  8   20 Shaji Kumar  16 Swati S Bhasin  8 Taxiarchis Kourelis  16 Ravi Vij  10   21 David Avigan  4   5   17 Hearn J Cho  7 George Mulligan  7 Li Ding  2   21 Sacha Gnjatic  3 Ioannis S Vlachos  4   5   6   22   23 Manoj Bhasin  8   9   1   24
Affiliations

A single-cell atlas characterizes dysregulation of the bone marrow immune microenvironment associated with outcomes in multiple myeloma

William C Pilcher et al. bioRxiv. .

Abstract

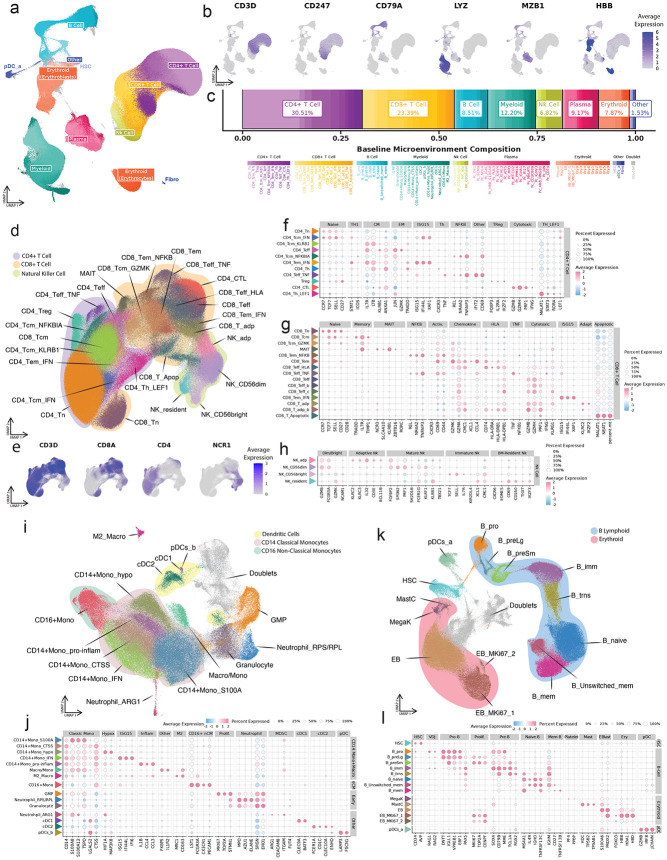
Multiple Myeloma (MM) remains incurable despite advances in treatment options. Although tumor subtypes and specific DNA abnormalities are linked to worse prognosis, the impact of immune dysfunction on disease emergence and/or treatment sensitivity remains unclear. We established a harmonized consortium to generate an Immune Atlas of MM aimed at informing disease etiology, risk stratification, and potential therapeutic strategies. We generated a transcriptome profile of 1,149,344 single cells from the bone marrow of 263 newly diagnosed patients enrolled in the CoMMpass study and characterized immune and hematopoietic cell populations. Associating cell abundances and gene expression with disease progression revealed the presence of a proinflammatory immune senescence-associated secretory phenotype in rapidly progressing patients. Furthermore, signaling analyses suggested active intercellular communication involving APRIL-BCMA, potentially promoting tumor growth and survival. Finally, we demonstrate that integrating immune cell levels with genetic information can significantly improve patient stratification.

Keywords: Bone Marrow Microenvironment; Inflammation; Multiple Myeloma; Senescence; Single-Cell; Transcriptome.


Figures

Figure 1.
Figure 1.. Overview of the immune atlas design, workflow, and patient characteristics.
(a) Overview of the immune atlas study design, patient cohort, sample processing, and analysis workflow. (b) Clinical characteristics of patients (n = 263) in this study. The Forest plot illustrates the effect of various clinical features on progression-free survival (PFS). (c) Dot plot depicting the cross-section of samples based on autologous stem cell transplant (ASCT) and frontline treatment, where dot size indicates the number of patients and dot color indicates the type of treatment regimen. (d) Bar chart showing the total number of patients with each of the six genetic events used for risk classification. (e) Upset plot showing the intersection of patients categorized as standard-risk (SR) or high-risk (HR) and non-progressor (NP) or rapid progressor (RP) at baseline. (f) Kaplan-Meier curves display survival analysis for patients categorized based on risk stratification (HR vs SR), transplant as a frontline treatment, treatment type, and ISS staging.
Figure 2.
Figure 2.. Single-cell immune atlas of multiple myeloma patient samples.
(a) Uniform manifold approximation and projection (UMAP) embedding of 1,149,344 CD138neg BMME cells collected from MM patients. A total of 106 clusters were observed, spanning five major compartments defined by canonical markers: T and NK cells, B cells and erythroblasts, myeloid cells, erythrocytes, and plasma cells. Populations identified as doublets are colored grey. (b) Feature plots displaying the normalized gene expression for a selection of lineage-specific markers. (c) A stacked bar chart, displaying the average per-patient cell type composition at baseline. Clusters are colored by their lineage and shaded by subtype. Doublet populations are omitted. (d) UMAP of the T Lymphocyte and Natural Killer compartment. Cells are colored by lineage (CD4 T cells: purple; CD8 T cells: orange; NK cells: yellow) and shaded by individual subtypes. The color legend is included in the corresponding dot plots (f-h). (e) Feature plots displaying the normalized gene expression per cell for markers to distinguish, CD4+, CD8+, and NK cells. (f-h) Dot plots displaying the average scaled expression of select marker genes used for precise cluster annotation. Expression is visualized on a red-blue color scale, with the size of each dot corresponding to the percent expression. Dot plots are split by lineage into (f) NK cells, (g) CD8+ T cells, and (h) CD4+ T cells. The colored triangle next to the cluster name matches the cluster color in the corresponding UMAP (d). (i) UMAP of the myeloid compartment. Cells are shaded by their subtype. Doublet populations are colored grey. (j) Dot plot displaying the average scaled expression of select marker genes for precise cluster annotation in the myeloid compartment. Expression is visualized on a red-blue color scale, with the size of each dot corresponding to the percent expression. The triangle next to the cluster name matches the cluster color in the corresponding UMAP. (k) UMAP of the B cell and erythroblast compartment. Cells are colored by their lineage (B cells: cyan; Erythrocytes: red; Other: dark blue), shaded by subtype. Doublet populations are colored grey (l) Dot plot displaying the average scaled expression of select marker genes used for precise cluster annotation in the B cell and erythroblast compartment. Expression is visualized on a red-blue color scale, with the size of each dot corresponding to the percent expression. See Supplemental Document 1 for a detailed description of the annotation of all individual clusters. The colored triangle next to the cluster name matches the clusters in the corresponding UMAP (k).
Figure 3.
Figure 3.. Alterations in the MM bone barrow microenvironment based on cytogenetic risk profile.
(a) UpSet plot of the genetic lesions comprising the definition of the high-risk group. (b) Boxplots of the CD8+ T cell mean abundance estimates across batches for the high (n = 123) and standard (n = 108) risk groups at baseline from the Dirichlet regression model adjusting for batch. Significantly different proportions between high- and standard-risk patients are denoted with a red asterisk (* p-value < 0.05). (c) Pseudotime trajectory of the CD8 T cells, coupled with the mean cell composition fold change differences (log2 scale) between high- and standard-risk patients at baseline, presented in a blue-to-orange color scale. The size of the nodes corresponds to the number of cells per cluster. (d) (Left) Survival curve from regressing the overall survival on the CD8 Teff HLA+ cell abundances. The cell abundances were corrected for batch by taking the Pearson residuals from a Dirichlet regression model with batch as the covariate. The cut-off was determined using maximally selected rank statistics and set at the 77% quantile (177 low, 53 high). (Right) Violin plots of the Ucell signature enrichment of CD8 Teff HLA+ cells based on the expression of dysfunctional genes (CD57, ZEB2, KLRG1, KLRK1, TIGIT, LAG3, PDCD1, CTLA4, TIM-3) between the high- and standard-risk patients at baseline. The p-value denoting the significantly different enrichment is displayed (Wilcoxon rank sum test, two-sided). (e) Boxplots of the monocyte cell mean abundance estimates across batches for the high (n = 123) and standard (n = 108) risk groups at baseline from the Dirichlet regression model adjusting for batch. Significantly different proportions between high- and standard-risk patients are denoted with a red asterisk (* p-value < 0.05). (f) Survival curve from regressing the overall survival on the CD14+ IFN+ monocytes cell abundances. The cell abundances were corrected for batch by taking the Pearson residuals from a Dirichlet regression model with batch as the covariate. The cut-off was determined using maximally selected rank statistics and set at the 69% quantile (159 low, 71 high). (g) (Left) Heatmap displaying the average expression of HLA-II and IFN-related significantly differentially expressed genes in the CD14+ IFN+ monocytes between the high and standard-risk groups at baseline. (Right) Violin plots of the Ucell signature enrichment of CD14+ IFN+ monocytes based on the expression of the 23 IFN and HLA-II induced downregulated genes presented in the heatmap between the high- and standard-risk patients at baseline. The p-value denoting the significantly different enrichment is displayed (Wilcoxon rank sum test, two-sided).
Figure 4.
Figure 4.. Single-cell level alterations in the bone marrow microenvironment of rapidly progressing MM patients.
(a) Stacked bar chart displaying the mean per-patient cell type proportions at baseline across the full dataset, split between RP and NP patients. Clusters are colored by their major cell type and shaded by individual clusters. The average proportion of major cell types has been shown on the graph. (b) Box plots displaying the distribution of per-patient proportions for T cells, B cells, and myeloid cells as a percentage of non-malignant cells, split by progression categories. Doublet populations are excluded. Open circles represent individual patients. The significance of the difference in proportions between Rapid and Non-progressors has been calculated using the Wilcoxon rank sum test. The non-significant p-values >0.05 are not shown. (c) Trajectory of the CD14+ monocyte population along with differential abundance results. Lines represent transitions along the trajectories, with circles representing each cluster, and branches representing different lineages. Cluster labels along with fold change (log2) in cluster proportion between NP and RP samples have been shown along the trajectory. Labels are also shaded by fold change (log2) and clusters with significant differences in proportion were marked using an asterisk (* P < 0.05; ** P < 0.01; Wilcoxon rank sum test). (d) A volcano plot displaying the differentially expressed genes between NP and RP patients across the CD14+ monocyte compartment. The x-axis displays the log 2-fold change and the y-axis −log10 of the BH-adjusted p-value. The significantly differentially expressed genes associated with inflammation and ISG15 antiviral pathways are shown with red and blue colors respectively. (e) A bar plot displaying gene set enrichment analysis results for the differentially expressed genes shown in (d). The x-axis displays the normalized enrichment score for each pathway, where positive values indicate the pathway associated with the NP-enriched markers, and negative values indicate the pathway associated with the RP-enriched markers. Pathways are shaded by −log10FDR and. The pathways with BH-adjusted p values < 0.1 were considered significant and shown in the plot. (f) Box plots displaying the distribution of per-patient proportions of selected significantly enriched CD3+ T Cell populations. Doublet populations are excluded. Open circles represent individual patients. The significance of the difference in proportions between Rapid and Non-progressors has been calculated using the Wilcoxon rank sum test. The non-significant p-values >0.05 are not shown. (g) A volcano plot displaying the differentially expressed genes between NP and RP patients across all CD3+ T cells. The x-axis displays the log 2-fold change and the y-axis −log10 of the BH-adjusted p-value. Select genes are highlighted and colored based on their associated function. (h) A bar plot displaying gene set enrichment analysis results for the differentially expressed genes shown in (g). The x-axis displays the normalized enrichment score for each pathway, where positive and negative values indicate the pathways associated with the NP-enriched and RP markers respectively. The pathways are shaded by signed FDR. The pathways with BH-adjusted p values < 0.1 were considered significant and shown in the plot. (I) Trajectory analysis of CD8+ T cells. Cells are colored by clusters with trajectories connecting clusters drawn in black, with the trajectory strongly associated with cytotoxic populations highlighted in red. The cluster set as the origin for the resulting trajectory is highlighted in cyan color. (j) A density plot showing the distribution of cells concerning their pseudotime along the cytotoxicity lineage. Low pseudotime corresponds to cells closer to the origin cluster (CD8_Tn), while later pseudotime corresponds to differentiated cytotoxic clusters. (k) The smoothed normalized gene expression along the cytotoxicity lineage’s pseudotime for five Naïve associated genes (blue) and five Cytotoxicity associated genes (red). Gene expression for individual cells is weighted by slingshot’s lineage assignment weight. (l-n) Survival plot displaying the relationship between progression-free survival and the patient’s average cytotoxicity signature (l), naïve signature (m), or exhaustion signature (n) scores across all CD3+ T Cells. The red curve corresponds to patients with a signature score greater than the median, while the blue curve corresponds to patients with a signature score less than the median patient. The p-value for the CoxPH model fitted on the continuous signature score, correcting for processing site and batch, is displayed in the bottom left corner of each panel.
Figure 5.
Figure 5.. Pathway and systems biology analysis to decipher mechanisms of poor outcomes in MM.
(a) (Top) Comparison of differential abundance results by cytogenetic risk (HR_v_SR), progression (RP_v_NP), and progression within standard-risk patients (RP.SR_v_NP.SR). Each box represents the estimated log2-fold change between different risk and progression based comparisons (HR v SR, RP v NP, RP.SR v NP.SR) after adjusting for batch using a Dirichlet model. Rows represent different comparisons; columns represent different cell populations. Orange shades indicate RP, HR, or RP.SR upregulated cell populations, while blue shades indicate SR, NP, or NP.SR upregulated populations. (Bottom) Average normalized signature scores for select immune signatures (Supplemental Table 4) across the various cell populations. (b) Bar graph displaying differentially enriched markers between Non and Rapid progressors within the CD34+ HSC population. Bars represent the log2-fold change, with positive indicating the gene is enriched in non-progressors, while negative blue bars indicate enrichment in Rapid progressors. (c) Heatmap of intercellular communication depicting key patterns of outgoing (top) and incoming (bottom) signaling communication between cell types. Each row of the heatmap represents a ligand-receptor pair, where the relative strength of the outgoing signal (ligand expression) by each cell type is shown on the top heatmap, and the relative strength of the corresponding incoming signal (receptor expression) by each cell type is shown on the bottom heatmap. Key signaling pairs between T cell and myeloid populations are depicted, including cytokine and IFN-g signaling, in addition to BAFF and APRIL signaling patterns implicated in MM. (d) Chord diagram indicating the IFN-g signaling network in our dataset. Chords are colored by the ‘sender’ cell type (population expressing the ligand) and point towards the ‘receiver’ cell type (population expressing the receptor), illustrating strong outgoing IFN-g signaling from T and NK cell populations, corresponding to increased incoming IFN-g signaling to myeloid and fibroblast populations. (e-h) Comparing the average expression of IFN-g across T cells (e-f) and IFN-gR2 across CD14+ Monocytes (g-h) and their associations with outcome across standard-risk patients. Box and violin plots comparing the per-patient average expression of IFN-g in T cells (e) or IFN-gR2 in CD14+ Monocytes (g) across standard-risk NP and standard-risk RP patients. Each dot represents individual patient. (f,h) Kaplan Meier curves displaying the association between expression of IFN-g in T cells (f) or expression of IFN-gR2 in CD14+ Monocytes and progression-free survival within standard-risk patients. “High” group corresponds to patients with an expression of IFN-g above the median, while “Low” corresponds to patients below the median. The hazard ratio and P value of a Cox regression model fitted to the IFN-g expression are also calculated for each analysis. (i) Heatmap displaying the normalized average AUC score for various transcriptional regulons on selected myeloid populations. Additional columns include the hazard ratio, along with the p-value, estimated from a Cox proportionality hazard model fit on average patient AUC scores (categorized into high and low activity). (j) Survival plots display the corresponding survival associations with the expression of the corresponding ligand within the myeloid compartment of patients, where high E2F8 regulon expression (bottom) and low IRF7 (top) regulon expression are associated with poor outcomes. (k) Feature plots showing the per cell AUC values for the IRF7 (left) and E2F8 (right) transcription factor regulons derived from SCENIC analysis across key myeloid populations. Blue color indicates low activity (or AUC), while red color indicates high activity.
Figure 6.
Figure 6.. Prediction of MM progression by integration of cytogenetics risk along with immune signatures
(a) Shows a diagram with the type of variables that were tested (immune signatures, cytogenetics, and clinical variables (covariates)) followed by the three regression strategies used (elastic net, logistic regression, and Cox). Finally, bootstrap validation was used for model selection (b) Receiver operating characteristic (ROC) curves for progression prediction models based on single clusters, clinical variables, and cytogenetics or immune atlas variables alone and in combination are shown colored based on the specific group of models. The labels indicate SubC = SubClusters, CoV = Covariates and these include age, Batch, Site, ISS and Cytogenetic. Kaplan-Meier curves showing the separation of patients with high or low scores for prediction of PFS are shown for (c) Age, ISS stage, and batch (d) cytogenetics, age, ISS stage, and batch, (e) Immune Atlas Signatures, Age, ISS stage, and batch. Kaplan-Meier curves show the separation of patients when cytogenetic risk scores are combined with the (f) best 11 predictive immune atlas subclusters or (g) with all 83 subclusters (h) importance of immune subclusters for predicting the progression. The clusters with better and poor MM outcomes are shown with blue and red colors respectively.
Figure 7:
Figure 7:. Inflammatory remodeling defines the BMME in rapidly progressing MM.
Summary of the key cellular subtypes and signaling pathways comprising the MM BMME and their association with patient outcomes. Within the aging bone marrow, a state of chronic inflammation, known as ‘inflammaging’, results in altered lymphoid and myeloid cell populations, enabling immune escape of malignant plasma cells. Within the T cell compartment, MM patients with poor outcomes exhibit a shift toward immunosenescent and late-activated CD8+ T cells, producing IFN-II that drives senescence-associated and immunosuppressive phenotypes in myeloid compartment. In contrast, MM patients with better outcomes display highly proliferative naïve and central memory CD8+ T cell subsets, in addition to enriched T helper populations driven by increased MHC-II antigen presentation among myeloid cells. T cell and myeloid populations in these patients appear to be stimulated by type I interferons, in contrast to patients with poor outcomes exhibiting enrichment of IFN-II signaling. This difference in interferon stimulation appears to be linked to patient outcomes, in part, through the differential expression of BAFF by IFN-I-stimulated monocytes and APRIL by IFN-II-stimulated monocytes. Notably, BAFF preferentially binds to mature B cells to promote survival, potentially enhancing B cell-mediated immunity and leading to improved outcomes. Conversely, APRIL has been shown to inhibit memory B cell function and promote malignant plasma cell survival. This dysregulation is further highlighted in the shift from B cell development towards increased myelopoiesis in patients with poor outcomes. Created with Biorender.

References

    1. Padala S. A. et al. Epidemiology, staging, and management of multiple myeloma. Med. Sci. (Basel) 9, 3 (2021). - PMC - PubMed
    1. Mikhael J., Bhutani M. & Cole C. E. Multiple myeloma for the primary care provider: A practical review to promote earlier diagnosis among diverse populations. Am. J. Med. 136, 33–41 (2023). - PubMed
    1. Cancer Stat Facts: Myeloma. National Cancer Institute Surveillance, Epidemiology, and End Results Program https://seer.cancer.gov/statfacts/html/mulmy.html.
    1. Holstein S. A. & McCarthy P. L. Immunomodulatory drugs in multiple myeloma: Mechanisms of action and clinical experience. Drugs 77, 505–520 (2017). - PMC - PubMed
    1. Avet-Loiseau H. et al. Genetic abnormalities and survival in multiple myeloma: the experience of the Intergroupe Francophone du Myélome. Blood 109, 3489–3495 (2007). - PubMed

Publication types