[Preprint]. 2024 May 14:2023.09.06.556431.
doi: 10.1101/2023.09.06.556431.

Rapid, biochemical tagging of cellular activity history in vivo

Affiliations

Rapid, biochemical tagging of cellular activity history in vivo

Run Zhang et al. bioRxiv. .

Update in

Abstract

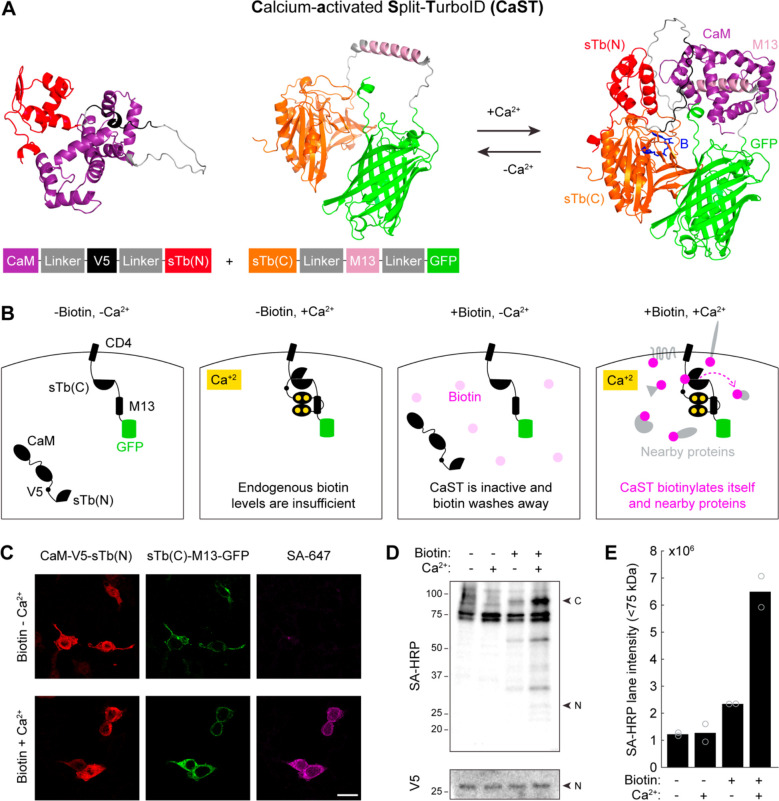
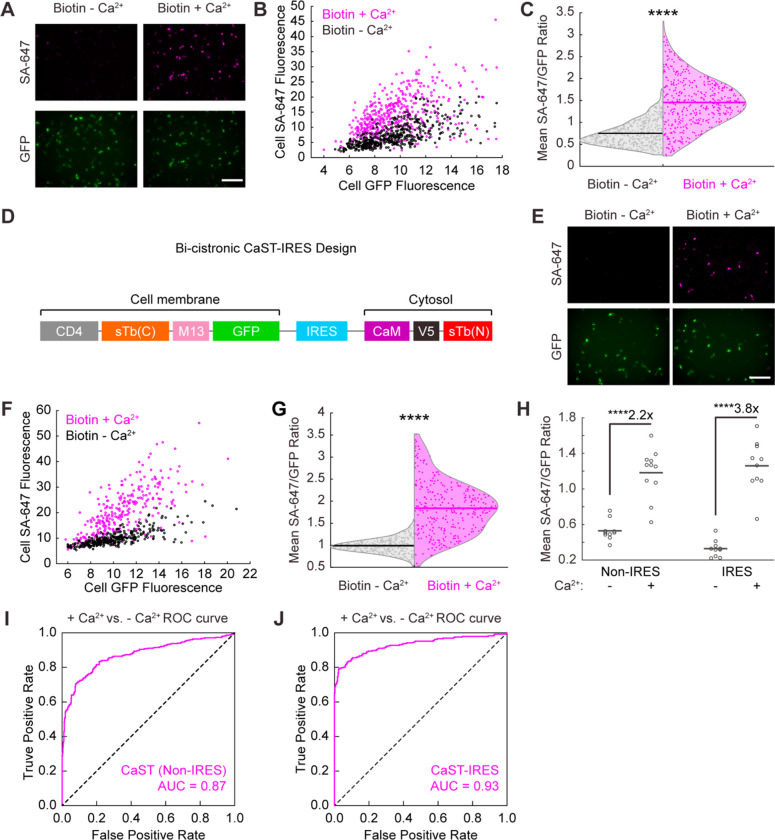
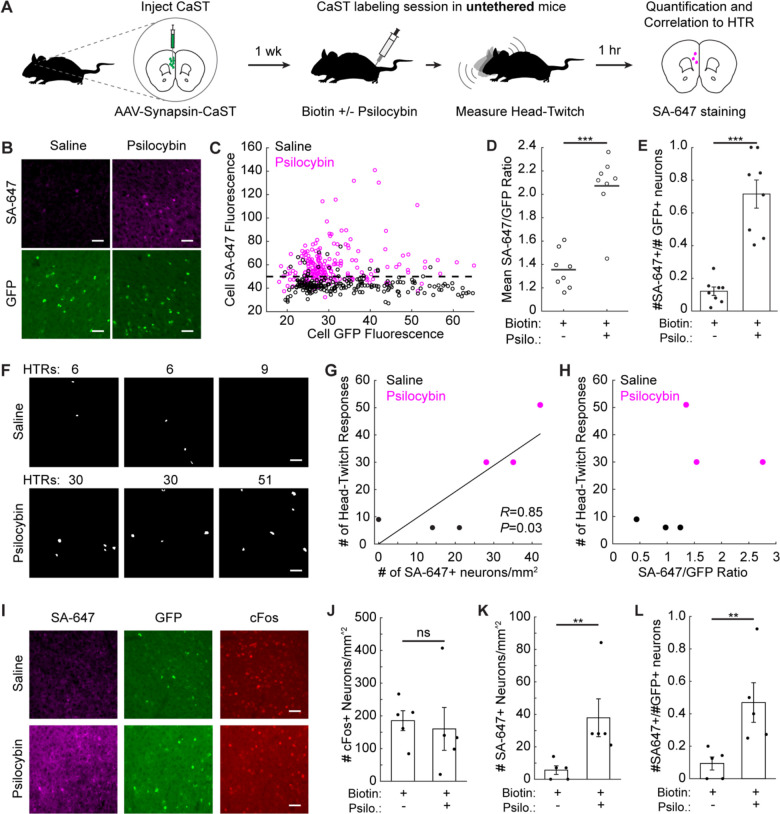
Intracellular calcium (Ca2+) is ubiquitous to cell signaling across all biology. While existing fluorescent sensors and reporters can detect activated cells with elevated Ca2+ levels, these approaches require implants to deliver light to deep tissue, precluding their noninvasive use in freely-behaving animals. Here we engineered an enzyme-catalyzed approach that rapidly and biochemically tags cells with elevated Ca2+ in vivo. Ca2+-activated Split-TurboID (CaST) labels activated cells within 10 minutes with an exogenously-delivered biotin molecule. The enzymatic signal increases with Ca2+ concentration and biotin labeling time, demonstrating that CaST is a time-gated integrator of total Ca2+ activity. Furthermore, the CaST read-out can be performed immediately after activity labeling, in contrast to transcriptional reporters that require hours to produce signal. These capabilities allowed us to apply CaST to tag prefrontal cortex neurons activated by psilocybin, and to correlate the CaST signal with psilocybin-induced head-twitch responses in untethered mice.


Conflict of interest statement

COMPETING INTERESTS STATEMENT D.E.O. is a co-founder of Delix Therapeutics, Inc. and serves as the chief innovation officer and head of the scientific advisory board. All other authors declare no other competing interests.

Figures

Figure 1.
Figure 1.. Design of a Ca2+-activated Split-TurboID (CaST).
A) AlphaFold2, prediction of the protein structures for the two halves of CaST either in isolation (left; as expected in the absence of Ca2+), or in complex (right; as expected in the presence of high Ca2+). The two CaST components reversibly reconstitute in a Ca2+-dependent manner. The predicted biotin binding site is shown in blue. B) Schematic of CaST design for expression in HEK cells. The component with sTb(C)-M13-GFP is tethered to the membrane via the transmembrane domain of a cell membrane protein CD4, while the CaM-V5 epitope tag-sTb(N) component is expressed throughout the cytosol. CaST only tags proteins when cells are treated with biotin and exhibit elevated intracellular Ca2+. C) Example confocal images of HEK cells transfected with both components of CaST and treated with biotin ± Ca2+ for 30 minutes, as described in panel C. Cells were washed, fixed, and stained with anti-V5 and streptavidin-AlexaFluor647 (SA-647). The anti-V5 signal stains the CaM-sTb(N) component (left), while the GFP fluorescence shows the CD4-sTb(C)-M13 component (middle). Cells treated with high Ca2+ exhibit robust biotinylation of proteins, detected by SA-647 staining (right). Scale bar, 20 μm. D) HEK cells were transfected with CaST and treated with ± 50 μM biotin and ± Ca2+ (5 mM CaCl2 and 1 μM ionomycin) for 30 minutes. Cells were then washed with DPBS, and whole-cell lysates were collected and analyzed using a Western blot stained with streptavidin-Horse Radish Peroxidase (SA-HRP) or anti-V5/HRP. “N” indicates the expected size of the CaM-V5-sTb(N) fragment, while “C” indicates the expected size of the CD4-sTb(C)-M13-GFP fragment. E) Quantification of biotinylated proteins present in Western blot lanes of the experiment shown in panel C. Two independent biological replicates were quantified. The entire lane below the 75kDa endogenously biotinylated bands were included in the quantification (sum of the total raw intensity pixel values). A line plot profile spanning the entire blot is shown in Extended Data Figure 2.
Figure 2.
Figure 2.. Quantification of CaST’s performance.
A) Example images of HEK cells transfected with CaST and treated with 50 μM biotin ± Ca2+ (5 mM CaCl2 and 1 μM ionomycin) for 30 minutes. Top row: SA-647 staining of biotinylated proteins. Bottom row: CD4-sTb(C)-M13-GFP. B) Scatter plot of the mean SA-647 versus mean GFP fluorescence calculated for every GFP+ cell detected across 11 FOVs treated with either biotin + Ca2+ (n = 451 cells; Two-tailed Pearson’s R = 0.50, P = 6.2e-30) or biotin − Ca2+ (n = 473 cells; Two-tailed Pearson’s R = 0.69, P = 2.6e-67). C) Violin plots showing the distributions of the mean SA-647/GFP fluorescence ratio per cell from data in panel B (P = 2.0e-85, U = 27234, two-tailed Mann-Whitney U test). D) Schematic of the bi-cistronic CaST-IRES construct design. E) Example images of HEK cells transfected with CaST-IRES and treated with biotin ± Ca2+ for 30 minutes, as in panel A. F) Scatter plot of the mean SA-647 versus mean GFP fluorescence calculated for each GFP+ cell detected across 10 FOVs treated with either biotin + Ca2+ (n = 293 cells; Two-tailed Pearson’s R = 0.72, P = 1.5e-47) or biotin − Ca2+ (n = 332 cells; Two-tailed Pearson’s R = 0.78, P = 3.7e-69). G) Violin plots showing the distributions of the mean SA-647/GFP fluorescence ratio per cell from data in panel F (P = 3.1e-77, U = 6732, two-tailed Mann-Whitney U test). H) The FOV averages of the SA-647/GFP fluorescence ratio per cell from the non-IRES data shown in panel B (n = 11 FOVs per condition; P = 1.1e-5, U = 2, two-tailed Mann-Whitney U test), and the IRES data shown in panel F (n = 10 FOVs per condition; P = 1.1e-5, U = 0, two-tailed Mann-Whitney U test). I,J) ROC curves for distinguishing Ca2+-treated vs. non-treated cell populations based on CaST Non-IRES cells from Panel C (I; AUC = 0.87, P = 2.0e-85, Wilson/Brown’s method) and CaST-IRES transfected cells from Panel G (J; AUC = 0.93, P = 3.1e-77, Wilson/Brown’s method). All scale bars, 300 μm. ****P<0.0001.
Figure 3.
Figure 3.. Characterization of reversibility, Ca2+ sensitivity, and time integration of CaST.
A) To test the split enzyme’s reversibility, HEK cells were transfected with CaST-IRES and treated either with biotin alone for 30 minutes (top), with Ca2+ for 30 minutes followed by a 10-minute wash and then biotin for 30 minutes (middle), or with biotin + Ca2+ simultaneously for 30 minutes (bottom). Example images are shown for all 3 conditions with SA-647 staining of biotin and GFP expression of CaST-IRES. Scale bar, 300 μm. B) The FOV averages of the SA-647/GFP fluorescence ratio per cell for the 3 conditions shown in panel A (n = 8 FOVs per condition; Biotin − Ca2+ vs. Ca2+/wash/Biotin: P = 0.75; Biotin − Ca2+ vs. Biotin + Ca2+: P = 4.9e-8; Ca2+/wash/Biotin vs. Biotin + Ca2+: P = 1.3e-8; Tukey’s post-hoc multiple comparison’s test following a 1-way ANOVA, F2,21 = 56.37, P = 3.6e-9). C) Example FOVs of HEK cells transfected with CaST-IRES and treated with biotin and increasing concentrations of CaCl2 (and 1μM ionomycin). D) The FOV averages of the SA-647/GFP fluorescence ratio per cell for the CaCl2 concentrations shown in panel C (n = 7 FOVs per condition; 0 mM versus 2.5 mM: P = 7.6e-4; 0 mM versus 5 mM: P = 8.8e-7; 0 mM versus 7.5 mM: P = 5.5e-10; 0 mM versus 10 mM: P = 5.4e-12; Tukey’s post-hoc multiple comparison’s test following a 1-way ANOVA, F4,30 = 44.07, P = 3.8e-12). The FOV average SA-647/GFP ratios were linearly correlated with CaCl2 concentration (Two-tailed Pearson’s correlation coefficient R = 0.99, P = 0.001). E) Example FOVs of HEK cells transfected with CaST-IRES and treated with 50 μM biotin and ± Ca2+ (5 mM CaCl2 and 1 μM ionomycin) for different durations. F) The mean FOV averages of the SA-647/GFP fluorescence ratio per cell for the different stimulation times shown in panel E (n = 10 FOVs per condition). The untreated condition is shown on the left. Data is plotted as mean ± s.e.m. All scale bars, 300 μm. ***P<0.001, ****P<0.0001, ns, not significant.
Figure 4.
Figure 4.. Comparison of CaST to an existing technology, FLiCRE.
A,B) Schematics of CaST (A) and FLiCRE (B) as AND logic gates, and the experimental paradigms used to test the time course of labeling detection after biotin + Ca2+ (CaST) and light + Ca2+ (FLiCRE) stimulation. Cells were transfected with either CaST-IRES or FLiCRE (Extended Data Fig. 4A) components. C) For CaST, the FOV average of the SA-647 cell fluorescence was calculated following a variable delay period after biotin ± Ca2+ stimulation (n = 12 FOVs for conditions with 0, 4, 6, 8 hr delay; n = 11 FOVs for conditions with 2 hr delay; 0 hr: P = 1.0e-30; 2 hr: P = 3.0e-36; 4 hr: P = 2.4e-35; 6 hr: P = 3.0e-24; 8 hr: P = 1.4e-10; Šídák’s post-hoc multiple comparison’s test following a 2-way ANOVA, F4,108 = 25.94, P = 4.5e-15). D) For FLiCRE, the FOV average of the UAS::mCherry cell fluorescence was calculated following a variable delay period after light ± Ca2+ stimulation. (n = 11 FOVs for conditions with 0 hr delay; n = 12 FOVs for conditions with 2, 4, 6, 8 hr delay; 6 hr: P = 4.6e-5; 8 hr: P = 2.4e-28; Šídák’s post-hoc multiple comparison’s test following a 2-way ANOVA, F4,108 = 46.46, P = 1.2e-22). E, F) The ± Ca2+ SBR of normalized reporter expression is shown for both CaST (panel E) and FLiCRE (panel F). For CaST, the SA-647 fluorescence is divided by the GFP fluorescence (n = 12 FOVs for conditions with 0, 4, 6, 8 hr delay; n = 11 FOVs for conditions with 2 hr delay). For FLiCRE, the UAS::mCherry fluorescence is divided by the GFP fluorescence (n = 11 FOVs for conditions with 0 hr delay; n = 12 FOVs for conditions with 2, 4, 6, 8 hr delay). Data are plotted as mean ± s.e.m. in C-D. ****P<0.0001.
Figure 5.
Figure 5.. CaST performance in cultured neurons.
A) Example FOVs of cultured rat hippocampal neurons infected with AAV2/1-Synapsin-CD4-sTb(C)-M13-GFP and AAV2/1-Synapsin-CaM-sTb(N) viruses and stimulated with ± biotin and ± KCl for 30 minutes. B) The FOV averages of the SA-647/GFP fluorescence ratio per cell for the data shown in panel A (n = 6 FOVs per condition; −Biotin −KCl vs. +Biotin +KCl: P = 1.8e-12; −Biotin +KCl vs. +Biotin +KCl: P = 3.0e-11; +Biotin −KCl vs. +Biotin +KCl: P = 1.4e-10; −Biotin −KCl vs. +Biotin −KCl: P = 0.013; Šídák’s post-hoc multiple comparison’s test following a 2-way ANOVA, F1,20 = 59.43, P = 2.1e-7). C) Example FOVs of rat hippocampal neurons infected with CaST as in panel A but stimulated with biotin ± KCl for only 10 minutes. D) The FOV averages of the SA-647/GFP fluorescence ratio per cell for the data shown in panel C (n = 8 FOVs per condition; P = 0.015, U = 9, two-tailed Mann-Whitney U test). E) Fraction of all GFP+ neurons that are also SA-647+ (defined as having an SA-647 fluorescence value greater than the 90th percentile of neurons in the biotin − KCl group). Data is quantified for the 10-minute labeling experiment shown in panel C (n = 8 FOVs per condition; P = 0.003, U = 5, two-tailed Mann-Whitney U test) and for a replicated 30-minute labeling experiment shown in Extended Data Fig. 5B,C (n = 6 FOVs per condition; P = 0.002, U = 0, two-tailed Mann-Whitney U test). Data is plotted as mean ± s.e.m. F) Example FOVs of rat hippocampal neurons infected with CaST as in panel A and treated with 50 μM biotin and 10 μM dopamine (DA), 10 μM DOI, or 30 mM KCl for 30 minutes. G) The FOV averages of the SA-647/GFP fluorescence ratio per cell for the conditions shown in panel F (n = 12 FOVs per condition; −KCl vs. DA: P = 0.547; −KCl vs. DOI: P = 0.008; −KCl vs. KCl: P = 6.5e-4, Tukey’s post-hoc multiple comparison’s test following a 1-way ANOVA, F3,44 = 7.373, P = 4.2e-4). All scale bars, 300 μm. *P<0.05, **P<0.01, ***P<0.001, ****P<0.0001, ns, not significant.
Figure 6.
Figure 6.. Non-invasive identification of psilocybin-activated neurons in vivo.
A) Schematic for using CaST to tag psilocybin-activated neurons during HTR measurement. B) Example mPFC images of SA-647 and CaST GFP fluorescence, for mice injected with biotin+saline, or biotin+psilocybin. C) Mean SA-647 vs. GFP fluorescence for each GFP+ neuron detected in biotin+saline mice (n = 218 neurons from 3 mice) or biotin+saline injected mice (n = 220 neurons from 3 mice). The horizontal dashed line indicates the 90th percentile threshold value of all SA-647 neurons in the biotin+saline group. D) FOV averages of the SA-647/GFP fluorescence ratios from panel C (n = 8 FOVs pooled from 3 mice in both conditions; P = 6.2e-4, U = 38, two-tailed Mann-Whitney U test). E) Fraction of all GFP+ neurons that are SA-647+ (thresholded using the dotted line in panel C; n = 8 FOVs pooled from 3 mice in both conditions; P = 1.6e-4, U = 36, two-tailed Mann-Whitney U test). F) Cell masks of SA-647+ mPFC neurons identified during HTR measurements. FOVs with the same number of HTRs were taken from the same mice, but from independent CaST injections on opposite hemispheres. G) Number of HTRs vs. the number of SA-647+ neurons/mm2 for data shown in panel F (n = 6 FOVs from independent CaST injections; Two-tailed Pearson’s correlation coefficient R = 0.85, P = 0.03). H) Number of HTRs vs. the mean cell SA-647/GFP ratio for data shown in panel F. I) Example mPFC images of CaST GFP, SA-647 staining, and c-Fos staining in mice treated with biotin+saline, or biotin+psilocybin. J-L) Number of c-Fos+ neurons/mm2 (J), SA-647+ neurons/mm2 (K), or SA-647+ divided by GFP+ neurons/mm2 per FOV (L), in biotin+saline vs. biotin+psilocybin injected mice (n = 5 mice per condition; (J) P = 0.42, U = 8, two-tailed Mann-Whitney U test; (K) P = 0.0079, U = 0, two-tailed Mann-Whitney U test; (L) P = 0.0079, U = 0, two-tailed Mann-Whitney U test). All scale bars, 50 μm. Data are plotted as mean ± s.e.m. in E, J-L. **P<0.01, ***P<0.001, ns, not significant.

References

    1. Grynkiewicz G., Poenie M. & Tsien R.Y. A new generation of Ca2+ indicators with greatly improved fluorescence properties. Journal of biological chemistry 260, 3440–3450 (1985). - PubMed
    1. Tian L. et al. Imaging neural activity in worms, flies and mice with improved GCaMP calcium indicators. Nature methods 6, 875–881 (2009). - PMC - PubMed
    1. Chen T.-W. et al. Ultrasensitive fluorescent proteins for imaging neuronal activity. Nature 499, 295–300 (2013). - PMC - PubMed
    1. Inoue M. et al. Rational design of a high-affinity, fast, red calcium indicator R-CaMP2. Nature methods 12, 64–70 (2015). - PubMed
    1. Wang W. et al. A light- and calcium-gated transcription factor for imaging and manipulating activated neurons. Nature Biotechnology 35, 864–871 (2017). - PMC - PubMed

Publication types