[Preprint]. 2024 May 15:2023.06.22.546154.
doi: 10.1101/2023.06.22.546154.

Methods to Utilize Pulse Wave Velocity to Measure Alterations in Cerebral and Cardiovascular Parameters

Affiliations

Methods to Utilize Pulse Wave Velocity to Measure Alterations in Cerebral and Cardiovascular Parameters

Andrea G Marshall et al. bioRxiv. .

Update in

  • Alterations in Cardiovascular Parameters in 5xFAD Murine Model.
    Marshall AG, Stephens D, Neikirk K, Masenga SK, Shao B, Crabtree A, Vue Z, Beasley HK, Garza-Lopez E, Scudese E, Rodriguez BI, Le H, Damo S, Taffet GE, Ochayi OM, McMillan R, Afolabi JM, Exil V, Oliver A, Sharma V, Martin P, Gaye A, Harris C, Tomeau B, Bell L, Hamilton M, Gillyard T, Webster R, Jackson M, Prakash P, Frierson S, Dash C, Mungai M, Kirabo A, Gaddy JA, Wandira N, Hinton A Jr, Reddy AK. Marshall AG, et al. Cell Biochem Funct. 2025 Nov;43(11):e70138. doi: 10.1002/cbf.70138. Cell Biochem Funct. 2025. PMID: 41215534 Free PMC article.

Abstract

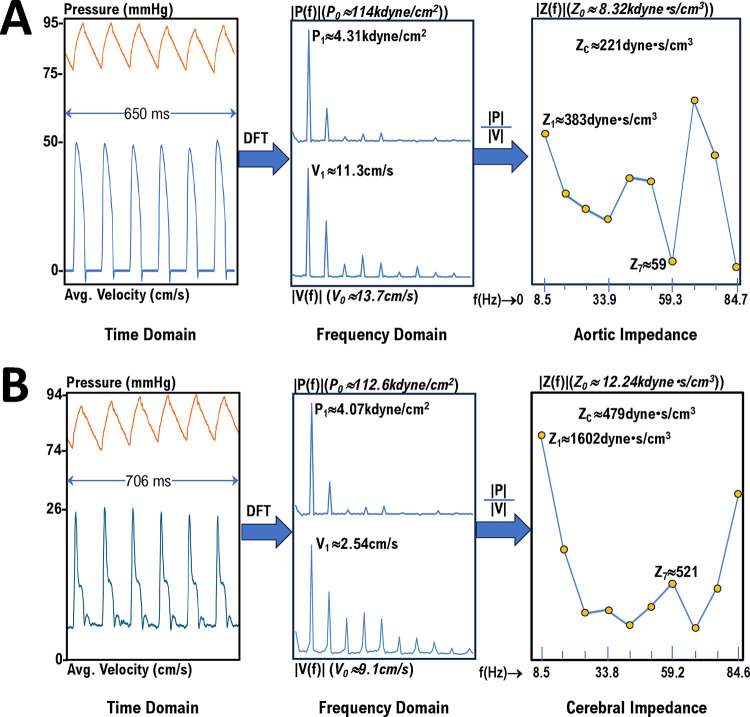
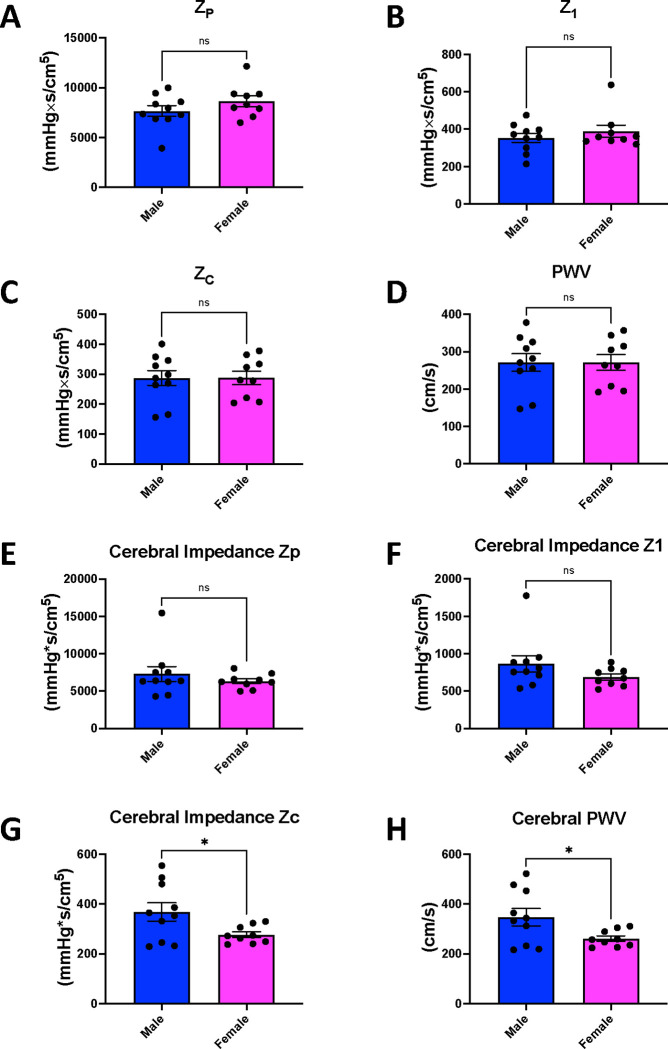
Alzheimer's Disease (AD) is a global health issue, affecting over 6 million in the United States, with that number expected to increase as the aging population grows. As a neurodegenerative disorder that affects memory and cognitive functions, it is well established that AD is associated with cardiovascular risk factors beyond only cerebral decline. However, the study of cerebrovascular techniques for AD is still evolving. Here, we provide reproducible methods to measure impedance-based pulse wave velocity (PWV), a marker of arterial stiffness, in the systemic vascular (aortic PWV) and in the cerebral vascular (cerebral PWV) systems. Using aortic impedance and this relatively novel technique of cerebral impedance to comprehensively describe the systemic vascular and the cerebral vascular systems, we examined the sex-dependent differences in 5x transgenic mice (5XFAD) with AD under normal and high-fat diet, and in wild-type mice under a normal diet. Additionally, we validated our method for measuring cerebrovascular impedance in a model of induced stress in 5XFAD. Together, our results show that sex and diet differences in wildtype and 5XFAD mice account for very minimal differences in cerebral impedance. Interestingly, 5XFAD, and not wildtype, male mice on a chow diet show higher cerebral impedance, suggesting pathological differences. Opposingly, when we subjected 5XFAD mice to stress, we found that females showed elevated cerebral impedance. Using this validated method of measuring impedance-based aortic and cerebral PWV, future research may explore the effects of modifying factors including age, chronic diet, and acute stress, which may mediate cardiovascular risk in AD.

Keywords: Aortic Impedance; Cerebral Blood Flow; Cerebral Impedance; Doppler Flow System.


Conflict of interest statement

Disclosures Dr. Reddy is a collaborator and consultant with Indus Instruments, Webster, TX. All other authors have no competing interests.

Figures

Figure 1:
Figure 1:
(A) Experimental setup to noninvasively measure cerebral (at ophthalmic artery, OA) & aortic pulse wave velocity. One probe is fixed at the aortic arch and the other probe is switched between ophthalmic artery or abdominal aorta sites for Arch-OA combined signals or Arch-Abd combined signals. Electrocardiography (ECG) waveform is shown for timing. (B) Experimental setup to measure aortic blood flow velocity, aortic blood pressure and) ECGin mice. The probe is repositioned at carotid artery (shown in the right panel along with pressure & ECG signals). The probe is repositioned again to measure mitral flow velocity (waveform not shown).
Figure 2:
Figure 2:
(A) Procedure to calculate aortic impedance – conversion of time domain signals to frequency domain spectrums and calculation of impedance modulus (|Z(f)| = |P(f)|/|V(f)|). Zc is calculated as the average of Z2 to Z10 harmonics. (B) Procedure to calculate cerebral impedance – conversion of time domain signals to frequency domain spectrums and calculation of impedance modulus (|Z(f)| = |P(f)|/|V(f)|). Zc is calculated as the average of Z2 to Z10 harmonics.
Figure 3:
Figure 3:
Parameters of aortic and cerebral impedance sex-dependent differences in chow-fed 8-month-old wildtype (C57BL6J) mice. (A) Total peripheral resistance (ZP), (B) impedance at first harmonic (Z1), (C) characteristic impedance, (ZC) (D) and impedance-based pulse wave velocity (PWV) in aortic and (E-H) cerebral impedance. Data are presented as mean±SEM (n = 5/group). * represents p <0.05, ns indicates a statistically non-significant relationship, as determined through an unpaired t-test.
Figure 4:
Figure 4:
Parameters of aortic and cerebral impedance sex-dependent differences in chow-fed 5-month-old 5XFAD mice. (A) Total peripheral resistance (ZP), (B) impedance at first harmonic (Z1), (C) characteristic impedance, (ZC) (D) and impedance-based pulse wave velocity (PWV) in aortic and (E-H) cerebral impedance. Data are presented as mean±SEM (n = 9–10/group). * represents p <0.05, ns indicates a statistically non-significant relationship, as determined through an unpaired t-test.
Figure 5:
Figure 5:
Parameters of aortic and cerebral impedance sex-dependent differences in high fat diet-fed 5-month-old 5XFAD mice. (A) Total peripheral resistance (ZP), (B) impedance at first harmonic (Z1), (C) characteristic impedance, (ZC) (D) and impedance-based pulse wave velocity (PWV) in aortic and (E-H) cerebral impedance. Data are presented as mean±SEM (n = 9–10/group). * represents p <0.05, ns indicates a statistically non-significant relationship, as determined through an unpaired t-test.
Figure 6:
Figure 6:
Parameters of aortic and cerebral in pre-stress and stressed state of 5-month-old 5XFAD mice. (A) Total peripheral resistance (ZP), (B) impedance at first harmonic (Z1), (C) characteristic impedance, (ZC) (D) and impedance-based pulse wave velocity (PWV) in aortic and (E-H) cerebral impedance. Data are presented as mean±SEM (n = 10/group). *, ** represents p <0.05, p<0.01, respectively, and ns indicates a statistically non-significant relationship, as determined through an unpaired t-test.

Publication types