[Preprint]. 2024 May 16:2024.05.10.593637.
doi: 10.1101/2024.05.10.593637.

Single-cell morphology encodes functional subtypes of senescence in aging human dermal fibroblasts

Affiliations

Single-cell morphology encodes functional subtypes of senescence in aging human dermal fibroblasts

Pratik Kamat et al. bioRxiv. .

Update in

Abstract

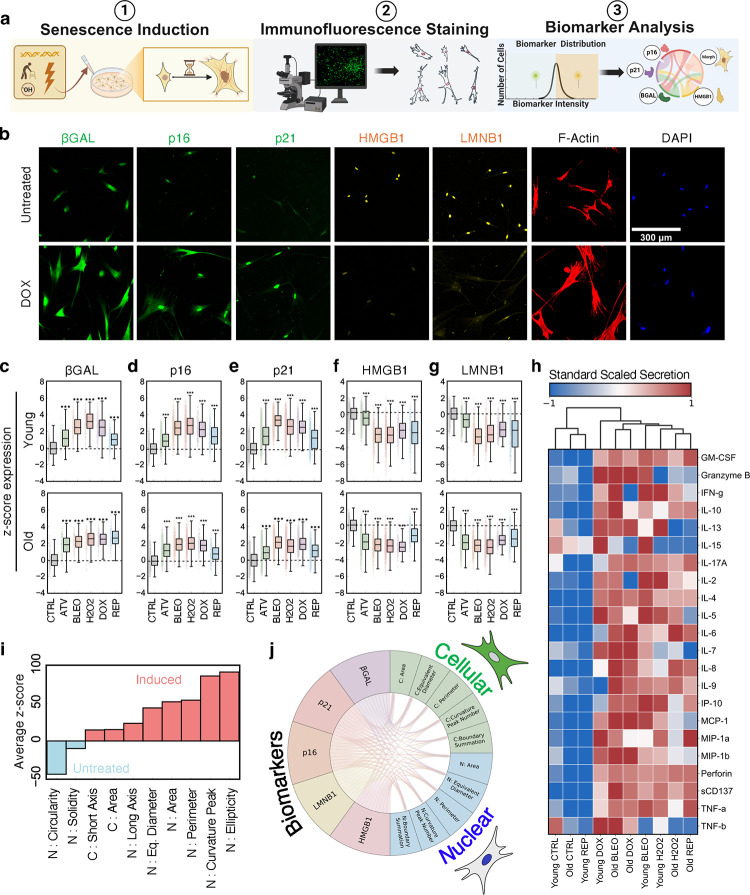
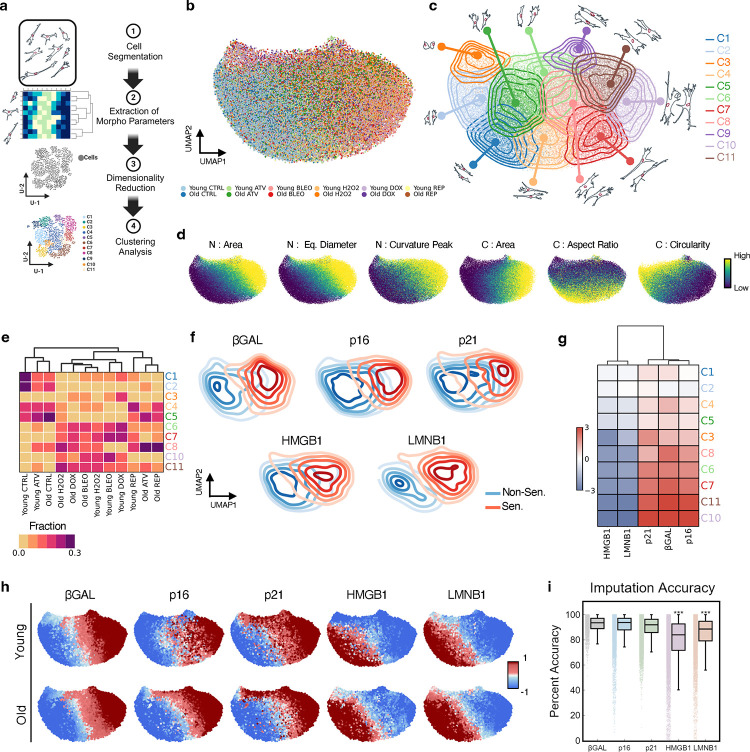
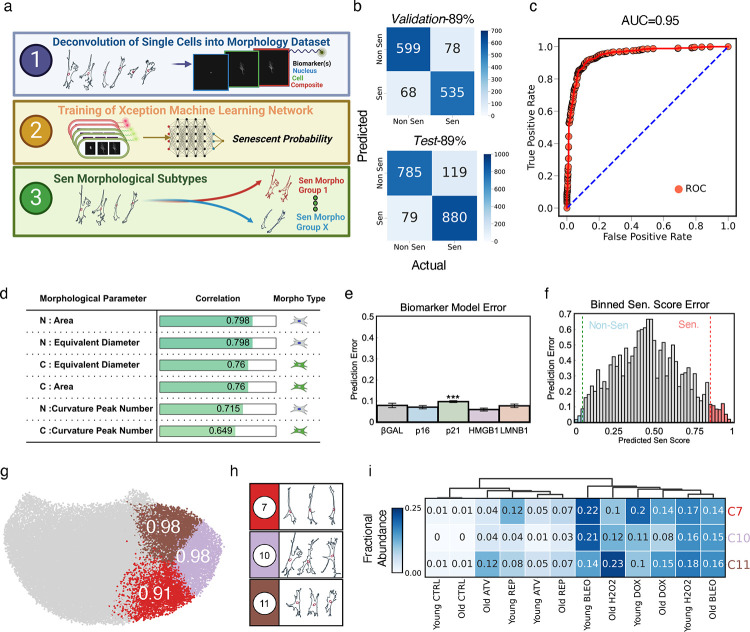
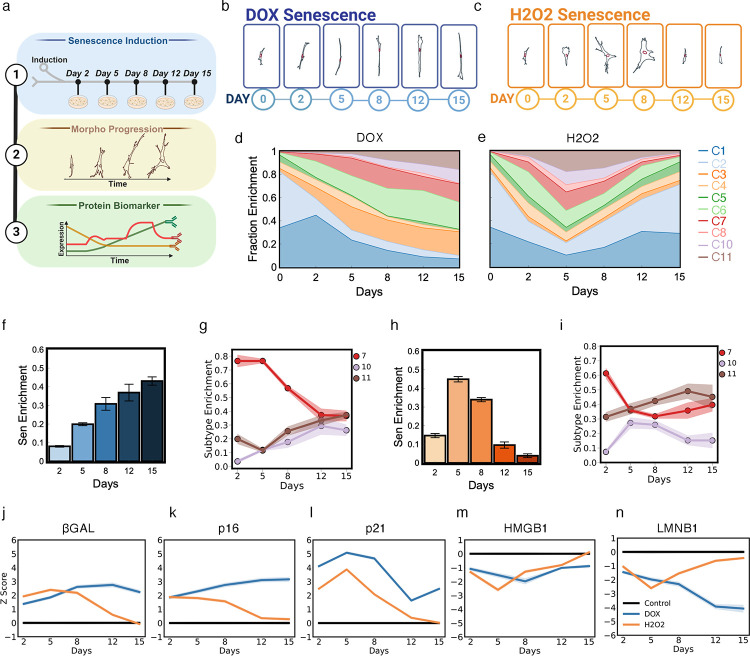
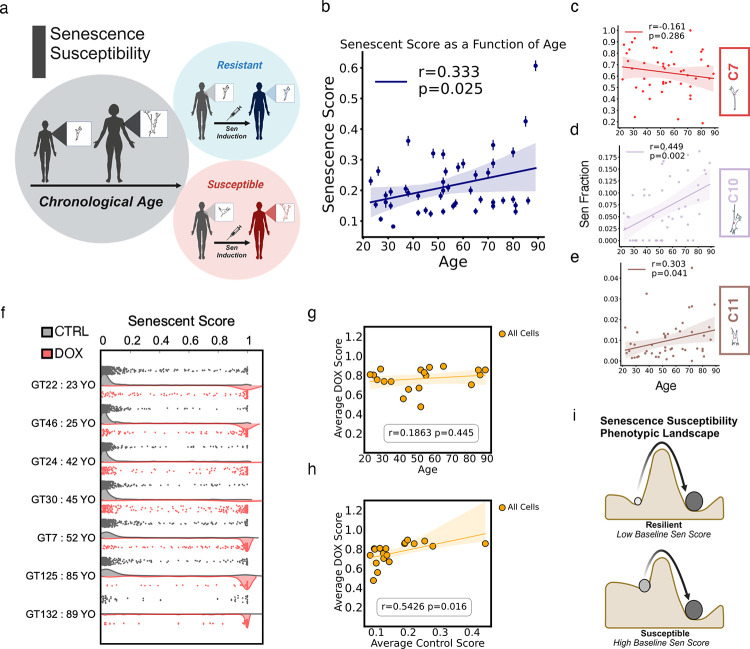
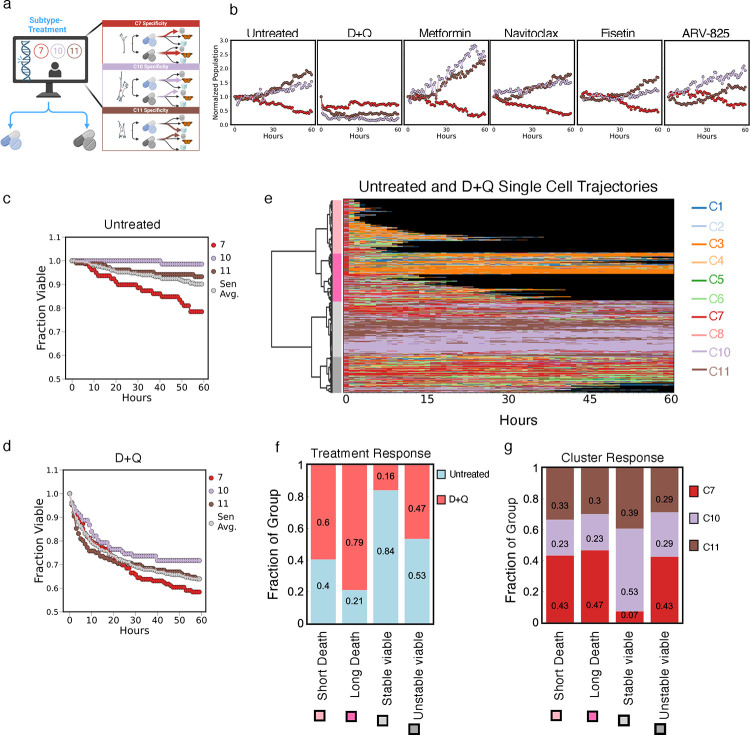
Cellular senescence is an established driver of aging, exhibiting context-dependent phenotypes across multiple biological length-scales. Despite its mechanistic importance, profiling senescence within cell populations is challenging. This is in part due to the limitations of current biomarkers to robustly identify senescent cells across biological settings, and the heterogeneous, non-binary phenotypes exhibited by senescent cells. Using a panel of primary dermal fibroblasts, we combined live single-cell imaging, machine learning, multiple senescence induction conditions, and multiple protein-based senescence biomarkers to show the emergence of functional subtypes of senescence. Leveraging single-cell morphologies, we defined eleven distinct morphology clusters, with the abundance of cells in each cluster being dependent on the mode of senescence induction, the time post-induction, and the age of the donor. Of these eleven clusters, we identified three bona-fide senescence subtypes (C7, C10, C11), with C10 showing the strongest age-dependence across a cohort of fifty aging individuals. To determine the functional significance of these senescence subtypes, we profiled their responses to senotherapies, specifically focusing on Dasatinib + Quercetin (D+Q). Results indicated subtype-dependent responses, with senescent cells in C7 being most responsive to D+Q. Altogether, we provide a robust single-cell framework to identify and classify functional senescence subtypes with applications for next-generation senotherapy screens, and the potential to explain heterogeneous senescence phenotypes across biological settings based on the presence and abundance of distinct senescence subtypes.

Keywords: aging; biomarkers; cell morphology; cellular senescence; functional subtypes.


Conflict of interest statement

Conflict of interest. P.K, N.M., J.M.P are inventors on a patent application related to this work. All other authors declare no conflict of interest.

Figures

Figure 1.
Figure 1.. Cellular and nuclear morphology are biomarkers for in vitro cellular senescence.
a. Graphical illustration of experimental workflow to induce and characterize senescent cells. b. Representative images of the immunofluorescent staining of 5 senescence-associated protein biomarkers across untreated (DMSO vehicle) and DOX-induced primary dermal fibroblast samples (age 23- male). c-g. Z-score fluorescence quantification relative to control of βGal (c), p16 (d), p21 (e), HMGB1 (f), and LMNB1 (g) for young and old dermal fibroblast samples (n>400 single cells per condition, mean ± 95% CI, One-Way ANOVA relative to age-matched control expression, p ≤ 0.001 relative to control). h. Heatmap of standard scaled expression of pro-inflammatory secretions for induction conditions (average algorithm, Euclidean linkage). i. Waterfall plot of cellular and nuclear morphological features enrichment to either untreated or senescence-induced samples across both ages (cutoffs= Log2 > 10). j. Circos plot of the 5 stained senescence-associated protein biomarkers and highly correlated morphological features. Connecting arcs represent an absolute value correlation coefficient greater than 0.3.
Figure 2.
Figure 2.. Morphology encodes heterogeneity within the senescent phenotype.
a. Schematic of morphological analysis pipeline. b. Scatter of UMAP space based on 87 morphological parameters for all conditions across both age groups (n≈48,000 single cells). Individual points represent single cells. c. Overlay of the 11 optimal KMEANS clusters on top of the UMAP space with representative cellular (outer) and nuclear (inner) morphologies. Contour lines indicate gaussian kernel density function for each cluster. Cluster 9 consisted of mis-segmented cells and was dropped from subsequent analysis d. Plots of select morphological features layered on top of the UMAP space; navy and yellow colors delineate high and low standard scaled expression, respectively. Generally, UMAP-1 (x-axis) was correlated with nuclear and cellular size and UMAP-2 (y-axis) was correlated with cell rounding. e. Heatmap displaying the fractional abundance of cells within each KMEANS cluster for each experimental group (n>1000 cells per condition, average algorithm, Euclidean linkage). f. Contour overlay of hypothesized non-senescent and senescent classifications for βGal, p16, p21, HMGB1, and LMNB1. Senescence cutoff was determined by the z-score magnitude being greater than 2 with respect to upregulation or downregulation of the biomarker. g. Heatmap of the average quantified protein biomarker expression per cluster, organized top-bottom to match left-right traversal across the manifold (z-score expression, average clustering algorithm, Euclidean linkage). h. Scatter plots of the UMAP space with biomarker expressions across young and old samples. Visualization uses a combination of ground truth (if applicable) and imputed biomarker expressions to fill in the breadth of the manifold. i. Imputation error using morphological parameters of single cells to predict protein biomarker expression (n>500 cells per biomarker, mean ± 95% CI, multiple comparison Tukey test, p ≤ 0.001 for HMGB1 and LMNB1 relative to other biomarkers). Accuracy is defined as the one minus the percent deviation from model-predicted value divided by the ground truth value. HMGB1 and LMNB1 expressed error statistically difference compared to all other biomarkers.
Figure 3.
Figure 3.. Machine learning and computational techniques identify morphological subtypes of senescence.
a. Workflow for using cellular and nuclear textured images to develop single-cell resolution ‘senescent scores’, ranging from 0–1. Training was conducted on an age, induction, and biomarker balanced cohort of 6,000 single cells (see Methods for further detail on senescent cutoffs and dataset creation). b. Confusion matrix describing accuracy of trained Xception model on test and validation datasets. c. Receiver-operating characteristic (ROC) curve of the Xception model with an area under the curve (AUC) of 0.95. d. Top magnitude correlations between morphological parameters of single cells and their corresponding model-predicted senescent scores. e. Average model prediction error associated with each senescent-associated protein biomarker. Error is defined as the magnitude difference between predicted score and ground truth score (n>500 cells per biomarker, mean ± 95% CI, Tukey multiple comparison test, p ≤ 0.001 p21 relative to other biomarkers). f. Misclassification error associated with binned, model-predicted senescent scores (0.02 interval bins spanning 0–1). Error is defined as the fraction of cells within the bin in which the integer-rounded score does not match the true score (See Methods for further detail); bins with errors below 12% are highlighted in blue or red to highlight control and senescent high confidence regimes. g. Identification of 3 KMEANS morphological clusters (morphological subtypes) with average senescent scores within 12 % error. h. Representative morphologies of the three senescent morphological subtypes. i. Heatmap describing the differential enrichment amongst the three morphological senescence subtypes across all experimental conditions (average algorithm, Euclidean linkage).
Figure 4.
Figure 4.. Senescence is a dynamic phenotype.
a. Experimental design for analyzing the kinetics of senescence progression. b-c. representative morphologies for each time point for both DOX induction (b) and H2O2 induction (c). d-g. Senescence fraction enrichment and subtype dynamics with time. Box plots showing the fraction of cells within senescent morphological subtypes compared to all clusters for DOX (d) and H2O2 (f) induced samples (n>1000 cells per day, mean ± SEM). Line plots describe fractional distribution progression between the senescent morphological subtypes for DOX (e) and H2O2 (f) (shading indicates 95% CI around the mean). j-n. Average Z-score quantification of βGal (j), p16 (k), p21 (l), HMGB1 (m), and LMNB1 (n) as a function of time post senescence induction (shading indicates 95% CI around the mean). 23-year old fibroblasts were used for this analysis.
Figure 5.
Figure 5.. Baseline morphology better encodes senescence susceptibility than chronological age.
a. Graphical depiction of hypothesized divergent senescent susceptibility responses as a function of age. b. Average senescent score from primary dermal fibroblast samples as a function of chronological age fit to a univariate linear regression model (n>300 cells per sample, mean ± SEM). c-e. Fraction of senescent cells within each of the three morphological subtypes as a function of chronological age, fit to a univariate linear regression model (from top to bottom: cluster 7,10, and 11 respectively). f. Double violin plot for age-dispersed senescent score sample distributions at baseline (grey) and after DOX induction (red) (n>100 cells per condition). g. linear regression model of the average DOX-induced senescence score against the chronological age of the sample. h. linear regression model of the average DOX-induced senescence score against the average baseline senescent score of the sample. i. Senescence susceptibility postulate where induction response is governed by baseline morphological profiles.
Figure 6.
Figure 6.. Morphological subtypes encode differential therapeutic response modalities.
a. Visualization of hypothesized differential therapeutic response profiles of senescence morphological subtypes. b. Quasi-population level counts of senescent cell morphological subtypes for untreated, D+Q, metformin, navitoclax, fisetin, and ARV-825 as a function of treatment duration time. Cell number were normalized relative to count at baseline for each condition (t=0 hours, n>150 per subtype per treatment condition). c-d. Single-cell trajectory viability analysis of morphological subtypes as a function of treatment duration time for untreated (c) and D+Q treatment (d). Cells from the induced population were discretized into the different senescence morphological subtypes based on morphology at baseline (t=0, n>100 cells per cluster); cell trajectories were considered non-viable after entering KMEANS clusters 1,2, or 3 and subsequently losing tracking for subsequent frames. Grey Sen Avg. line represents the weighted average viability trends. e. Heatmap displaying representative morphological evolution of single cells for untreated and D+Q treated starting in one of the three morphological subtypes of senescence. Colors coordinate with KMEANS cluster colors with black indicative of a cell trajectory that has lost tracking (n = 480 cells samples, ward cluster method, Euclidean distance, threshold of 190). Dendrogram clustering was used to determine four overarching response modalities. f. Untreated versus Dox enrichment in each of the four response modalities identified in the trajectory heatmap. g. Morphological subtype enrichment in each of the four response modalities identified in the trajectory heatmap, normalized to cell count. DOX induced senescent cells in the 23-year old sample were used for this analysis.

References

    1. Hernandez-Segura A., Nehme J. & Demaria M. Hallmarks of Cellular Senescence. Trends Cell Biol 28, 436–453 (2018). - PubMed
    1. Han S., Georgiev P., Ringel A. E., Sharpe A. H. & Haigis M. C. Age-associated remodeling of T cell immunity and metabolism. Cell Metab 35, 36–55 (2023). - PMC - PubMed
    1. Di Micco R., Krizhanovsky V., Baker D. & d’Adda di Fagagna F. Cellular senescence in ageing: from mechanisms to therapeutic opportunities. Nat Rev Mol Cell Biol 22, 75–95 (2021). - PMC - PubMed
    1. Nathan Basisty AND Kale A. A. N. D. J. O. H. A. N. D. K. C. A. N. D. P. T. A. N. D. R. C. A. N. D. H. A. A. N. D. S. S. A. N. D. S. V. A. N. D. F. L. A. N. D. C. J. A. N. D. S. B. A proteomic atlas of senescence-associated secretomes for aging biomarker development. PLoS Biol 18, 1–26 (2020). - PMC - PubMed
    1. Heckenbach I. et al. Nuclear morphology is a deep learning biomarker of cellular senescence. Nat Aging 2, 742–755 (2022). - PMC - PubMed

Publication types