[Preprint]. 2025 Jan 27:2024.05.17.594562.
doi: 10.1101/2024.05.17.594562.

Phase synchrony between prefrontal noradrenergic and cholinergic signals indexes inhibitory control

Affiliations

Phase synchrony between prefrontal noradrenergic and cholinergic signals indexes inhibitory control

Yuxiang Andy Liu et al. bioRxiv. .

Update in

Abstract

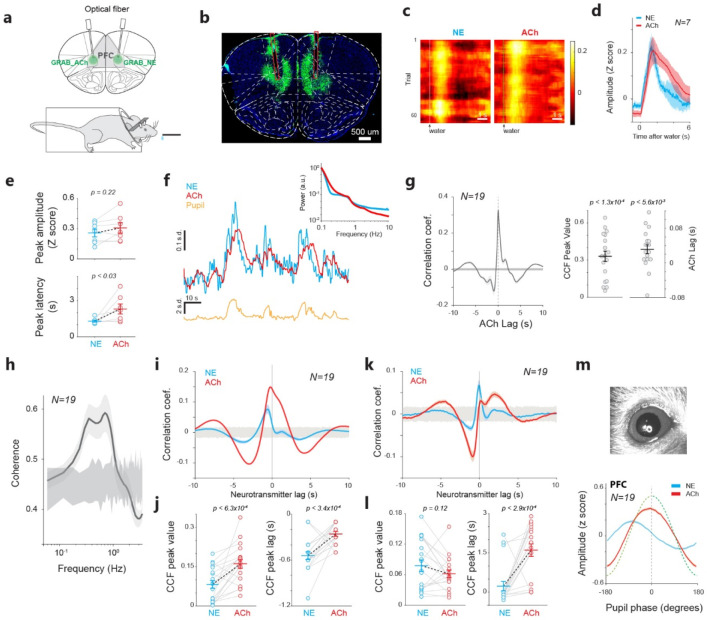
Inhibitory control is a critical executive function that allows animals to suppress their impulsive behavior in order to achieve certain goals or avoid punishment. We investigated norepinephrine (NE) and acetylcholine (ACh) dynamics and population neuronal activity in the prefrontal cortex (PFC) during inhibitory control. Using fluorescent sensors to measure extracellular levels of NE and ACh, we simultaneously recorded prefrontal NE and ACh dynamics in mice performing inhibitory control tasks. The prefrontal NE and ACh signals exhibited strong coherence at 0.4-0.8 Hz. Although inhibition of locus coeruleus (LC) neurons projecting to the PFC impaired inhibitory control, inhibiting LC neurons projecting to the basal forebrain (BF) caused a more profound impairment, despite an approximately 30% overlap between LC neurons projecting to the PFC and BF, as revealed by our tracing studies. The inhibition of LC neurons projecting to the BF did not diminish the difference in prefrontal NE/ACh signals between successful and failed trials; instead, it abolished the difference in NE-ACh phase synchrony between successful and failed trials, indicating that NE-ACh phase synchrony is a task-relevant neuromodulatory feature. Chemogenetic inhibition of cholinergic neurons that project to the LC region did not impair inhibitory control, nor did it abolish the difference in NE-ACh phase synchrony between successful or failed trials, further confirming the relevance of NE-ACh phase synchrony to inhibitory control. To understand the possible effect of NE-ACh synchrony on prefrontal population activity, we employed Neuropixels to record from the PFC during inhibitory control. The inhibition of LC neurons projecting to the BF not only reduced the number of prefrontal neurons encoding inhibitory control, but also disrupted population firing patterns representing inhibitory control, as revealed by a demixed principal component (dPCA) analysis. Taken together, these findings suggest that the LC modulates inhibitory control through its collective effect with cholinergic systems on population activity in the prefrontal cortex. Our results further indicate that NE-ACh phase synchrony is a critical neuromodulatory feature with important implications for cognitive control.

Keywords: Locus coeruleus; basal forebrain; cholinergic system; impulsivity; inhibitory control; noradrenergic system; prefrontal cortex; pupil.


Figures

Figure 1.
Figure 1.. Spontaneous fluctuation of NE and ACh levels in the prefrontal cortex.
a) Diagram of GRABNE and GRABACh recording. b) Histological confirmation of expression of GRABNE and GRABACh in the prefrontal cortex. c) Example heatmap of NE and ACh responses to water rewards. d) NE and ACh dynamics around water rewards. 25 sessions from 7 animals. e) NE and ACh peak responses (top) and their latency (bottom) to water rewards. f) Example traces of simultaneously recorded NE, ACh, and pupil size. Inset: spectrum of NE and ACh signals. g) Cross-correlogram between NE and ACh signals. 165 sessions from 19 animals. Shaded area around 0 indicates 99.7% confidence interval. h) Coherence between NE and ACh signals. 165 sessions from 19 animals. Shaded area around 0 indicates 99.7% confidence interval. i,j) Cross-correlogram between NE/ACh signals and pupil size. 111 sessions from 19 animals. Horizontal shaded area around 0 indicates 99.7% confidence interval. k,l) Cross-correlogram between NE/ACh signals and the first derivative of pupil size. 111 sessions from 19 animals for panels k-m. Shaded area around 0 indicates 99.7% confidence interval. m) Example image of the pupil of a mouse (top) and the phase relationship between prefrontal NE/ACh signals and pupil fluctuations (bottom). Error bars or shaded area indicate S.E.M. in all figures unless otherwise indicated.
Figure 2.
Figure 2.. Prefrontal NE and ACh dynamics during inhibitory control.
a) Diagram of the inhibitory control task. b) Impulsive licking frequency during the initial shaping period. 52 sessions from 13 animals. c) Example raster plot of licks (top) and average licking frequency (bottom) around the onset of the inhibition tone. 260 sessions from 30 animals for panels c-f. d) Raw success rate and the chance-level success rate. e) Raw success rate associated with different inhibition tone durations. f) Reaction time associated with different inhibition tone durations. g) Success rate with and without the inactivation of the prefrontal cortex. 28 sessions from 3 animals. h) Success rate with and without the inactivation of noradrenergic inputs to the prefrontal cortex. 30 sessions from 3 animals. i) Success rate with and without the inactivation of cholinergic inputs to the prefrontal cortex. 44 sessions from 5 animals. j) NE and ACh dynamics around the onset of inhibition tone for the successful and failed trials. 165 sessions from 19 animals for panels g-o. k) Mean NE and ACh levels before inhibition tone onset. I) The peak value of NE and ACh transient responses to inhibition tone onset. m) The peak latency of NE and ACh transient responses. n) NE and ACh dynamics prior to behavioral outcomes in the successful and failed trials. o) Mean NE and ACh levels prior to behavioral outcomes. p) The slope of NE and ACh signals prior to behavioral outcomes. q) The trough time of NE and ACh signals prior to behavioral outcomes. r) The area under ROC curve (AUROC) calculated from signal distributions associated with the successful and failed trials for NE and ACh signals.
Figure 3.
Figure 3.. Chemogenetic silencing of BF-projecting LC neurons impaired the behavior but did not diminish the difference in NE and ACh signals between successful and failed trials.
a) Diagram of retrograde expression of DREADD receptors in LC neurons that project to the basal forebrain region. b) Histological confirmation of the expression of DREADD receptors in LC neurons. c) CNO-mediated chemogenetic inhibition of LC neurons that project to the basal forebrain region reduced the inhibitory control performance to the chance level. d,e) Chemogenetic inhibition of LC neurons that project to the basal forebrain region slowed down the reaction time but did not change licking frequency during the free period. f) Average NE/ACh signals prior to behavioral outcomes under saline and CNO treatment. g) NE/ACh signals prior to behavioral outcomes in the successful and failed trials under saline and CNO treatment. h,i) Mean NE and ACh levels prior to behavioral outcomes in the successful and failed trials under saline and CNO treatment. j) Area under the ROC curve (AUROC), which measures the normalized difference in NE/ACh levels between the successful and failed trials, under saline and CNO treatment. All data are from 34 saline sessions and 42 CNO sessions from 5 animals.
Figure 4.
Figure 4.. Phase synchrony between prefrontal NE and ACh signals is a robust indicator of inhibitory control behavior.
a) Illustration of the estimation of NE-ACh phase synchrony. b) Distribution of NE/ACh phase in successful and failed trials under saline and CNO treatment. 34 saline sessions and 42 CNO sessions from 5 animals for panels c-h. c) NE-ACh phase synchrony prior to behavioral outcomes under saline and CNO treatment. d) NE-ACh phase synchrony prior to behavioral outcomes in successful and failed trials under saline and CNO treatment. e) Mean NE-ACh phase synchrony prior to behavioral outcomes in successful and failed trials under saline and CNO treatment. f) AUROC calculated using NE-ACh phase synchrony under saline vs. CNO treatment. g) Difference in prefrontal NE-ACh phase synchrony between successful and failed trials was positively correlated with inhibitory control performance in saline control sessions but not in CNO treatment sessions. h) Switching rate prior to behavioral outcomes in successful and failed trials under saline and CNO treatment. i) Mean switching rate prior to behavioral outcomes in successful vs. failed trials under saline or CNO treatment. 76 sessions from 5 animals.
Figure 5.
Figure 5.. Retrograde tracing revealed distinct subgroups of LC neurons projecting to the prefrontal cortex and basal forebrain.
a) Diagram showing retrograde expression of different fluorophores in LC neurons that project to the prefrontal cortex and basal forebrain. b) Example confocal image showing co-expression of EYFP (pseudocolored green) and mCherry in LC neurons. c) Sections of the LC from an example mouse illustrating the spatial distribution of OFC-projecting and BF-projecting LC neurons. d) Quantification of LC neurons, OFC-projecting, and BF-projecting LC neurons across anterior-posterior sections. e) Overall quantification of LC neurons projecting to the OFC, BF, or both. The cartoon illustrates the percentage of LC neurons projecting to the PFC, BF, or both.
Figure 6.
Figure 6.. Neuropixels recording from the prefrontal cortex during inhibitory control.
a) Histological confirmation of the location of the Neuropixels probe (indicated by red dye and the yellow arrow) in the prefrontal cortex. The yellow line indicates a distance of 1.2 mm from the Neuropixels probe tip, where most of the active units during inhibitory control were located. b) Waveform characteristics of regular spiking units (RSU) and fast spiking units (FSU) (left panel) and their location from the tip of the Neuropixels probe (right panel). 15 saline sessions and 15 DCZ sessions from 3 animals for all neuropixels results. c) DCZ-mediated chemogenetic inhibition of LC neurons that project to the basal forebrain region reduced the inhibitory control performance to the chance level. d) Population firing rate prior to behavioral outcomes in the successful and failed trials under saline and DCZ treatment. Inset: mean firing rate under saline and DCZ treatment. e) Number of encoding neurons under saline and DCZ treatment. f) Total number of neurons under saline and DCZ treatment. g) Raster plot of spikes of an example encoding neuron on successful and failed trials. h) Population firing rate of encoding neurons prior to behavioral outcomes in the successful and failed trials under saline and DCZ treatment. Pie charts: percentage of encoding neurons with higher firing rates in successful trials and encoding neurons with lower firing rates in successful trials. Inset: distribution of encoding neurons along neuropixels probe. i) Raster plot of spikes of an example action-predicting neuron on successful and failed trials. j) Population firing rate of action-predicting neurons prior to behavioral outcomes in the successful and failed trials under saline and DCZ treatment. Left inset: distribution of encoding neurons along neuropixels probe. Right inset: mean firing rate under saline and DCZ treatment. k) Percentage of action-predicting neurons under saline and DCZ treatment. I) Number of encoding neurons among action-predicting neurons under saline and DCZ treatment.
Figure 7.
Figure 7.. Population firing patterns encoding inhibitory control in the prefrontal cortex.
a) Pairwise cross-correlogram across encoding neurons. 15 saline sessions and 15 DCZ sessions from 3 animals for all neuropixels results. b) Pairwise cross-correlogram across non-encoding neurons. c) Projection of population firing patterns associated with inhibitory control and independent component onto dPC1, dPC2 and dPC3, respectively. Left: saline control; right: DCZ treatment. d) Population firing patterns associated with inhibitory control plotted in a low-dimensional space. Left: saline control; right: DCZ treatment e) Cluster distance between population firing patterns associated with inhibitory control in successful and failed trials under saline and DCZ treatment. f) Cluster distance between population firing patterns associated with inhibitory control in successful and failed trials is positively correlated with behavioral performance in saline control sessions (left), but not in DCZ treatment sessions (right).
Figure 8.
Figure 8.. The relationship between NE/ACh phase synchrony and pupil size.
a) Pupil dynamics prior to behavioral outcomes in the successful and failed trials of the inhibitory control task. 111 sessions from 19 animals. b) Identification of temporal response functions that map NE, ACh, or NE-ACh phase synchrony to pupil size. c) There was no significant difference in temporal response functions that map prefrontal NE and ACh signals to pupil size between the successful and failed trials in the inhibitory control task. 111 sessions from 19 animals for panels d-e. d) Temporal response functions mapping prefrontal NE-ACh phase synchrony were more pronounced in the failed trials than in successful trials in the inhibitory control task.

References

    1. Dalley J.W., and Ersche K.D. (2019). Neural circuitry and mechanisms of waiting impulsivity: relevance to addiction. Philos Trans R Soc Lond B Biol Sci 374, 20180145. 10.1098/rstb.2018.0145. - DOI - PMC - PubMed
    1. Dalley J.W., and Robbins T.W. (2017). Fractionating impulsivity: neuropsychiatric implications. Nature Reviews Neuroscience 18, 158–171. 10.1038/nrn.2017.8. - DOI - PubMed
    1. Tomassini A., Hezemans F.H., Ye R., Tsvetanov K.A., Wolpe N., and Rowe J.B. (2022). Prefrontal Cortical Connectivity Mediates Locus Coeruleus Noradrenergic Regulation of Inhibitory Control in Older Adults. The Journal of Neuroscience 42, 3484. 10.1523/JNEUROSCI.1361-21.2022. - DOI - PMC - PubMed
    1. Terra H., Bruinsma B., de Kloet S.F., van der Roest M., Pattij T., and Mansvelder H.D. (2020). Prefrontal Cortical Projection Neurons Targeting Dorsomedial Striatum Control Behavioral Inhibition. Current Biology 30, 4188–4200.e4185. 10.1016/j.cub.2020.08.031. - DOI - PubMed
    1. Miller E.K., and Cohen J.D. (2001). An integrative theory of prefrontal cortex function. Annu Rev Neurosci 24, 167–202. 10.1146/annurev.neuro.24.1.167. - DOI - PubMed

Publication types