[Preprint]. 2024 May 17:2024.05.15.24307318.
doi: 10.1101/2024.05.15.24307318.

The mutagenic forces shaping the genomic landscape of lung cancer in never smokers

Affiliations

The mutagenic forces shaping the genomic landscape of lung cancer in never smokers

Marcos Díaz-Gay et al. medRxiv. .

Abstract

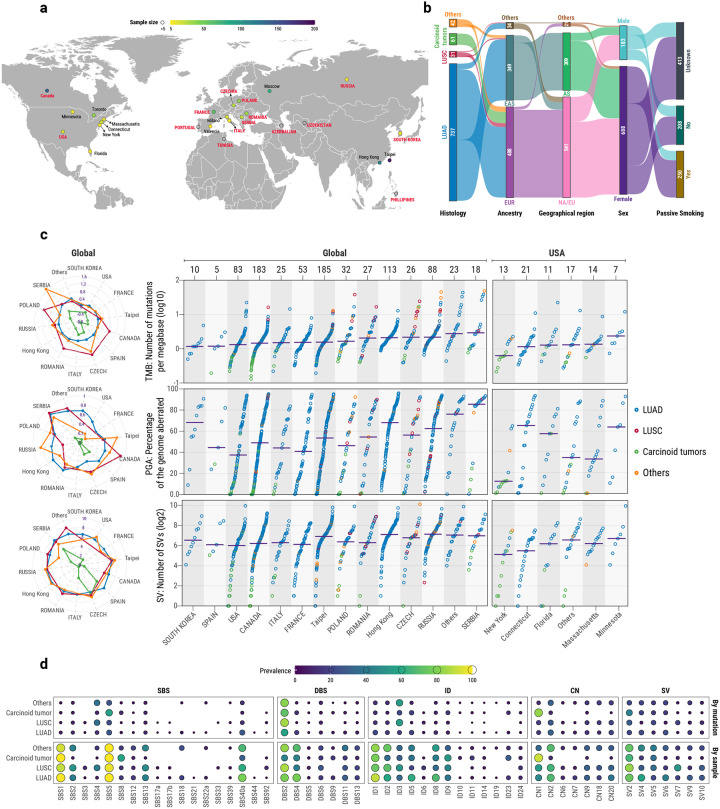
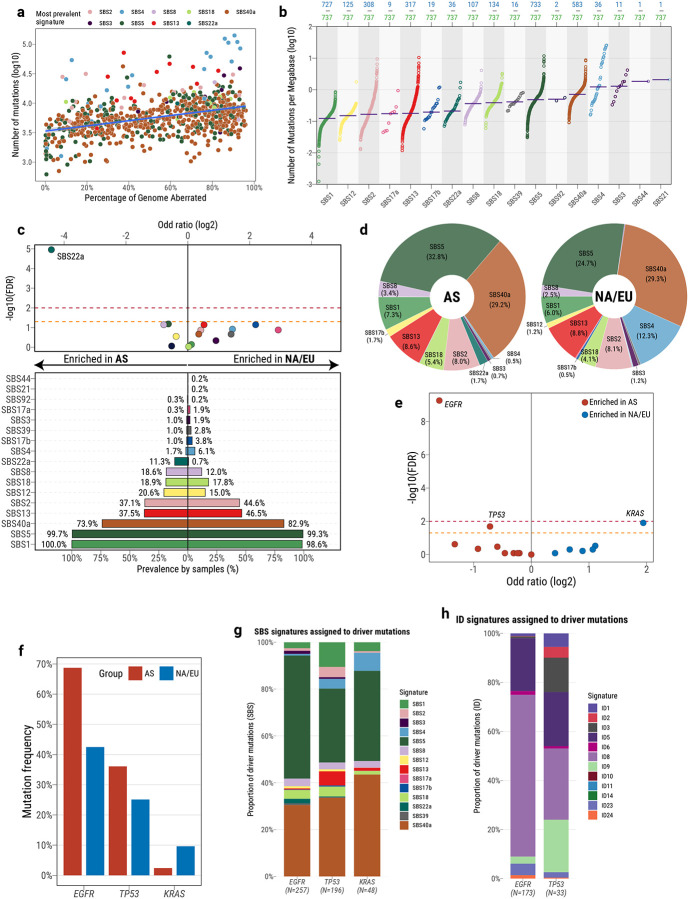
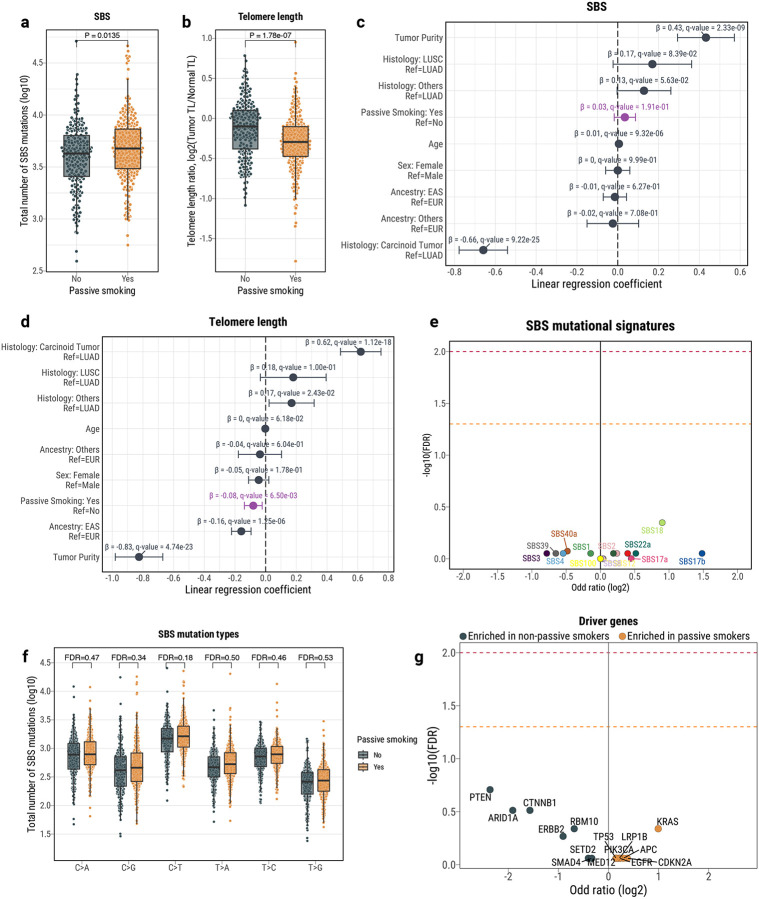
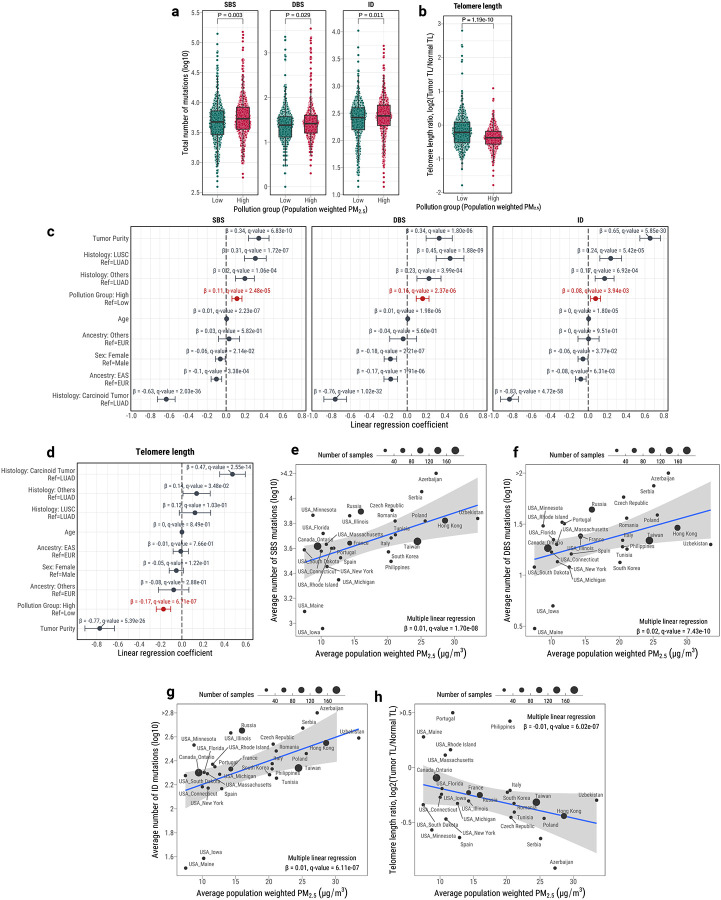
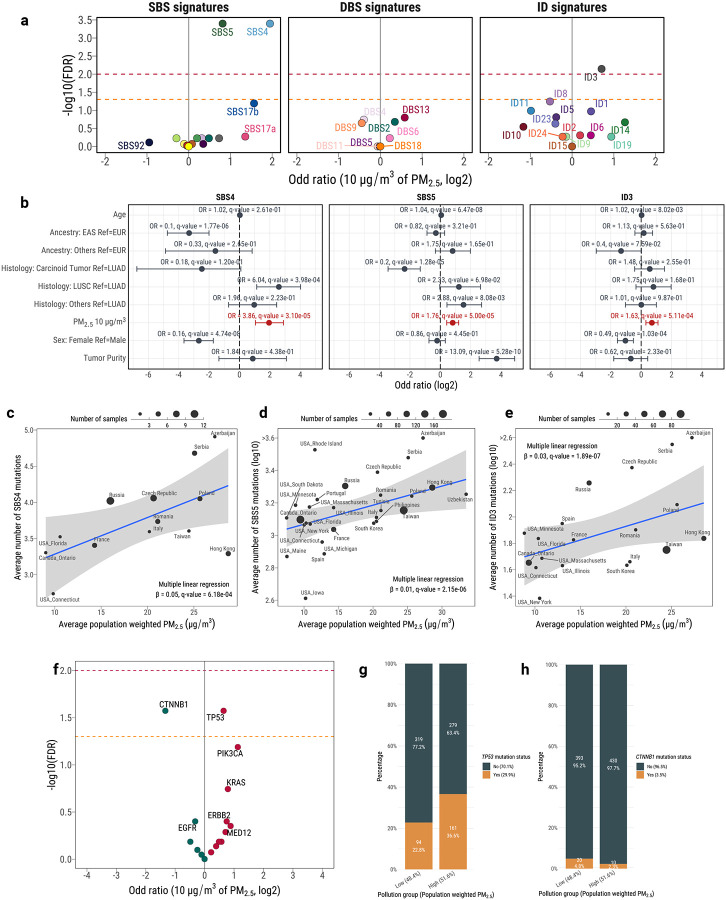
Lung cancer in never smokers (LCINS) accounts for up to 25% of all lung cancers and has been associated with exposure to secondhand tobacco smoke and air pollution in observational studies. Here, we evaluate the mutagenic exposures in LCINS by examining deep whole-genome sequencing data from a large international cohort of 871 treatment-naïve LCINS recruited from 28 geographical locations within the Sherlock-Lung study. KRAS mutations were 3.8-fold more common in adenocarcinomas of never smokers from North America and Europe, while a 1.6-fold higher prevalence of EGFR and TP53 mutations was observed in adenocarcinomas from East Asia. Signature SBS40a, with unknown cause, was found in most samples and accounted for the largest proportion of single base substitutions in adenocarcinomas, being enriched in EGFR-mutated cases. Conversely, the aristolochic acid signature SBS22a was almost exclusively observed in patients from Taipei. Even though LCINS exposed to secondhand smoke had an 8.3% higher mutational burden and 5.4% shorter telomeres, passive smoking was not associated with driver mutations in cancer driver genes or the activities of individual mutational signatures. In contrast, patients from regions with high levels of air pollution were more likely to have TP53 mutations while exhibiting shorter telomeres and an increase in most types of somatic mutations, including a 3.9-fold elevation of signature SBS4 (q-value=3.1 × 10⁻⁵), previously linked mainly to tobacco smoking, and a 76% increase of clock-like signature SBS5 (q-value=5.0 × 10⁻⁵). A positive dose-response effect was observed with air pollution levels, which correlated with both a decrease in telomere length and an elevation in somatic mutations, notably attributed to signatures SBS4 and SBS5. Our results elucidate the diversity of mutational processes shaping the genomic landscape of lung cancer in never smokers.


Conflict of interest statement

COMPETING INTERESTS LBA is a co-founder, CSO, scientific advisory member, and consultant for io9, has equity and receives income. The terms of this arrangement have been reviewed and approved by the University of California, San Diego in accordance with its conflict of interest policies. LBA is also a compensated member of the scientific advisory board of Inocras. LBA’s spouse is an employee of Biotheranostics. ENB and LBA declare U.S. provisional patent application filed with UCSD with serial numbers 63/269,033. LBA also declares U.S. provisional applications filed with UCSD with serial numbers: 63/366,392; 63/289,601; 63/483,237; 63/412,835; and 63/492,348. LBA is also an inventor of a US Patent 10,776,718 for source identification by non-negative matrix factorization. SRY has received consulting fees from AstraZeneca, Sanofi, Amgen, AbbVie, and Sanofi; received speaking fees from AstraZeneca, Medscape, PRIME Education, and Medical Learning Institute. All other authors declare that they have no competing interests.

Figures

Fig. 1.
Fig. 1.. Overview of the Sherlock-Lung cohort of lung cancers in never smokers.
a, Geographical distribution of the 871 patients across four continents and 28 geographic locations. b, Clinical characterization based on histology, genetic ancestry, geographical region, biological sex, and passive smoking status. c, Prevalence of mutations, percentage of genome altered, and structural variants across geographic locations and stratified based on histology. Left panel, dots represent median values for the three genomic alterations individually per country and histology. Right panel, dots represent individual tumors, colors different histology types, and horizontal purple lines median values across all histologies. d, Landscape of mutational signatures across histologies and somatic variant classes, including single base substitutions (SBS), doublet base substitutions (DBS), small insertions and deletions (ID), copy number alterations (CN), and structural variants (SV). The size and color of the dots represent the percentage of mutations contributed by the signature in all samples sharing the same histology (top panel) or the percentage of samples of a histological type where a particular signature is active (bottom panel). AS: East Asian geographical regions, EAS: East Asian genetic ancestry super-sample, EUR: European genetic ancestry super-sample, LUAD: lung adenocarcinomas, LUSC: lung squamous cell carcinomas, NA/EU: North America and Europe geographical regions.
Fig. 2
Fig. 2. Repertoire of mutational signatures and driver mutations in LCINS adenocarcinomas.
a, Distribution of the most prevalent signatures per sample according to the number of single base substitutions (SBS) and percentage of genome aberrated. b, Activity of SBS mutational signatures across samples, representing the total number of mutations attributed to each signature in a given sample. Dots represent individual samples and purple horizontal bars median values. The numbers on the bottom indicate the total number of samples where a particular signature was found active (blue) and the total number of LCINS adenocarcinoma samples (green). c, Regional differences across signatures. Volcano plot indicating enrichment of SBS signatures in patients from East Asian (AS) and North American/European regions (NA/EU) in LCINS adenocarcinomas (top panel) and bar plot indicating prevalence by geographical region (bottom panel). Horizontal lines marking statistically significant thresholds were included at 0.05 (dashed orange line) and 0.01 FDR levels (dashed red line). d, Total number of mutations assigned to specific SBS signatures for patients from East Asia or North America and Europe. e, Volcano plot indicating enrichment of mutations in driver genes affecting specific LCINS adenocarcinomas. Blue-colored genes were enriched in patients from North America and Europe, whereas red-colored genes were enriched in patients from East Asia. f, Frequency of LCINS adenocarcinoma cases harboring driver mutations in the driver genes significantly differently mutated between geographical regions (EGFR, TP53, and KRAS) g, Proportion of driver mutations affecting EGFR, TP53, and KRAS probabilistically assigned to each of the SBS mutational signatures identified in the LCINS adenocarcinoma cohort. The numbers indicate the total number of driver single base substitutions found in each of the genes.
Fig. 3.
Fig. 3.. Passive smoking influence in the genomic landscape of LCINS.
a-d, Differences in base substitution burden and tumor-to-normal telomere length ratio using univariate comparisons (a and b) as well as multivariable linear regressions considering clinical and epidemiological covariates (c and d), including age, sex, genetic ancestry, histology, and tumor purity. e, Volcano plot indicating enrichment of mutational signatures derived from SBS mutations in passive vs. non-passive smokers. Horizontal lines marking statistically significant thresholds were included at 0.05 (dashed orange line) and 0.01 FDR levels (dashed red line). f, Comparison of the mutations belonging to each of the six main SBS mutation subtypes in passive vs. non-passive smokers. g, Volcano plot indicating enrichment of mutations in driver genes affecting specific LCINS tumors.
Fig. 4.
Fig. 4.. Mutagenic effects of PM2.5 exposure in LCINS.
a, Quantification of tumor mutational burden according to different mutation types, including SBS, DBS, and ID, for patients living in geographical regions with high and low PM2.5 exposure levels (threshold defined at 20 μg/m3; only samples for which the country of origin was known (n=853) are included). b, Quantification of the ratio of telomere lengths for tumor and normal samples across high and low PM2.5 exposed cases. c-d, Forest plots corresponding to multivariable linear regressions considering high/low PM2.5 exposure group, age, sex, genetic ancestry, histology, and tumor sample purity as covariates and tumor mutational burden for the specific mutation type, SBS, DBS, ID (c), or telomere length ratio (d) as independent variables. e-h, Scatter plots showing significant correlations between individual sample estimates of PM2.5 exposure and tumor mutational burden for SBS (e), DBS (f), ID (g), and telomere length ratio (h).
Fig. 5.
Fig. 5.. Associations between PM2.5 exposure and specific mutational signatures affecting LCINS tumors.
a, Enrichment analysis of the presence of mutational signatures derived from SBS, DBS, and ID with PM2.5 exposure levels for all samples for which the country of origin was known (n=853). Horizontal lines marking statistically significant thresholds were included at 0.05 (dashed orange line) and 0.01 FDR levels (dashed red line). The odds ratios for the increase/decrease of 10 μg/m3 of PM2.5 estimates are shown. b, Detailed forest plots for the logistic regression models corresponding to signatures SBS4, SBS5, and ID3. c-e, Scatter plots assessing dose-response effect between individual sample estimates of PM2.5 exposure and mutations assigned to signatures SBS4 (c), SBS5 (d), and ID3 (e). f, Enrichment analysis of the presence of mutations in driver genes with PM2.5 exposure levels. g-h, Detail of the enrichment of TP53 (g) and CTNNB1 (h) driver mutations in high and low pollution regions, respectively.

References

    1. Proctor R. N. Tobacco and the global lung cancer epidemic. Nature Reviews Cancer 1, 82–86 (2001). 10.1038/35094091 - DOI - PubMed
    1. Sun S., Schiller J. H. & Gazdar A. F. Lung cancer in never smokers — a different disease. Nature Reviews Cancer 7, 778–790 (2007). 10.1038/nrc2190 - DOI - PubMed
    1. Sung H. et al. Global Cancer Statistics 2020: GLOBOCAN Estimates of Incidence and Mortality Worldwide for 36 Cancers in 185 Countries. CA Cancer J Clin 71, 209–249 (2021). 10.3322/caac.21660 - DOI - PubMed
    1. Siegel D. A., Fedewa S. A., Henley S. J., Pollack L. A. & Jemal A. Proportion of Never Smokers Among Men and Women With Lung Cancer in 7 US States. JAMA Oncol 7, 302–304 (2021). 10.1001/jamaoncol.2020.6362 - DOI - PMC - PubMed
    1. Lui N. S. et al. Sub-solid lung adenocarcinoma in Asian versus Caucasian patients: different biology but similar outcomes. J Thorac Dis 12, 2161–2171 (2020). 10.21037/jtd.2020.04.37 - DOI - PMC - PubMed

Publication types