

This is a preprint.
Genome-wide association studies in a large Korean cohort identify novel quantitative trait loci for 36 traits and illuminate their genetic architectures
- PMID: 38798434
- PMCID: PMC11118625
- DOI: 10.1101/2024.05.17.24307550
Genome-wide association studies in a large Korean cohort identify novel quantitative trait loci for 36 traits and illuminate their genetic architectures
Update in
-
Genome-wide association studies in a large Korean cohort identify quantitative trait loci for 36 traits and illuminate their genetic architectures.Nat Commun. 2025 May 28;16(1):4935. doi: 10.1038/s41467-025-59950-5. Nat Commun. 2025. PMID: 40436827 Free PMC article.
Abstract
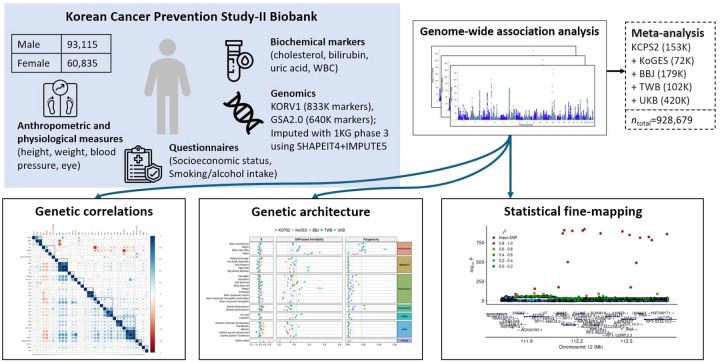
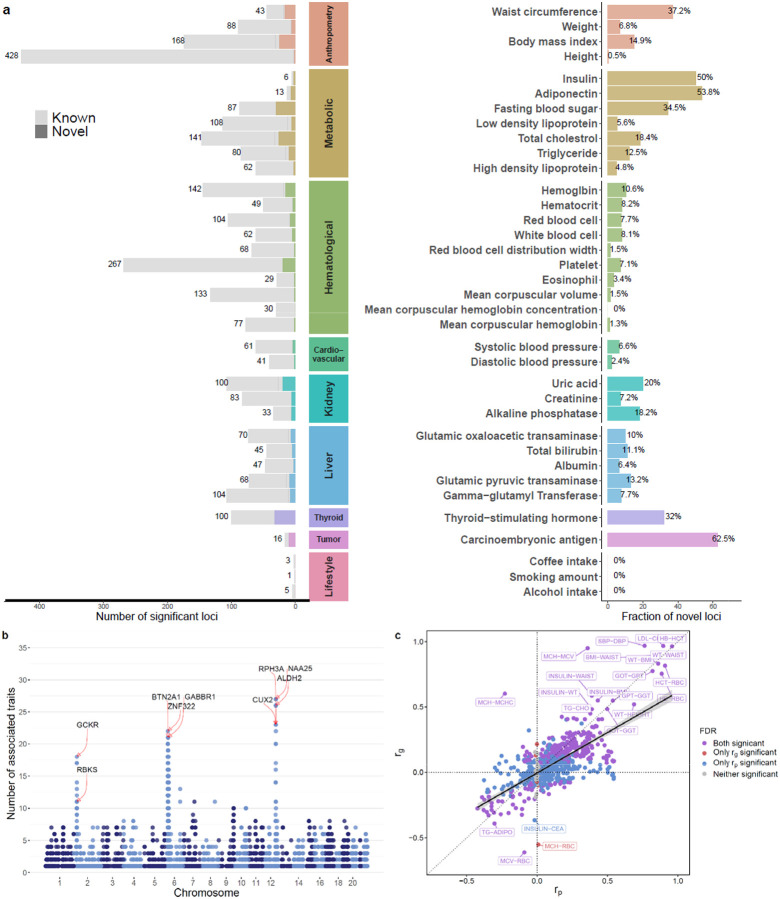
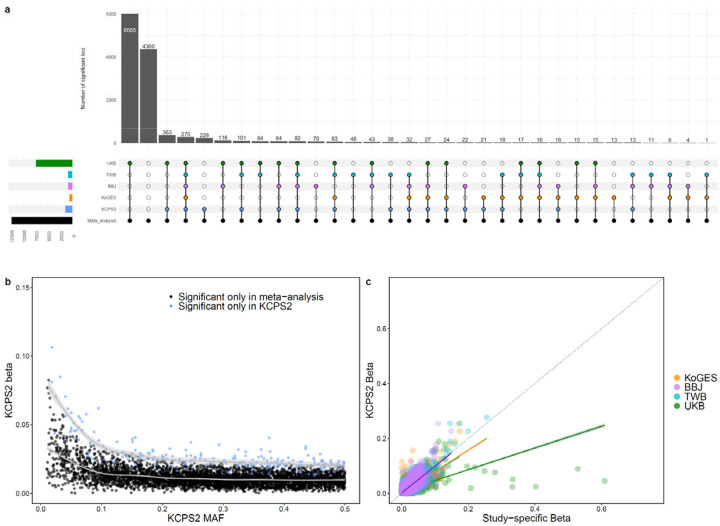
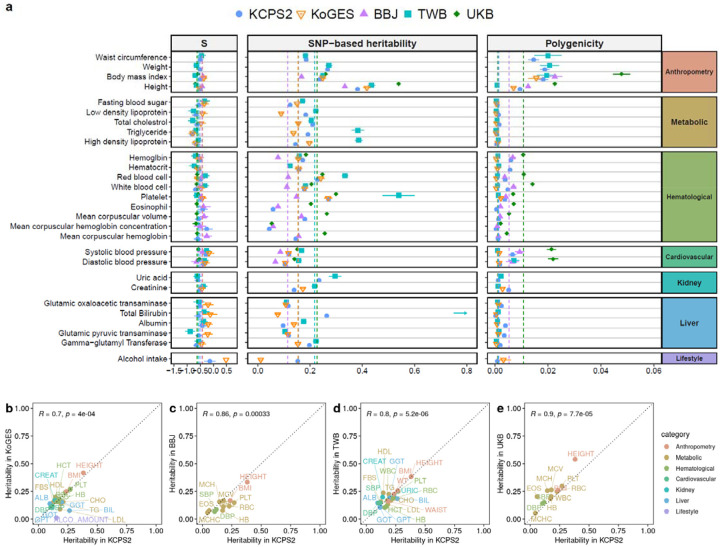
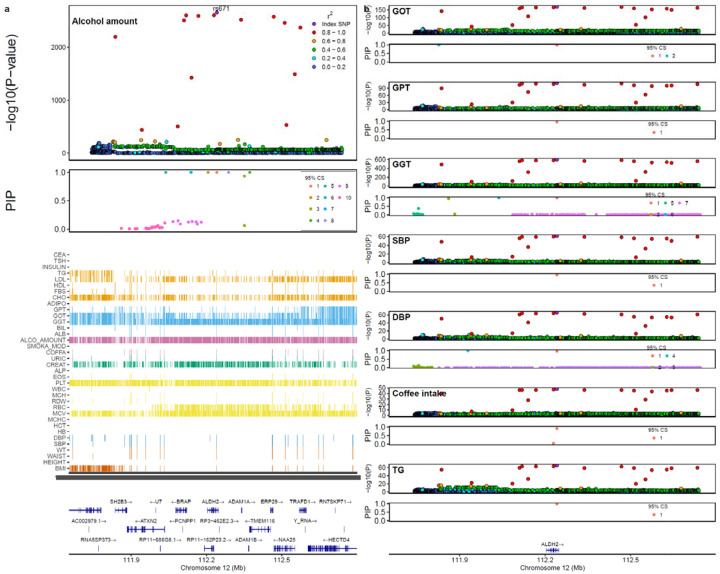
Genome-wide association studies (GWAS) have been predominantly conducted in populations of European ancestry, limiting opportunities for biological discovery in diverse populations. We report GWAS findings from 153,950 individuals across 36 quantitative traits in the Korean Cancer Prevention Study-II (KCPS2) Biobank. We discovered 301 novel genetic loci in KCPS2, including an association between thyroid-stimulating hormone and CD36. Meta-analysis with the Korean Genome and Epidemiology Study, Biobank Japan, Taiwan Biobank, and UK Biobank identified 4,588 loci that were not significant in any contributing GWAS. We describe differences in genetic architectures across these East Asian and European samples. We also highlight East Asian specific associations, including a known pleiotropic missense variant in ALDH2, which fine-mapping identified as a likely causal variant for a diverse set of traits. Our findings provide insights into the genetic architecture of complex traits in East Asian populations and highlight how broadening the population diversity of GWAS samples can aid discovery.
Keywords: Korean population; complex traits; genetic architecture; genome-wide association study.
Figures
Similar articles
-
Genome-wide association studies in a large Korean cohort identify quantitative trait loci for 36 traits and illuminate their genetic architectures.Nat Commun. 2025 May 28;16(1):4935. doi: 10.1038/s41467-025-59950-5. Nat Commun. 2025. PMID: 40436827 Free PMC article.
-
Analysis across Taiwan Biobank, Biobank Japan, and UK Biobank identifies hundreds of novel loci for 36 quantitative traits.Cell Genom. 2023 Nov 16;3(12):100436. doi: 10.1016/j.xgen.2023.100436. eCollection 2023 Dec 13. Cell Genom. 2023. PMID: 38116116 Free PMC article.
-
Genome-wide study on 72,298 individuals in Korean biobank data for 76 traits.Cell Genom. 2022 Oct 5;2(10):100189. doi: 10.1016/j.xgen.2022.100189. eCollection 2022 Oct 12. Cell Genom. 2022. PMID: 36777999 Free PMC article.
-
Multi-trait GWAS identifies pleiotropic loci associated with colorectal cancer in East Asian populations.Front Genet. 2025 Apr 15;16:1590652. doi: 10.3389/fgene.2025.1590652. eCollection 2025. Front Genet. 2025. PMID: 40303978 Free PMC article.
-
Interpretation of risk loci from genome-wide association studies of Alzheimer's disease.Lancet Neurol. 2020 Apr;19(4):326-335. doi: 10.1016/S1474-4422(19)30435-1. Epub 2020 Jan 24. Lancet Neurol. 2020. PMID: 31986256 Free PMC article. Review.
References
-
- Tam V, Patel N, Turcotte M, Bossé Y, Paré G, Meyre D. Benefits and limitations of genome-wide association studies. Nat Rev Genet. 2019. Aug;20(8):467–484. - PubMed
-
- Lambert SA, Abraham G, Inouye M. Towards clinical utility of polygenic risk scores. Hum Mol Genet. 2019. Nov 21;28(R2):R133–R142. - PubMed
Publication types
Grants and funding
LinkOut - more resources
Full Text Sources
Miscellaneous