[Preprint]. 2025 Apr 5:2024.05.09.593412.
doi: 10.1101/2024.05.09.593412.

TOR signaling regulates GPCR levels on the plasma membrane and suppresses the Saccharomyces cerevisiae mating pathway

Affiliations

TOR signaling regulates GPCR levels on the plasma membrane and suppresses the Saccharomyces cerevisiae mating pathway

Nicholas R Leclerc et al. bioRxiv. .

Abstract

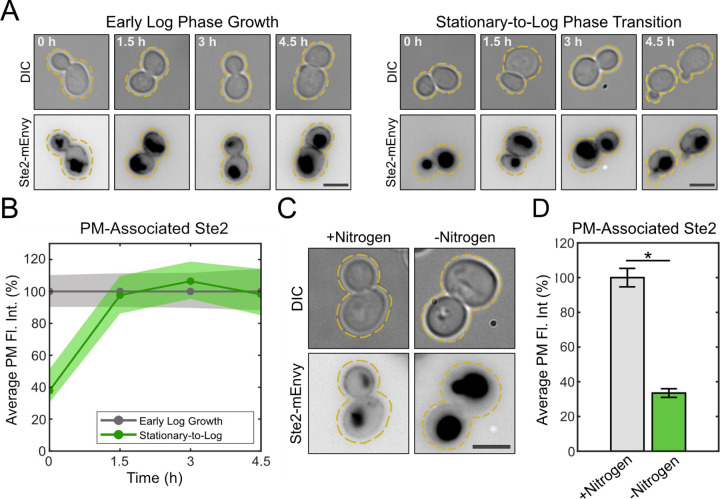
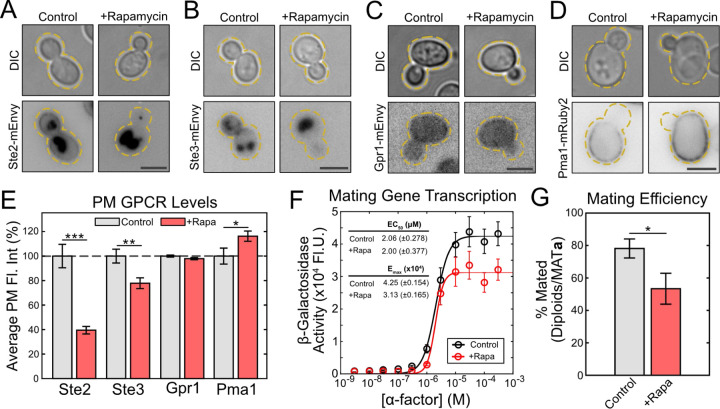
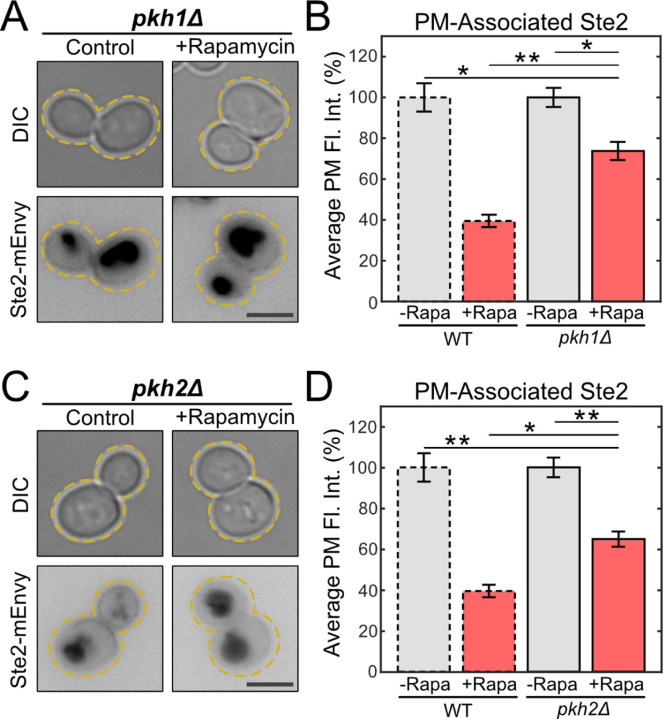
Target of Rapamycin (TOR) complexes and G-protein-coupled receptors (GPCRs) are crucial signaling hubs that coordinate adaptive responses to environmental inputs. While GPCR-mediated regulation of TOR has been extensively studied, little is known about TOR-mediated regulation of GPCRs. Here, we establish TOR as a regulator of GPCR signaling via its control of receptor endocytosis in the yeast mating system. By pairing fluorescence microscopy with yeast genetic approaches, we identify the machinery that bridges TOR nutrient sensing to GPCR internalization. Furthermore, we find that autophagic machinery is employed during mating to deliver active receptor to the vacuole (lysosome), suppressing the mating pathway. These results demonstrate that TOR regulates the localization and signaling of the yeast mating GPCR in both ligand-dependent and -independent contexts. These pathways are highly conserved, suggesting that TOR-regulation of GPCRs may be a broadly conserved mechanism for integrating competing signals involving metabolic state and external communications.


Conflict of interest statement

Competing interests: Authors declare that they have no competing interests.

Figures

Fig. 1.
Fig. 1.. Nutrient availability regulates Ste2 levels at the PM.
(A) Representative images of cells expressing Ste2-mEnvy maintained in the log phase of growth (left panels) (n > 130 cells) or grown to stationary phase and then diluted in replete media (right panels) (n > 90 cells) for 4.5h. Scale bars represent 4μm. (B) Quantification of Ste2-mEnvy mean fluorescent intensity at the plasma membrane every 1.5h either during early log phase growth or growth from stationary phase into replete media. Measurements were normalized to the mean of “Early Log Growth” values at each timepoint to produce percentages. Shaded areas represent 95% bootstrap confidence intervals. (C) Representative images of cells expressing Ste2-mEnvy grown in SCD media (+Nitrogen) (n = 252 cells) or low nitrogen SCD media (−Nitrogen) (n = 568 cells) for 6h. Scale bar represents 4μm. (D) Quantification of Ste2-mEnvy mean fluorescent intensity at the plasma membrane in cells grown in SCD media (+Nitrogen) or low nitrogen SCD media (−Nitrogen) for 6h (n > 250 cells). Measurements were normalized to the mean of the +Nitrogen group to produce percentages. Error bars represent ±SEM. * = p < 0.001 by t-test.
Fig. 2.
Fig. 2.. Inhibition of TORC1 reduces mating GPCR levels at the PM and represses the mating pathway.
(A-D) Representative images of cells expressing (A) Ste2-mEnvy, (B) Ste3-mEnvy, (C) Gpr1-mEnvy, and (D) Pma1-mRuby2 treated with or without 0.2μM rapamycin for 2h. Scale bars represent 4μm. (E) Quantification of Ste2-mEnvy, Ste3-mEnvy, Gpr1-mEnvy, and Pma1-mRuby2 mean fluorescent intensities at the plasma membrane (-Rap: Ste2 n = 212 cells, Ste3 n = 285 cells, Gpr1 n = 197 cells, Pma1 n = 270 cells. +Rap: Ste2 n = 277 cells, Ste3 n =, Gpr1 n = 214 cells, Pma1 n =). Measurements were normalized to the mean of the untreated groups to produce percentages. Error bars represent ±SEM. * = p < 0.05, ** = p < 0.01, *** = p < 0.001. (F) β-galactosidase (pFUS1-LacZ) mating transcription assays of cell cultures pretreated with or without 0.2μM rapamycin for 2h (n > 10 colonies). Error bars represent ±SEM. EC50 and Emax are reported with ±95% confidence intervals. (G) Quantitative mating assays in cells pretreated with or without 0.2μM rapamycin for 2h (n = 5 assays). Error bars represent ±SEM. * = p < 0.05 by t-test.
Fig. 3.
Fig. 3.. TORC1 inhibition leads to CME of Ste2 through α-arrestins and Ypk1.
(A) To identify candidates involved in TORC1-mediated endocytosis, we deleted multiple genes that are involved in TORC signaling, receptor endocytosis, and CME. Casein kinases , α-arrestins ,,,, and epsin-like proteins , are all involved in priming the pheromone receptors for CME during mating. CME utilizes motors and cytoskeletal organizers , to form then endocytic pit that matures into an endosome. During starvation, TORC1 activity is reduced, downregulating PP2A activity . TORC2 activates Ypk1 and Ypk2 ,,, which repress major cell regulators such as Calcineurin . (B) Quantification of mean Ste2-mEnvy on the plasma membrane in the indicated strain, with or without 0.2μM rapamycin for 2h (n > 170 cells). Measurements were normalized to the mean of the untreated groups (not shown) to produce percentages. One-Way ANOVA was used to analyze variance between treated and untreated mutant and WT cells. Tukey’s honest significance test was used as a multiple comparison test to compare means between groups. Based on ANOVA results, genetic mutants treated with rapamycin were grouped into one of three categories: No Rescue (red), Partial Rescue (yellow), and Complete Rescue (green). Mutants in the No Rescue category were only significantly different (p < 0.05) from untreated WT cells. Mutants in the Partial Rescue category were significantly different from both treated and untreated WT cells. Mutants in the Complete Rescue category were only significantly different from rapamycin-treated WT cells. Error bars represent ±SEM. Bars with dashed outlines show data reported in Figure 2E. (C-G) Representative images of (C) WT, (D) end3Δ, (E) rogΔ, (F) rod1Δ, and (G) ypk1Δ cells expressing Ste2-mEnvy treated with or without 0.2μM rapamycin for 2h. Scale bars represent 4μm.
Fig. 4.
Fig. 4.. The C-terminus of Ste2 is required for TORC1-mediated endocytosis.
(A) Representative images of cells expressing Ste2-mEnvy and Ste2T326-EGFP treated with (n = 184 cells) and without (n = 132 cells) 0.2μM rapamycin for 2h. Scale bar represents 4μm. (B) Quantification of Ste2-mEnvy and Ste2T326-EGFP mean fluorescent intensities at the plasma membrane. Measurements were normalized to the mean of the untreated groups to produce percentages. One-Way ANOVA paired with Tukey’s honest significance test was used to compare means between groups. Error bars represent ±SEM. * = p < 0.001. Bars with dashed outlines show data reported in Figure 2E. Scale bars represent 4μm.
Fig. 5.
Fig. 5.. The Ypk1-activators Pkh1 and Pkh2 contribute to TORC1-mediated Ste2 endocytosis.
(A) Representative images of pkh1Δ cells expressing Ste2-mEnvy treated with (n = 186 cells) or without (n = 195 cells) 0.2μM rapamycin for 2h. (B) Quantification of Ste2-mEnvy mean fluorescent intensities at the plasma membrane. Measurements were normalized to the mean of the untreated groups to produce percentages. One-Way ANOVA paired with Tukey’s honest significance test was used to compare means between groups. (C) Representative images of pkh2Δ cells expressing Ste2-mEnvy treated with (n = 135 cells) or without (n = 162 cells) 0.2μM rapamycin for 2h. (D) Quantification of Ste2-mEnvy mean fluorescent intensities at the plasma membrane. Measurements were normalized to the mean of the untreated groups to produce percentages. One-Way ANOVA paired with Tukey’s honest significance test was used to compare means between groups. All error bars represent ±SEM. * = p < 0.01, ** = p < 0.001. All bars with dashed outlines show data reported in Figure 2E. Scale bars represent 4μm.
Fig. 6.
Fig. 6.. TORC2 activity directs TORC1-mediated Ste2 endocytosis.
(A) Representative images of cells expressing Ste2-mEnvy and avo3T1273 treated with (n = 233 cells) and without (n = 139 cells) 0.2μM rapamycin for 2h. (B) Quantification of Ste2-mEnvy mean fluorescent intensities at the plasma membrane. Measurements were normalized to the mean of the untreated groups to produce percentages. One-Way ANOVA paired with Tukey’s honest significance test was used to compare means between groups. (C) Representative images of cells expressing Ste2-mEnvy and avo3T1273 grown in SCD media (+N) (n = 141 cells) or low nitrogen SCD media (−N) (n = 109 cells) for 6h. (D) Quantification of Ste2-mEnvy mean fluorescent intensities at the plasma membrane. Measurements were normalized to the mean of the untreated groups to produce percentages. One-Way ANOVA paired with Tukey’s honest significance test was used to compare means between groups. All error bars represent ±SEM. * = p < 0.05, ** = p < 0.001. All bars with dashed outlines show data reported in Figure 2E. Scale bars represent 4μm.
Fig. 7.
Fig. 7.. Ypk1 dampens mating pathway output.
(A) β-galactosidase (pFUS1-LacZ) mating transcription assays of WT (n = 9 colonies) and ypk1Δ (n = 9 colonies) cultures. Error bars represent ±SEM. (B) Table of EC50 and Emax responses to α-factor. EC50 and Emax are reported with ±95% confidence intervals.
Fig. 8.
Fig. 8.. Pheromone-induced autophagy aids in vacuolar targeting of Ste2 and dampens the mating pathway.
(A) Scheme representing the analysis of Ste2-mEnvy at the vacuolar lumen (Vph1-Tomato) and membrane. We have found that mating cells show two primary phenotypes regarding Ste2 localization to the vacuole. Phenotype 1 shows a cell with a vacuole filled with Ste2-mEnvy, whereas Phenotype 2 shows a empty vacuole, with more receptor at the vacuolar periphery. Linescans were measured through the center of the largest vacuolar body. The mean fluorescent intensity of Ste2-mEnvy was recorded at the peaks of Vph1-Tomato florescence, thereby reporting Ste2 levels at the vacuolar membrane. The mean fluorescent intensity of Ste2-mEnvy between these peaks was reported as Ste2 levels in the vacuolar lumen. The lumen:membrane ratio of Ste2 would then represent the phenotype each cell presents. Cells with Lum:Mem > 1 presented as Phenotype 1 (full), whereas cells with a ratio < 1 presented at Phenotype 2 (empty). (B) Representative images of ATG8 and atg8Δ cells expressing Ste2-mEnvy and Vph1-Tomato treated with 10μM α-factor. Scale bar represents 2μm. (C) Violin plots and pie charts representing the distribution of WT (n = 123 cells) and atg8Δ (n = 172 cells) cells presenting either Phenotype 1 or Phenotype 2 when treated with 10μM α-factor. (D) β-galactosidase (pFUS1-LacZ) mating transcription assays of WT (n = 15 colonies) and atg8Δ cultures (n = 9 colonies). Error bars represent ±SEM. Emax is reported with ±95% confidence intervals.
Fig. 9.
Fig. 9.. Proposed mechanism of TORC1-directed endocytosis.
In nutrient-deprived conditions, TORC1 is repressed, leading to the TORC2-directed activation of Ypk1. Active Ypk1 facilitates α-arrestin-directed CME of Ste2, which ultimately traffics to the vacuole.

Similar articles

References

    1. De Virgilio C., and Loewith R. (2006). The TOR signalling network from yeast to man. Int J Biochem Cell Biol 38, 1476–1481. 10.1016/j.biocel.2006.02.013. - DOI - PubMed
    1. Heitman J., Movva N.R., and Hall M.N. (1991). Targets for cell cycle arrest by the immunosuppressant rapamycin in yeast. Science 253, 905–909. 10.1126/science.1715094. - DOI - PubMed
    1. Kunz J., Henriquez R., Schneider U., Deuter-Reinhard M., Movva N.R., and Hall M.N. (1993). Target of rapamycin in yeast, TOR2, is an essential phosphatidylinositol kinase homolog required for G1 progression. Cell 73, 585–596. 10.1016/0092-8674(93)90144-f. - DOI - PubMed
    1. Brown E.J., Albers M.W., Shin T.B., Ichikawa K., Keith C.T., Lane W.S., and Schreiber S.L. (1994). A mammalian protein targeted by G1-arresting rapamycin-receptor complex. Nature 369, 756–758. 10.1038/369756a0. - DOI - PubMed
    1. Chiu M.I., Katz H., and Berlin V. (1994). RAPT1, a mammalian homolog of yeast Tor, interacts with the FKBP12/rapamycin complex. Proc Natl Acad Sci U S A 91, 12574–12578. 10.1073/pnas.91.26.12574. - DOI - PMC - PubMed

Publication types

LinkOut - more resources