[Preprint]. 2025 Mar 6:2024.05.14.594256.
doi: 10.1101/2024.05.14.594256.

Inhibition of mTORC1 by rapamycin results in feedback activation of AktS473 and aggravates hallmarks of osteoarthritis in female mice and non-human primates

Affiliations

Inhibition of mTORC1 by rapamycin results in feedback activation of AktS473 and aggravates hallmarks of osteoarthritis in female mice and non-human primates

Dennis M Minton et al. bioRxiv. .

Abstract

Purpose: Genetic deletion of mTOR has protected against post-traumatic osteoarthritis (OA) in male mice, however, effects of pharmacological mTOR-inhibition are equivocal and have not been tested in aging models nor in female subjects. Therefore, the goal of this study was to determine if mTOR-inhibition by rapamycin can modify OA pathology in aging non-human primates and female mice.

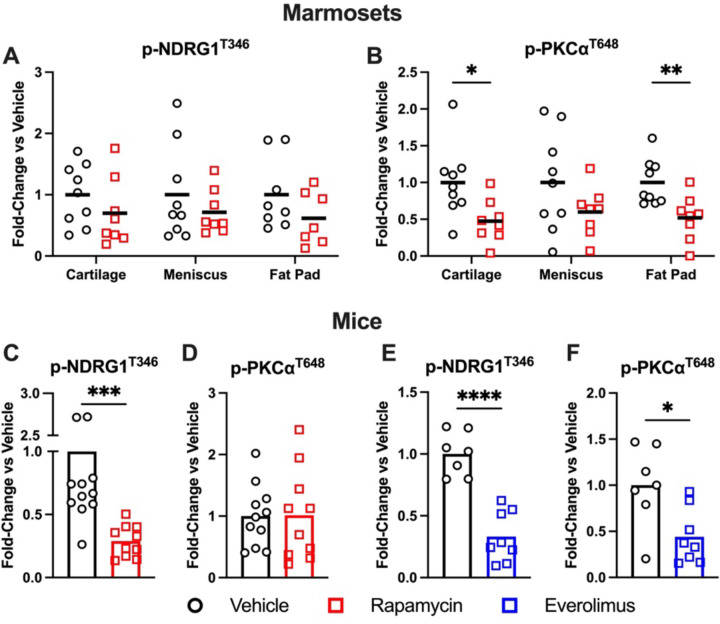
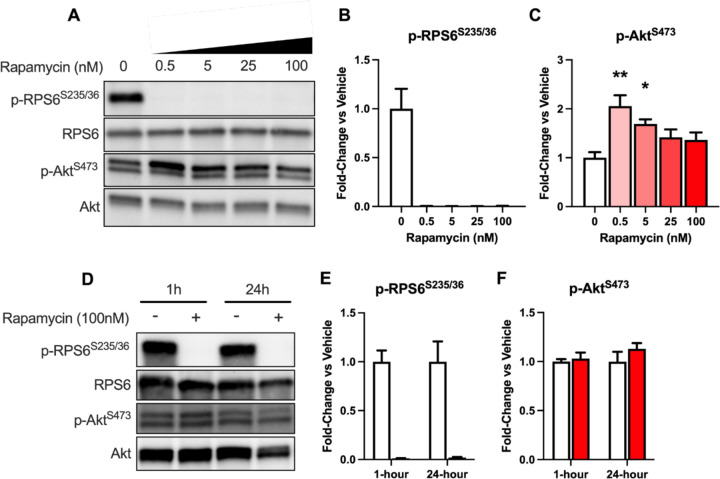
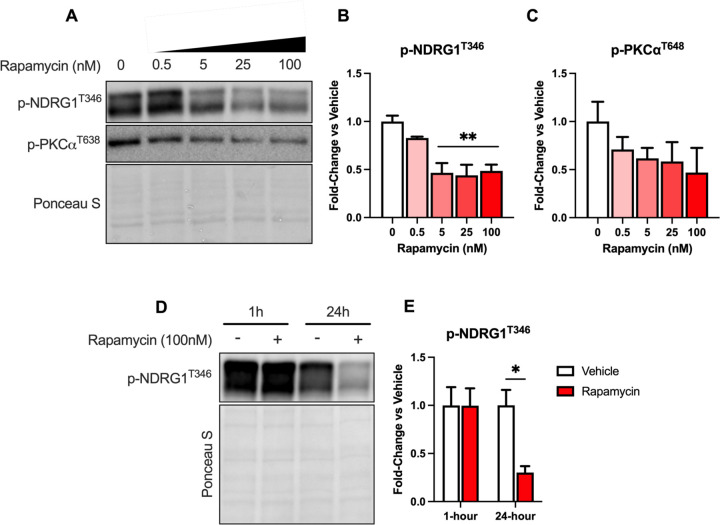
Methods: Common marmosets were administered oral rapamycin (1mg/kg/day) or vehicle starting near mid-life until death. Five-month-old, female C57BL/6J mice were treated with vehicle or rapamycin (IP, 2mg/kg, 3x/week) for 8-weeks following non-invasive ACL rupture. Knee OA pathology was assessed via microCT and histology. Phosphorylation of mTORC1 (p-RPS6S235/36) and mTORC2 (p-AktS473, p-NDRG1T638, p-PKCαT348) substrates were evaluated via western blot in articular cartilage, meniscus, and/or infrapatellar fat pad. ATDC5 cells were cultured with rapamycin to determine time and dose effects on mTORC1/2 signaling.

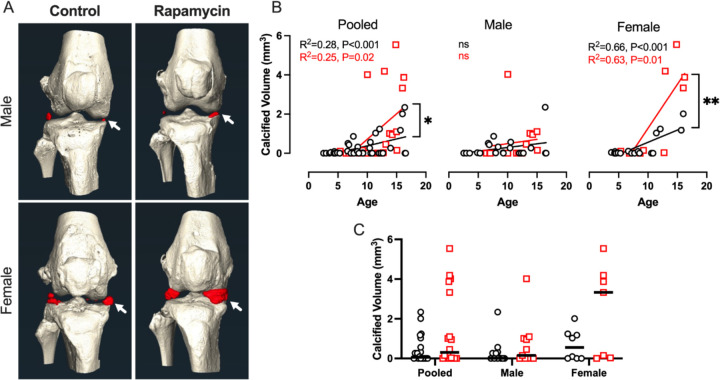
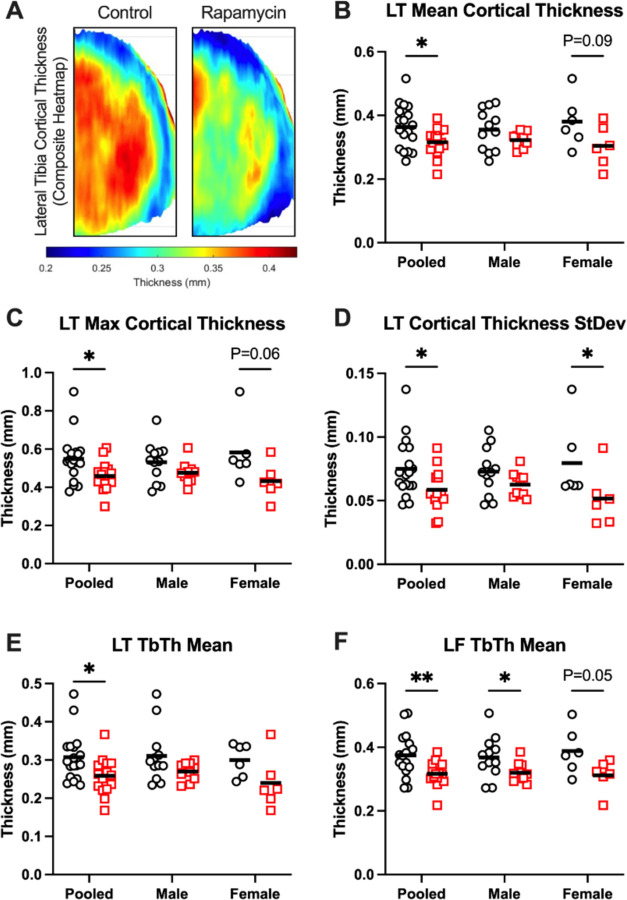
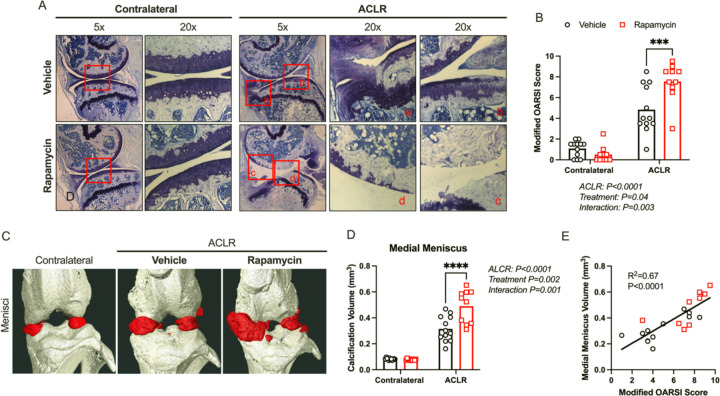
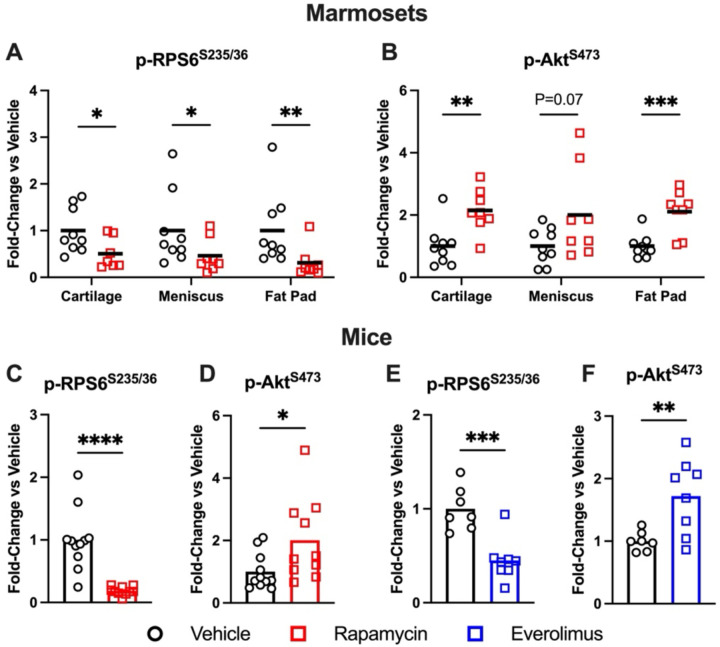
Results: In marmosets, rapamycin did not impact age-related radiographic OA severity or cartilage pathology but increased medial meniscus calcification and lowered lateral tibia subchondral thickness, particularly in females. In female mice, rapamycin worsened ACLR-induced meniscus calcification and cartilage pathology. In marmoset and mouse joint tissues, rapamycin inhibited mTORC1 and increased p-AktS473 but not p-NDRG1T638 or p-PKCαT348. This mTOR signaling pattern was replicated in ATDC5 cells during exposure to low concentrations of rapamycin.

Conclusions: Rapamycin attenuated mTORC1 signaling with feedback activation of AktS473 in articular cartilage, meniscus, and/or infrapatellar fat pad and was accompanied by deleterious effects on meniscus calcification and/or cartilage pathology in female mice and common marmosets.


Conflict of interest statement

Conflicts of Interests DWL has received funding from, and is a scientific advisory board member of, Aeovian Pharmaceuticals, which seeks to develop novel, selective mTOR inhibitors for the treatment of various diseases.

Figures

Figure 1:
Figure 1:. Rapamycin does not attenuate age-related radiographic OA severity in common marmosets.
A) Representative 3D reconstructions of male and female control and rapamycin-treated marmoset knee joints. B) Linear regression of total microCT score against age are shown for control and rapamycin-treated marmosets when pooled and stratified by sex. Linear regression results are shown beneath figures; no trendline differences were found between groups. C) Total microCT scores of geriatric marmosets were compared between treatment groups when pooled and stratified by sex. D) Linear regressions against age of summed whole-joint Modified Mankin scores from control and rapamycin-treated marmosets are shown when pooled and stratified by sex. No trendline differences were found between treatment groups. E) Whole-joint scores of geriatric marmosets were compared between treatment groups when pooled and stratified by sex. F) Linear regressions against age of total Modified Mankin scores from the medial tibia of control and rapamycin-treated marmosets are shown when pooled and stratified by sex. No trendline differences were found between treatment groups. G) Medial tibia scores of geriatric marmosets were compared between treatment groups when pooled and stratified by sex. Data were analyzed via Pearson’s R (B,D,F) or Mann-Whitney tests (C,E,G) and are presented as individual data points with trendlines, median (C), or mean (E,G).
Figure 2:
Figure 2:. Calcification of the medial meniscus in control and rapamycin-treated marmosets.
A) 3D microCT reconstructions representative of median values of medial meniscus calcification for geriatric male and female control and rapamycin-treated marmosets. Meniscus calcification is highlighted in red, and the medial meniscus is denoted with a white arrow. B) Linear regressions between age and medial meniscus calcification volume are shown for pooled and stratified sexes. Linear regression results and differences between trendlines are shown within each graph, when significant. C) Pairwise comparisons were performed between geriatric control and rapamycin-treated marmosets when pooled and stratified by sex. Are presented as trendlines or median with individual data points and were analyzed by linear regression (B) or Mann-Whitney tests (C).
Figure 3:
Figure 3:. Subchondral bone architecture is altered by rapamycin treatment.
A) Composite cortical thickness heatmaps from control and Rapamycin-treated marmosets, scale bar beneath. B) Mean, C) max, and D) standard deviation of lateral tibia cortical bone thickness were all lower in Rapamycin-treated marmosets than controls. E) Trabecular thickness in the lateral tibia and F) lateral femur were also lower in Rapamycin-treated marmosets than controls. L=lateral, T=tibia, F=femur. Data are presented both pooled and stratified by sex. Treatment effects were assessed by unpaired t-tests or Mann-Whitney tests, depending on normality of data. Data are shown as mean with individual data points. *P<0.05, **P<0.01
Figure 4:
Figure 4:. Increased ACLR-induced cartilage degeneration and meniscus calcification in rapamycin-treated mice.
A) Representative toluidine-blue stained histology images from the medial compartment of contralateral and ACLR limbs of vehicle and rapamycin-treated mice. B) Images were quantified using the Modified OARSI scoring system tailored to the ACLR OA model. C) 3D reconstructions of microCT scans representative of a median contralateral limb and ACLR limbs from vehicle and rapamycin-treated mice. Regions of calcified meniscus are highlighted in red. D) Quantified meniscus calcification volumes from contralateral and ACLR knees. E) Linear regression between Modified OARSI scores and medial meniscus calcification volumes. Data are presented as mean with individual data points and were analyzed using 2-way repeated measures ANOVA with Sidak’s multiple comparison test, with ANOVA effects reported on each figure panel. N=10–12 per group, ***P<0.001, ****P<0.0001.
Figure 5:
Figure 5:. Treatment with mTOR-inhibitors increases signal through p-AktS473 in marmoset and mouse joint tissues.
A) Densitometric analysis of p-RPS6S235/236 normalized to total RPS6 and B) p-AktS473 normalized to total Akt from control and rapamycin-treated marmoset articular cartilage, meniscus, infrapatellar fat pad. C) Densitometric analysis of p-RPS6S235/36 normalized to total RPS6 and D) p-AktS473 normalized to total Akt from glenohumeral cartilage of female mice treated with rapamycin (2mg/kg, 3x/week) or vehicle for 8-weeks. E) Densitometric analysis of p-RPS6S235/236 normalized to total RPS6 and F) p-AktS473 normalized to total Akt from glenohumeral cartilage of male mice treated with everolimus (3mg/kg every other day) or vehicle for 5-weeks. N=7–9/group (A-B), 10–12/group (C-D), or 7–8/group (E-F). Data are shown as mean with individual data points and were analyzed by student’s t-test. *P<0.05, **P<0.01, ***P<0.001, ****P<0.0001.
Figure 6:
Figure 6:. Alternative mTORC2 substrates are inhibited or unaffected during rapamycin treatment.
A) Densitometric analysis of p-NDRG1T346 and B) p-PKCαT638 normalized to Ponceau S from control and rapamycin-treated marmoset articular cartilage, meniscus, and infra-patellar fat pad. C) Densitometric analysis of p-NDRG1T346 and D) p-PKCαT638 normalized to Ponceau S from glenohumeral cartilage of female C57BL/6J mice treated with rapamycin (2mg/kg, 3x/week) or vehicle for 8-weeks. E) Densitometric analysis of p-NDRG1T346 and F) p-PKCαT638 normalized to Ponceau S from glenohumeral cartilage of male mice treated with everolimus (3mg/kg every other day) or vehicle for 5-weeks. N=7–9/group (A-B), 10–12/group (C-D), or 7–8/group (E-F). Data are shown as mean with individual data points and were analyzed by student’s t-test. *P<0.05, **P<0.01, ***P<0.001, ****P<0.0001.
Figure 7:
Figure 7:. Low concentrations of rapamycin increased p-AktS473 in ATDC5 cells.
A) Representative western blots from ATDC5 cells treated with increasing doses of rapamycin for 24-hours. B) Densitometric quantification of p-RPS6S235/236 /total and C) p-AktS473 /total. Data were analyzed via one-way ANOVA with Holm-Sidak’s multiple comparison test (B, C). *P<0.05, **P<0.01 vs. 0 nM rapamycin. D) Representative western blots from ATDC5 cells treated with 100nM rapamycin or DMSO vehicle for 1- or 24-hours. E) Densitometric quantification of p-RPS6S235/236 /total and F) p-AktS473 /total. Data were analyzed using multiple t-tests (E-F). All data are presented as mean±SEM. N=3/group.
Figure 8:
Figure 8:. High doses of rapamycin and prolonged exposure decrease mTORC2 substrate phosphorylation.
A) Representative western blots from ATDC5 cells treated with increasing doses of rapamycin for 24-hours. B) Densitometric quantification of p-NDRG1T346 /Ponceau S and C) p-T638-PKCα/total. Data were analyzed using one-way ANOVA with Holm-Sidak’s multiple comparison test (B-C). **P<0.01 vs. 0 nM rapamycin. D) Representative western blots from ATDC5 cells treated with 100nM rapamycin or DMSO vehicle for 1- or 24-hours. E) Densitometric quantification of p-NDRG1T346 /Ponceau S. *P<0.05 vs. vehicle. Data were analyzed using multiple t-tests. All data are presented as mean±SEM. N=3/group.

Similar articles

References

    1. Dell’Isola A, Recenti F, Englund M, Kiadaliri A. Twenty-year trajectories of morbidity in individuals with and without osteoarthritis. RMD Open. 2024. Jul 2;10(2):e004164. - PMC - PubMed
    1. Mannick JB, Lamming DW. Targeting the biology of aging with mTOR inhibitors. Nat Aging. 2023. Jun;3(6):642–60. - PMC - PubMed
    1. Simcox J, Lamming DW. The central moTOR of metabolism. Dev Cell. 2022. Mar 28;57(6):691–706. - PMC - PubMed
    1. Takayama K, Kawakami Y, Kobayashi M, Greco N, Cummins JH, Matsushita T, et al. Local intra-articular injection of rapamycin delays articular cartilage degeneration in a murine model of osteoarthritis. Arthritis Research & Therapy. 2014. Nov 17;16(6):482. - PMC - PubMed
    1. Xie J, Lin J, Wei M, Teng Y, He Q, Yang G, et al. Sustained Akt signaling in articular chondrocytes causes osteoarthritis via oxidative stress-induced senescence in mice. Bone Res. 2019. Aug 5;7(1):1–9. - PMC - PubMed

Publication types