[Preprint]. 2024 May 13:rs.3.rs-4220532.
doi: 10.21203/rs.3.rs-4220532/v1.

Gut commensals require Peyer's patches to induce protective systemic IgA responses

Affiliations

Gut commensals require Peyer's patches to induce protective systemic IgA responses

Joshua R Harris et al. Res Sq. .

Abstract

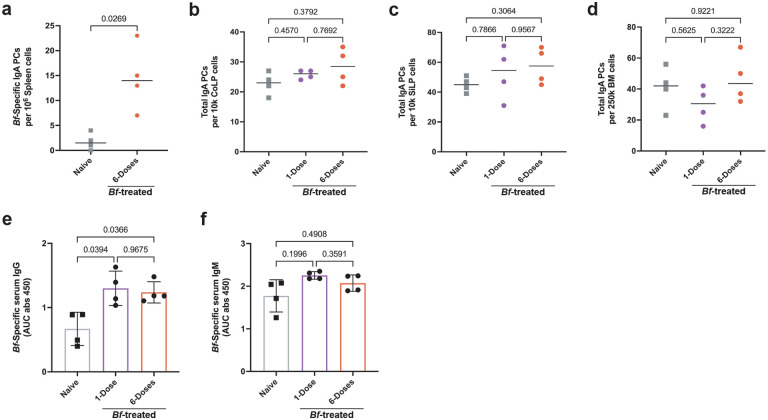
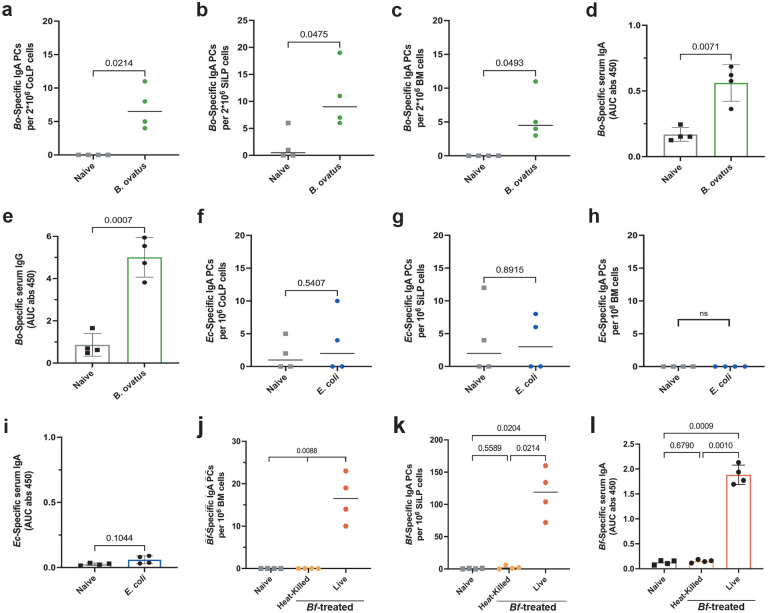
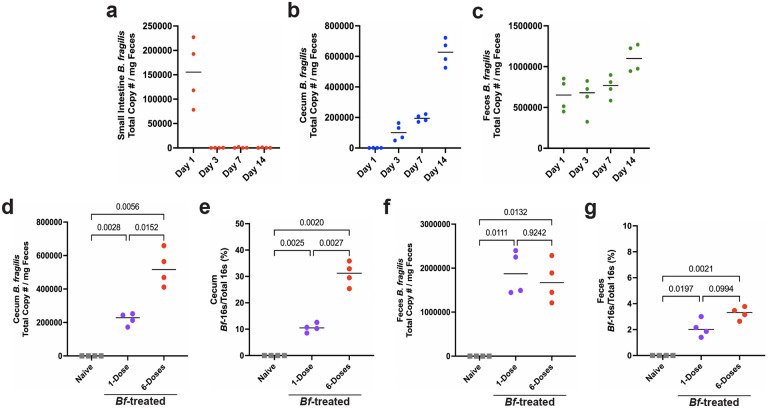
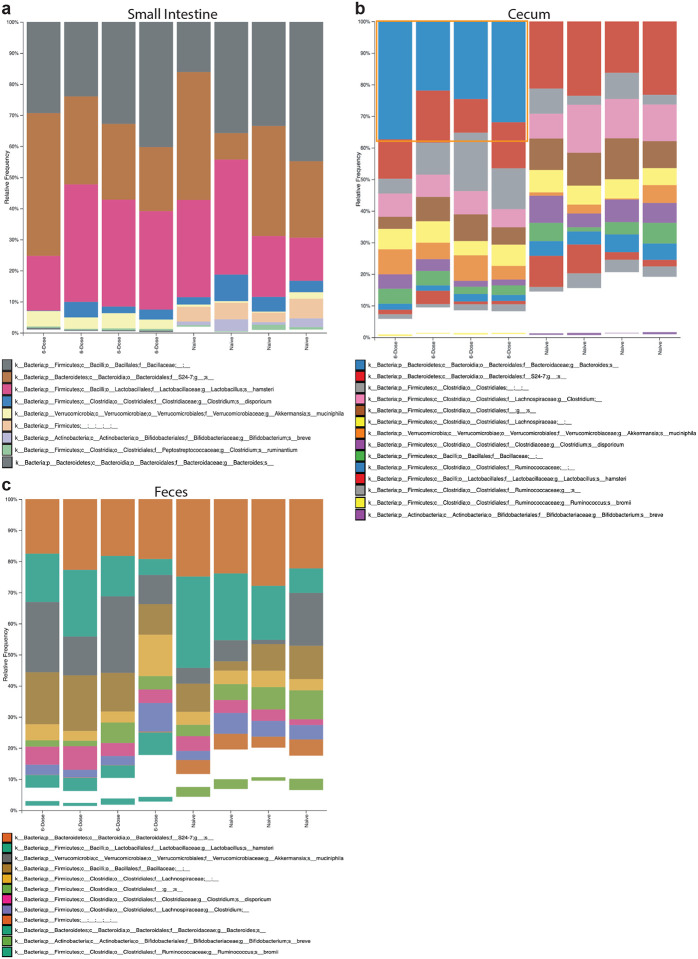
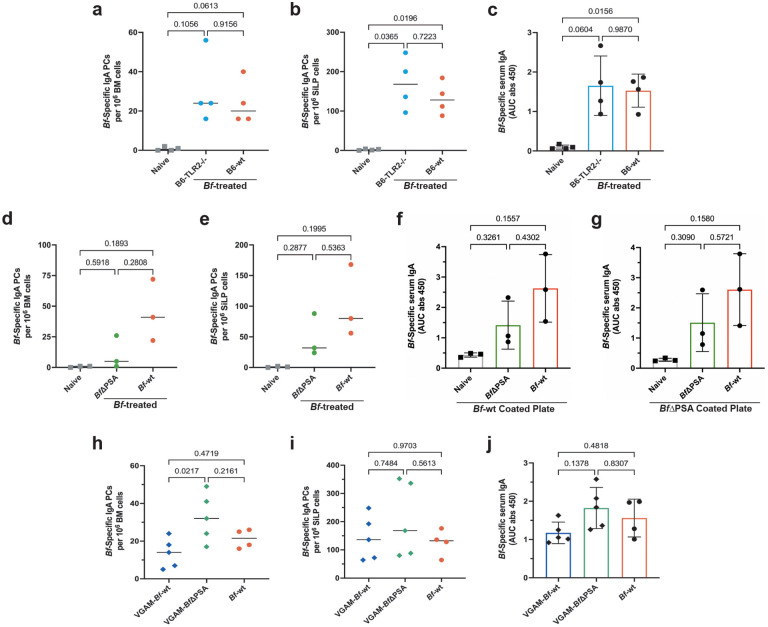
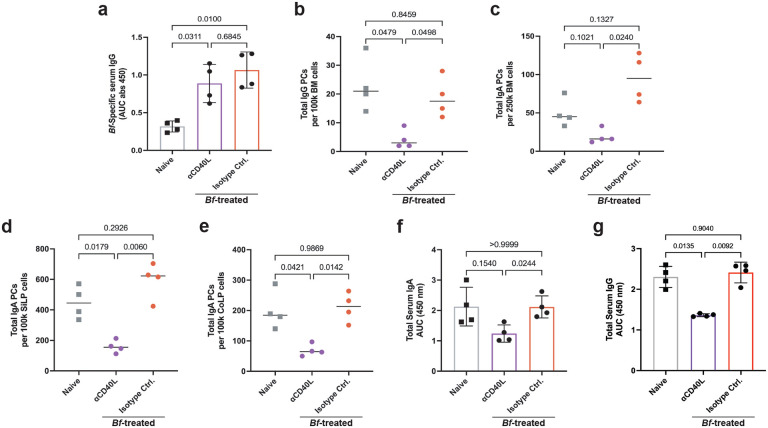
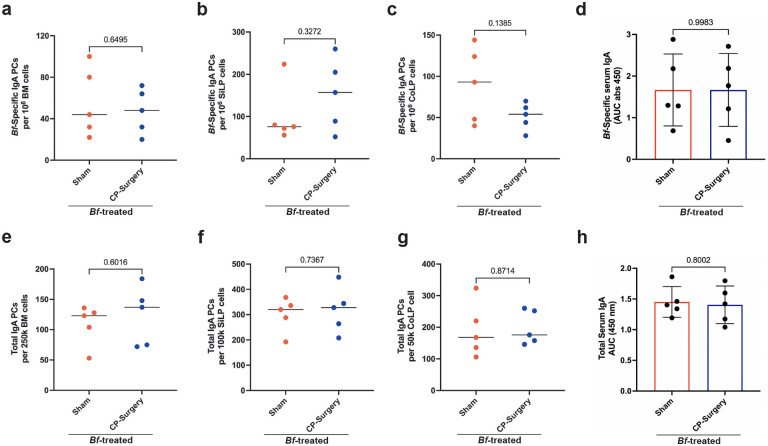
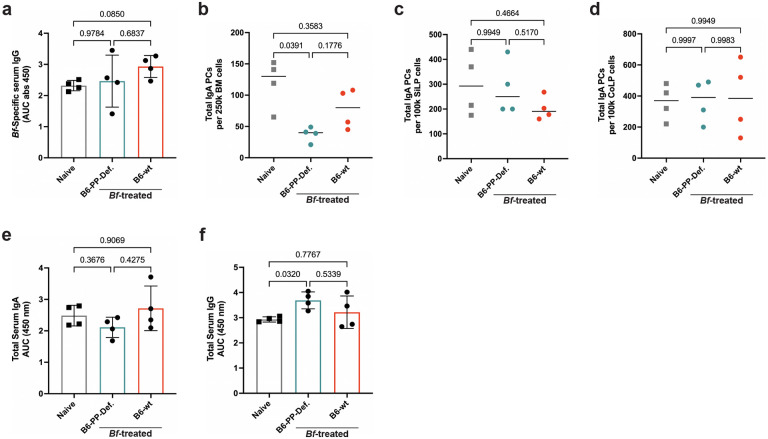
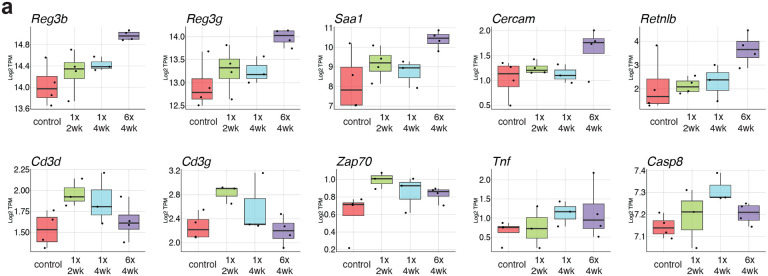
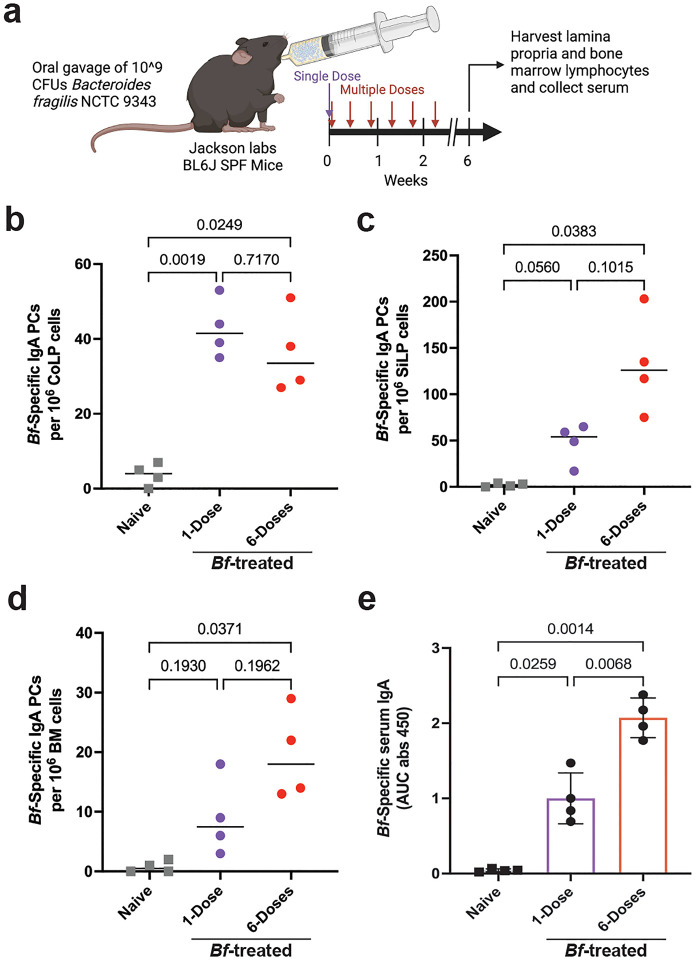
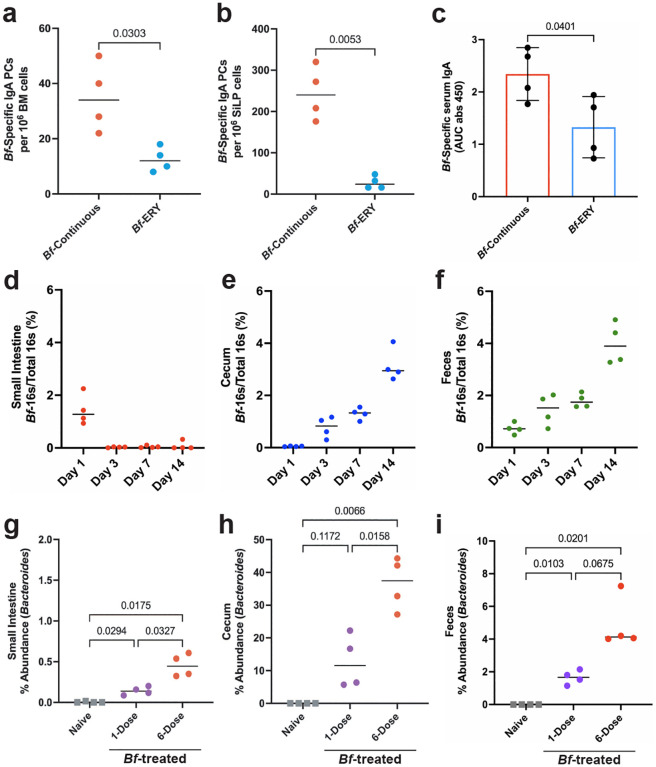
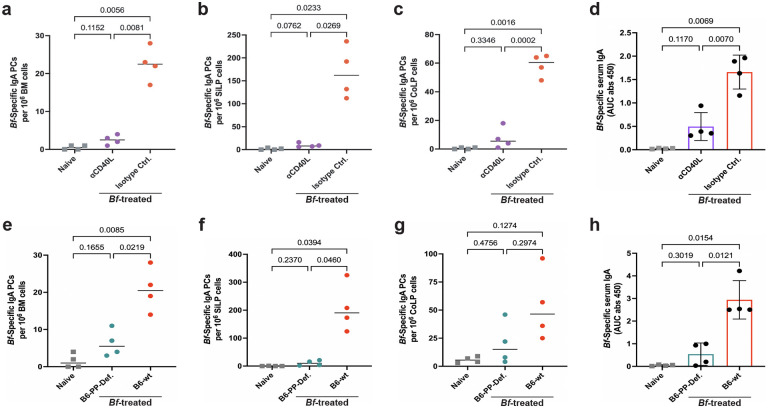
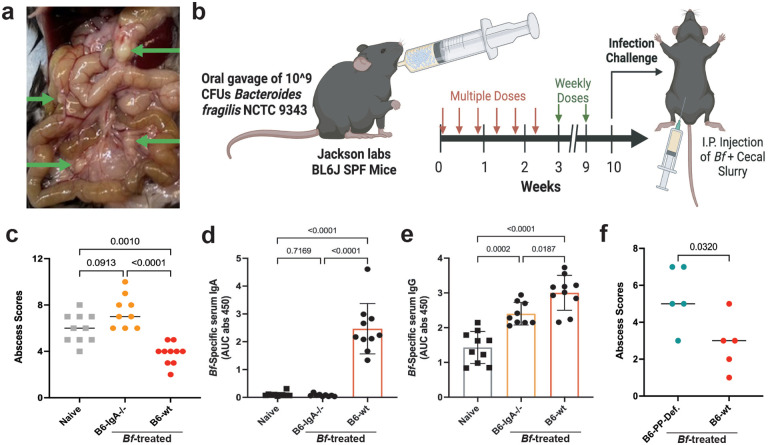
Gut educated IgA secreting plasma cells that disseminate beyond the mucosa and into systemic tissues have been described as providing beneficial effects from disease in several contexts. Several bacteria have been implicated in the induction of systemic IgA, however the mechanisms that result in differential levels of induction by each bacterial species are still unknown. Here we show, the commensal bacteria, Bacteroides fragilis (Bf), is an efficient inducer of systemic IgA responses. The ability of Bf to induce the production of bone marrow IgA plasma cells and high levels of serum IgA relied on high levels of gut colonization in a dose-dependent manner. Colonization induced Bf-specific IgA responses were severely diminished in the absence of Peyer's patches, but not the murine cecal patch. Colonization of mice with Bf, a natural human commensal, resulted in few changes within the microbiome and the host transcriptional profile in the gut, suggesting a commensal relationship with the host. Bf colonization did benefit the mice by inducing systemic IgA that led to increased protection in a bowel perforation model resulting in lower peritoneal abscess formation. These findings demonstrate a critical role for bacterial colonization and Peyer's patches in the induction of robust systemic IgA responses that confer protection from bacterial dissemination outside of the gut.


Conflict of interest statement

Competing Interests The authors declare no competing interests.

Figures

Extended Data Fig. 1.
Extended Data Fig. 1.. Bf-Systemic IgA induction does not alter total IgA levels.
a, Detection of Bf-specific IgA plasma cells in the spleen in 6-dose treated mice as determined by ELISpot using plates pre-coated in Bf-antigen. b,c,d, ELISpot assays to determine total IgA plasma cell populations in colonic (b) and small intestinal (c) lamina propria and bone marrow (d) using ELISpot plates pre-coated with anti-Ig(H&L) and developed using anti-IgA-specific antibodies. e,f, Serum ELISA determined the level of Bf-specific IgG (e) and IgM (f) in Bf-treated mice 6-weeks after initial dose. For serum ELISA, the area under the curve (AUC) was calculated based on the absorbance at 450 nm from each serially diluted sample. Statistical analysis was performed using students t-test with Welch’s correction (a) or one-way analysis of variance (ANOVA) with Turkey multiple-comparison test (b-f). Exact P values are shown.
Extended Data Fig. 2.
Extended Data Fig. 2.. Treatment with live B. fragilis leads to robust IgA induction compared to other bacterial species.
a,b,c, ELISPot assays of B. ovatus-specific IgA plasma cell induction from colon (a), small intestine (b), and bone marrow (c) of naïve and 6-dose treated mice. d,e, Serum ELISA determined the level of Bo-specific IgA (d) and IgG (e) from naive and 6-dose treated mice. f,g,h, ELISpot assays determined the frequency of E. coli K-12 specific IgA plasma cell populations in the colon following multi-dose treatment (f), small intestine (g), and bone marrow (h). i, Serum ELISA determined the level of Ec-specific IgA from naive and 6-dose treated mice. j,k, B6-SPF mice were given 6-doses of live or heat killed B. fragilis then bone marrow (j) and small intestine (k) IgA plasma cells were assayed with ELISpot to determine specificity to Bf. l, Serum ELISA was performed to detect induction of Bf-IgA in mice treated with heat-killed Bf. ELISpot and ELISA plates were pre-coated with heat-killed B. ovatus, E. coli, or B. fragilis and responses were assayed 6-weeks after initial treatment. For all experiments shown, n=4 mice in each cohort. For serum ELISA, the area under the curve (AUC) was calculated based on the absorbance at 450 nm from each serially diluted sample. Statistical analysis was performed using students t-test with Welch’s correction (a-i) or one-way analysis of variance (ANOVA) with Turkey multiple-comparison test (j-l). Exact P values are shown. Data are representative of three independent experiments.
Extended Data Fig. 3.
Extended Data Fig. 3.. Bacteroides fragilis primarily colonizes the cecum and colon of Jax-SPF mice.
a-c, qPCR analysis of Bf colonization following single-dose B6-SPF mice determined absolute copy number of Bf in the small intestine (a), cecum (b), and feces (c) 1-, 3-, 7-, and 14-days post-treatment. d-e, qPCR determination of Bf absolute copy number (d) and relative abundance (e) in cecum following single- and multi-dose treatment 6-weeks after initial dose. f-g, qPCR determination of Bf absolute copy number (f) and relative abundance (g) in feces following single- and multi-dose treatment 6-weeks after initial dose. Data representative of two independent experiments (n=4 mice per group).
Extended Data Fig. 4.
Extended Data Fig. 4.. Minor changes in microbiota composition occur after Bf colonization.
a-c, 16S rRNA taxonomic analysis of relative abundance of bacterial taxa in small intestine (a), cecum (b), and feces (c) after 6-weeks of multi-dose Bf colonization. Less abundant taxa (primarily Clostridales) that did not significantly change between cohorts were removed for simplicity. Increase of Bf in cecal populations denoted with orange box. NCBI nucleotide BLAST database confirmed the only reads assigned as Bacteroides species were Bacteroides fragilis. 6-Dose refers to Bf oral administration.
Extended Data Fig. 5.
Extended Data Fig. 5.. Systemic IgA induction by Bf does not require PSA or TLR2.
a,b, ELISpot assays of Bf-specific IgA plasma cells isolated from BM (a) and SiLP (b) of Bf-treated B6-Tlr2−/− and B6-wt mice. c, Serum ELISA was performed to determine the level of Bf-specific IgA from Bf-treated B6-Tlr2−/− and B6-wt mice. d,e, ELISpot assays of Bf-specific IgA plasma cells isolated from BM (d) and SiLP (e) of Bf- and BfΔPSA-treated mice. f,g, Serum ELISA determined level of Bf-specific IgA in Bf- and BfΔPSA-treated mice. ELISA plates were coated in heat-killed Bf-wt (f) or BfΔPSA (g). h,i, ELISpot assays of Bf-specific IgA plasma cells isolated from BM (h) and SiLP (i) of Bf-wt- and BfΔPSA-treated mice that were pre-treated with VGAM (vancomycin, gentamicin, ampicillin, metronidazole). j, Serum ELISA determined level of Bf-specific IgA in Bf-wt- and BfΔPSA-treated mice that were pre-treated with VGAM. For all experiments shown, n=3–5 mice/group. For serum ELISA, area under the curve (AUC) was calculated based on the absorbance at 450 nm from each serially diluted sample. Statistical analysis was performed using one-way analysis of variance (ANOVA) with Turkey multiple-comparison test (a-j). Exact P values are shown. Data are representative of three independent experiments.
Extended Data Fig. 6.
Extended Data Fig. 6.. Anti-CD40L treatment reduces de novo plasma cell generation, but not Bf-IgG induction.
a, B. fragilis-specific serum IgG ELISA of B6 mice treated with Bf multi-dose oral gavage and i.p. injections of MR1 (anti-CD40L). b,c, ELISpot analysis of total IgG (b) and IgA (c) plasma cell populations isolated from BM of MR1-treated mice. d,f, ELISpot analysis of total IgA plasma cell populations isolated from SiLP (d) and CoLP (e) tissues of MR1-treated mice. f,g, Serum ELISA of MR1-treated mice to assess total IgA (f) and IgG (g) levels. For experiment shown, n=4 mice/group. Plasma cell ELISpot and serum ELISA were performed using plates coated with heat-killed antigen from Bf. For serum ELISA, the area under the curve (AUC) was calculated based on the absorbance at 450 nm from each serially diluted sample. Statistical analysis was performed using one-way analysis of variance (ANOVA) with Turkey multiple-comparison test (a-g). Exact P values are shown. i.p., intraperitoneal.
Extended Data Fig. 7.
Extended Data Fig. 7.. Cecal patch-deficient mice maintain capacity for Bf-specific IgA induction.
a,b,c, ELISpot analysis of Bf-specific IgA plasma cell populations isolated from BM (a), SiLP (b), and CoLP (c) tissues of cecal patch-deficient B6 mice. d, Serum ELISA of cecal patch-deficient mice to assess generation of Bf-specific IgA. e,f,g, ELISpot analysis of total IgA plasma cell populations isolated from BM (e), SiLP (f), and CoLP (g) tissues of cecal patchdeficient B6 mice. h, Total serum IgA levels in cecal patch-deficient mice. For all experiments, n=5 mice/group. For serum ELISA, area under the curve (AUC) was calculated based on the absorbance at 450 nm from each serially diluted sample. Statistical analysis was performed using students t-test with Welch’s correction (a-h). Exact P values are shown.
Extended Data Fig. 8.
Extended Data Fig. 8.. Peyer’s patch-deficient mice retain competent plasma cell induction mechanisms.
a, B. fragilis-specific serum IgG ELISA of patch-deficient B6 mice treated with Bf multi-dose oral gavage. b,c,d, ELISpot analysis of total IgA plasma cell populations isolated from BM (b), SiLP (c) and CoLP (d) tissues of PP-deficient B6 mice. e,f, Serum ELISA of PP-deficient mice to assess total levels of IgA (e) and IgG (f). For all experiments shown, n=4 mice/group. For serum ELISA, area under the curve (AUC) was calculated based on the absorbance at 450 nm from each serially diluted sample, Statistical analysis was performed using one-way analysis of variance (ANOVA) with Turkey multiple-comparison test (a-f). Exact P values are shown.
Extended Data Fig. 9.
Extended Data Fig. 9.. Multi-dose B. fragilis treatment induces antimicrobial gene expression in the small intestine.
a. Magnitude of gene expression as log2 TPM is shown for selected genes and displayed as the mean (bar), 75% confidence interval (box), 95% confidence interval (whisker), and individual sample data points (jitter) for each small intestine treatment group.
Fig. 1.
Fig. 1.. Oral gavage of Bacteroides fragilis induces systemic IgA Responses in B6-SPF mice.
a, Experimental design, including oral gavage treatment strategy and plasma cell induction period. b,c, ELISpot assays of B. fragilis-specific mucosal IgA plasma cells isolated from colonic (b) and small intestinal (c) lamina propria 6-weeks after initial dose. d, ELISpot assay of Bf-specific systemic IgA plasma cells isolated from bone marrow 6-weeks after initial dose. e, Serum ELISA determined the level of Bf-specific IgA in Bf-treated mice. For the experiment shown, n=4 mice in each cohort. Plasma cell ELISpot and serum ELISA was performed using appropriate plates coated with heat-killed antigen from the tested bacteria. For serum ELISA, the area under the curve (AUC) was calculated based on the absorbance at 450 nm from each serially diluted sample. Statistical analysis was performed using one-way analysis of variance (ANOVA) with Turkey multiple-comparison test (b-e). Exact P values are shown.
Fig. 2.
Fig. 2.. Systemic IgA induction by B. fragilis requires continuous colonization of B6-SPF mice.
a,b, Necessity of continuous colonization for IgA generation was tested by treating mice with multi-dose Bf regimen followed by erythromycin (ERY) in drinking water for remainder of induction period. ELISpot assays of bone marrow (a) and small intestine (b) IgA plasma cells using plates pre-coated with heat-killed Bf. c, Serum ELISA determined induction of Bf-IgA in ERY-treated mice. d-f, qPCR analysis of Bf colonization following single-dose determined relative abundance of this bacterium in the small intestine (d), cecum (e), and feces (f) 1-, 3-, 7-, and 14-days post-treatment. g-i, qPCR determination of Bf relative abundance in small intestine (g), cecum (h) and feces (i) following single- and multi-dose treatment 6-weeks after initial dose. For all experiments shown, n=4 mice in each cohort. For serum ELISA, the area under the curve (AUC) was calculated based on the absorbance at 450 nm from each serially diluted sample. Statistical analysis was performed using students t-test with Welch’s correction (a-c) or one-way analysis of variance (ANOVA) with Turkey multiple-comparison test (g-i). Exact P values are shown. Data are representative of three independent experiments.
Fig. 3.
Fig. 3.. Generation of Bf-IgA requires Peyer’s patch germinal centers.
a-c, B. fragilis-specific ELISpot analysis of IgA plasma cell populations isolated from BM (a), SiLP (b), and CoLP (c) tissues of B6 mice treated with Bf multi-dose oral gavage and i.p. injections of MR1 (anti-CD40L). d, B. fragilis-specific serum IgA ELISA of MR1-treated mice. e,f,g, Intestinal patch-deficient mice were treated with multi-dose Bf regimen and assayed for Bf-IgA plasma cells isolated from BM (e), SiLP (f), and CoLP (g). h, Bf-IgA ELISA using serum isolated from Bf-treated patch-deficient mice. For all experiments shown, n=4 mice/group. Plasma cell ELISpot and serum ELISA were performed using plates coated with heat-killed antigen from Bf. For serum ELISA, area under the curve (AUC) was calculated based on the absorbance at 450 nm from each serially diluted sample starting at 1:20. Statistical analysis was performed using one-way analysis of variance (ANOVA) with Turkey multiple-comparison test (a-h). Exact P values are shown. Data are representative of two independent experiments. i.p., intraperitoneal.
Fig. 4.
Fig. 4.. B. fragilis colonization elicits minor transcriptional changes in the gut.
Transcriptomic analysis was performed on colon and small intestine tissue of animals treated with a single or multiple doses of Bf harvested 2 or 4 weeks post initial treatment. a. Hierarchical clustering of all samples is shown with shapes indicating tissue of origin and color indicating treatment groups. Asterisk (*) indicates branch point of small intestine multi-dose group. b. Principal component analysis is displayed for PC1 and PC2. c. Primary loading (top ten up and down) genes are shown for PC1 and PC2. d., e. GSEA was performed for all curated pathway genesets comparing each sample group to relevant tissue control. d. All significantly (p<.05) enriched pathways are shown as a heatmap of normalized enrichment scores. e. Selected enrichment plots are shown for enriched pathways and are grouped by comparison of enrichment.
Fig. 5.
Fig. 5.. B. fragilis systemic IgA protects against peritoneal abscess formation.
a, Intraperitoneal injection of live B. fragilis combined with inactivated cecal slurry leads to the formation of enumerable peritoneal abscesses (6-days after injection). b, Schematic of 10-week Bf-IgA induction procedure followed by infection challenge. c, Abscess scores for B6-wt and B6-IgA−/− mice pre-treated with Bf for 10 weeks then challenged with Bf/cecal slurry. d-e, Serum ELISA was performed to determine the level of Bf-specific IgA (d) and IgG (e) in naïve and Bf pre-treated B6-IgA−/− and B6-wt mice prior to abscess challenge. Naïve n=10, B6-IgA−/− n=9, B6-wt n=10. f, Abscess scores for B6-PP-deficient and B6-wt mice pre-treated with Bf. B6 PP-deficient n=5, B6-wt n=5. Statistical analysis was performed using one-way analysis of variance (ANOVA) with Turkey multiple-comparison test (c-e) or students t-test with Welch’s correction (f). Exact P values are shown. Data are representative of two independent experiments.

Similar articles

References

    1. Zheng D., Liwinski T. & Elinav E. Interaction between microbiota and immunity in health and disease. Cell Res 30, 492–506 (2020). - PMC - PubMed
    1. Mantis N. J., Rol N. & Corthésy B. Secretory IgA’s complex roles in immunity and mucosal homeostasis in the gut. Mucosal Immunol 4, 603–611 (2011). - PMC - PubMed
    1. Wilmore J. R. et al. Commensal Microbes Induce Serum IgA Responses that Protect against Polymicrobial Sepsis. Cell Host Microbe 23, 302–311.e3 (2018). - PMC - PubMed
    1. Usami K. et al. The gut microbiota induces Peyer’s-patch-dependent secretion of maternal IgA into milk. Cell Reports 36, 109655 (2021). - PubMed
    1. Keppler S. J., Goess M. C. & Heinze J. M. The Wanderings of Gut-Derived IgA Plasma Cells: Impact on Systemic Immune Responses. Front Immunol 12, 670290 (2021). - PMC - PubMed

Publication types

LinkOut - more resources