

This is a preprint.
A Dynamic Flow Fetal Membrane Organ-on-a-Chip System for Modeling the Effects of Amniotic Fluid Motion
- PMID: 38798515
- PMCID: PMC11118697
- DOI: 10.21203/rs.3.rs-4372328/v1
A Dynamic Flow Fetal Membrane Organ-on-a-Chip System for Modeling the Effects of Amniotic Fluid Motion
Update in
-
A dynamic flow fetal membrane organ-on-a-chip system for modeling the effects of amniotic fluid motion.Biomed Microdevices. 2024 Jul 4;26(3):32. doi: 10.1007/s10544-024-00714-1. Biomed Microdevices. 2024. PMID: 38963644 Free PMC article.
Abstract
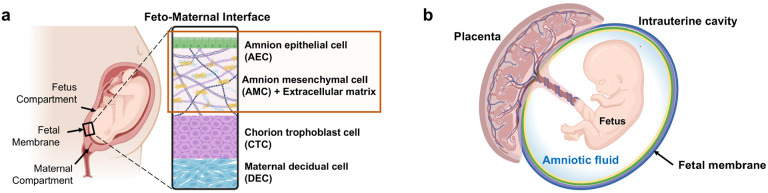
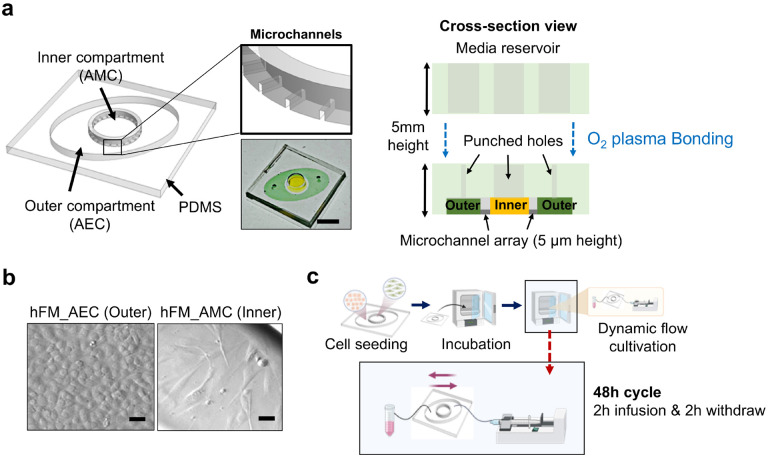
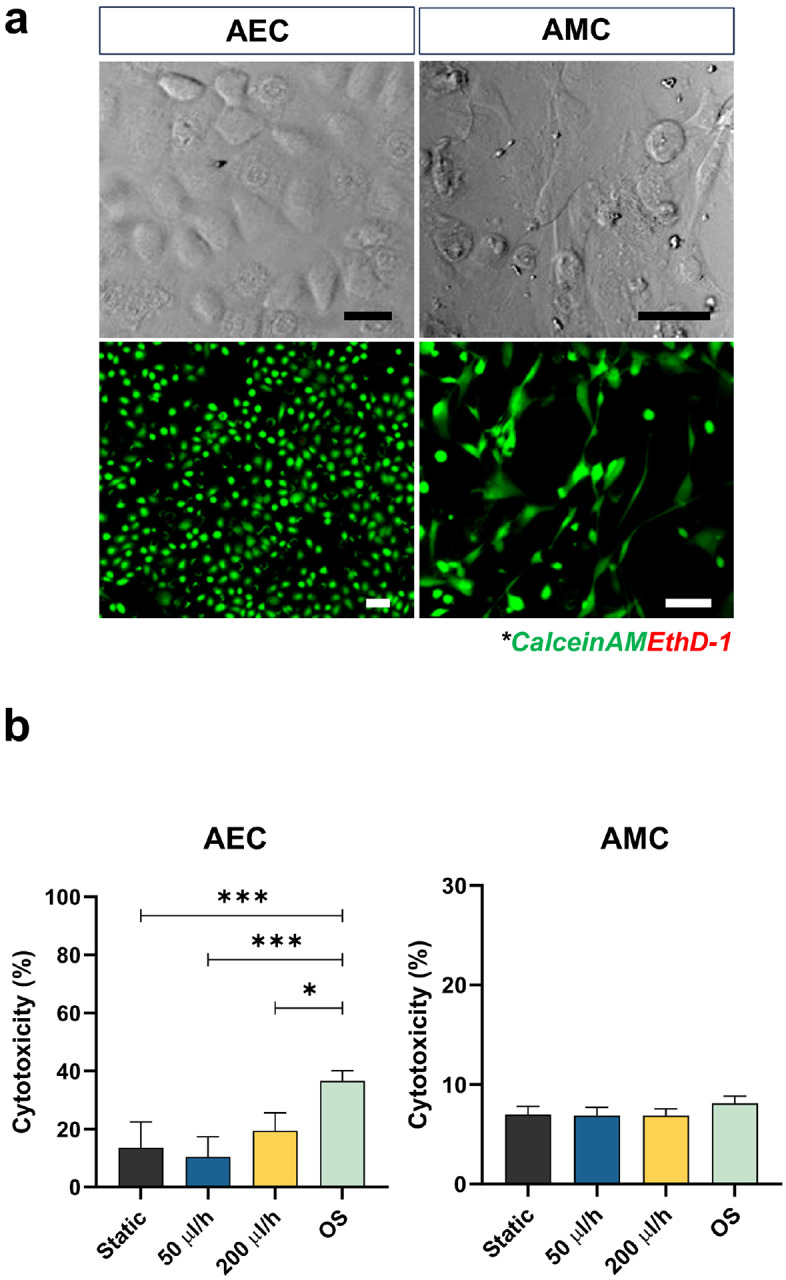
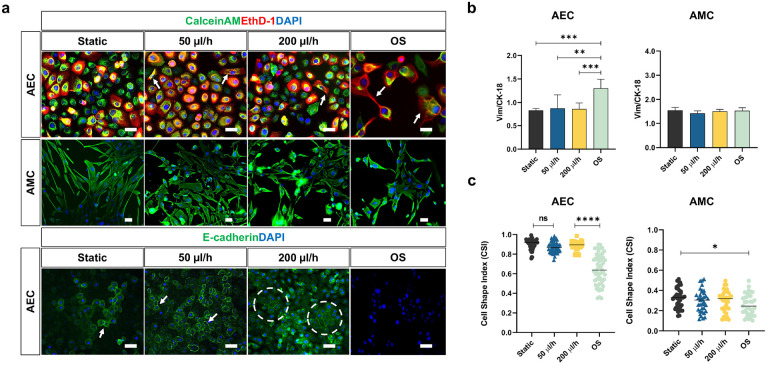
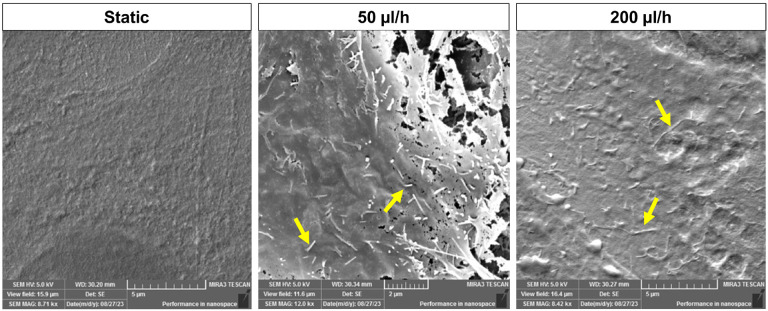
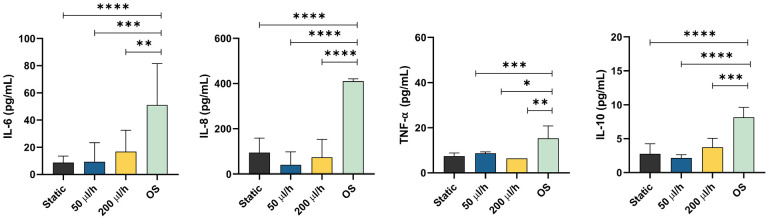
Fetal membrane(amniochorion), the innermost lining of the intrauterine cavity, surround the fetus and enclose amniotic fluid. Unlike unidirectional blood flow, amniotic fluid subtly rocks back and forth, and thus, the innermost amnion epithelial cells are continuously exposed to low levels of shear stress from fluid undulation. Here, we tested the impact of fluid motion on amnion epithelial cells (AECs) as a bearer of force impact and their potential vulnerability to cytopathologic changes that can destabilize fetal membrane functions. An amnion membrane (AM) organ-on-chip (OOC) was utilized to culture human fetal amnion membrane cells. The applied flow was modulated to perfuse culture media back and forth for 48 hours flow culture to mimic fluid motion. Static culture condition was used as a negative control, and oxidative stress (OS) condition was used as a positive control for pathophysiological changes. The impacts of fluidic motion were evaluated by measuring cell viability, cellular transition, and inflammation. Additionally, scanning electron microscopy (SEM) imaging was performed to observe microvilli formation. The results show that regardless of the applied flow rate, AECs and AMCs maintained their viability, morphology, innate meta-state, and low production of pro-inflammatory cytokines. E-cadherin expression and microvilli formation in the AECs were upregulated in a flow rate-dependent fashion; however, this did not impact cellular morphology or cellular transition or inflammation. OS treatment induced a mesenchymal morphology, significantly higher vimentin to CK-18 ratio, and pro-inflammatory cytokine production in AECs, whereas AMCs did not respond in any significant manner. Fluid motion and shear stress, if any, did not impact AEC cell function and did not cause inflammation. Thus, when using an amnion membrane OOC model, the inclusion of a flow culture environment is not necessary to mimic any in utero physiologic cellular conditions of fetal membrane-derived cells.
Keywords: Fetal membrane; amniotic fluid; microphysiological system; organ-on-chip; preterm birth; shear stress.
Conflict of interest statement
Conflict of interest The authors declare no conflict of interest.
Figures
Similar articles
-
A dynamic flow fetal membrane organ-on-a-chip system for modeling the effects of amniotic fluid motion.Biomed Microdevices. 2024 Jul 4;26(3):32. doi: 10.1007/s10544-024-00714-1. Biomed Microdevices. 2024. PMID: 38963644 Free PMC article.
-
Amnion membrane organ-on-chip: an innovative approach to study cellular interactions.FASEB J. 2019 Aug;33(8):8945-8960. doi: 10.1096/fj.201900020RR. Epub 2019 Jun 4. FASEB J. 2019. PMID: 31039044 Free PMC article.
-
Interleukin (IL)-6: A Friend or Foe of Pregnancy and Parturition? Evidence From Functional Studies in Fetal Membrane Cells.Front Physiol. 2020 Jul 24;11:891. doi: 10.3389/fphys.2020.00891. eCollection 2020. Front Physiol. 2020. PMID: 32848846 Free PMC article.
-
Potential antitumor therapeutic strategies of human amniotic membrane and amniotic fluid-derived stem cells.Cancer Gene Ther. 2012 Aug;19(8):517-22. doi: 10.1038/cgt.2012.30. Epub 2012 Jun 1. Cancer Gene Ther. 2012. PMID: 22653384 Review.
-
Healing Mechanism of Ruptured Fetal Membrane.Front Physiol. 2020 Jun 17;11:623. doi: 10.3389/fphys.2020.00623. eCollection 2020. Front Physiol. 2020. PMID: 32625113 Free PMC article. Review.
References
-
- (1970). “Amniotic fluid: its physiology and pathology.” J Reprod Med 5(6): 221–241. - PubMed
-
- Ballermann B. J., Dardik A., Eng E. and Liu A. (1998). “Shear stress and the endothelium.” Kidney Int Suppl 67: S100–108. - PubMed
-
- Basile M., Centurione L., Passaretta F., Stati G., Soritau O., Susman S., Gindraux F., Silini A., Parolini O. and Di Pietro R. (2023). “Mapping of the Human Amniotic Membrane: In Situ Detection of Microvesicles Secreted by Amniotic Epithelial Cells.” Cell Transplant 32: 9636897231166209. - PMC - PubMed
-
- Borgida A. F., Mills A. A., Feldman D. M., Rodis J. F. and Egan J. F. (2000). “Outcome of pregnancies complicated by ruptured membranes after genetic amniocentesis.” Am J Obstet Gynecol 183(4): 937–939. - PubMed
Publication types
Grants and funding
LinkOut - more resources
Full Text Sources
Research Materials
