[Preprint]. 2024 May 19:2024.05.16.594595.
doi: 10.1101/2024.05.16.594595.

Sex-specific single cell-level transcriptomic signatures of Rett syndrome disease progression

Affiliations

Sex-specific single cell-level transcriptomic signatures of Rett syndrome disease progression

Osman Sharifi et al. bioRxiv. .

Update in

Abstract

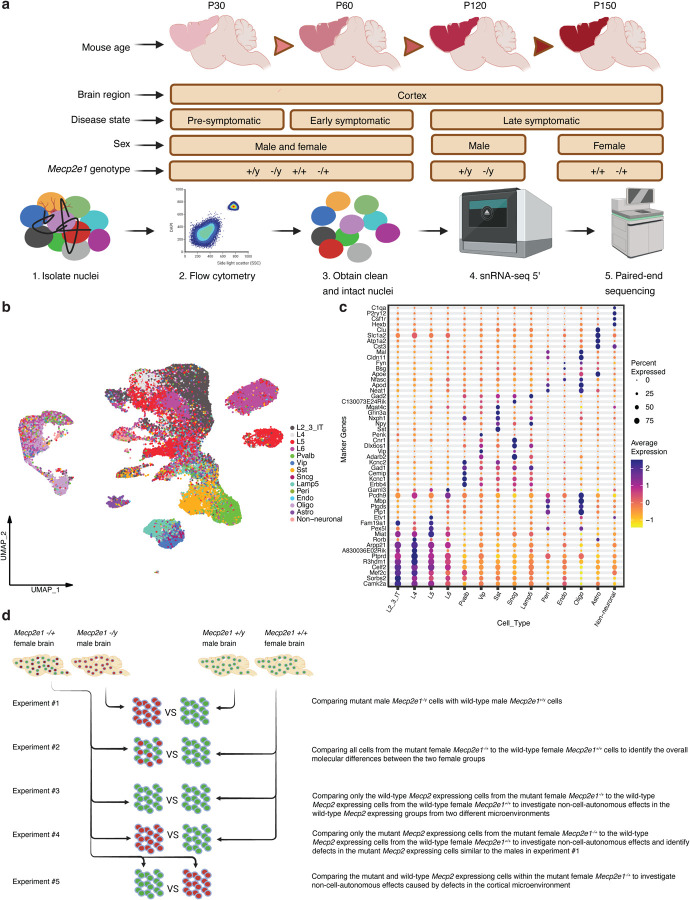
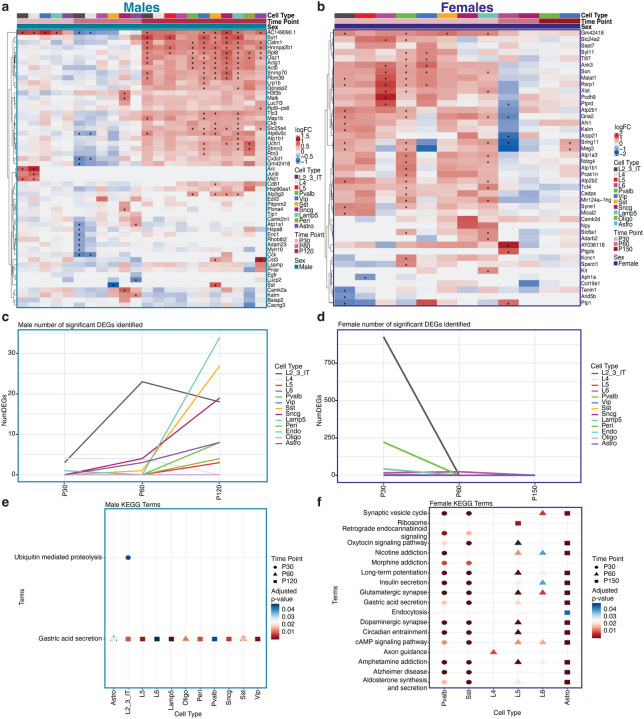
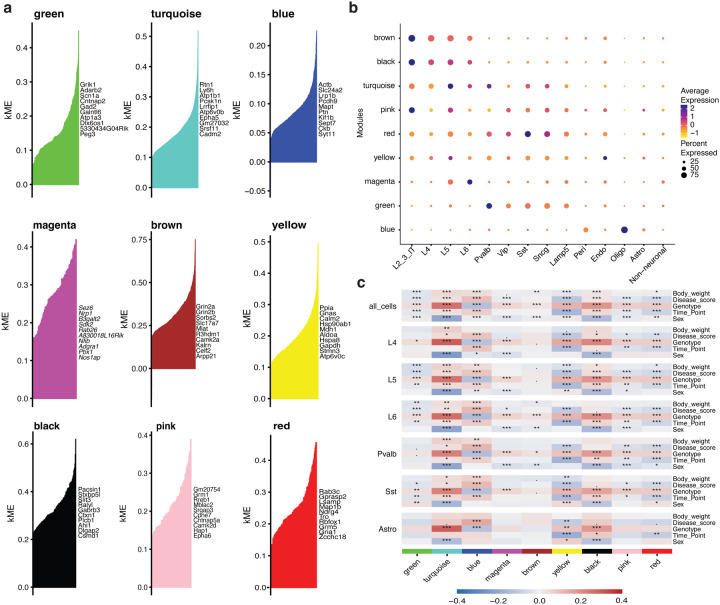
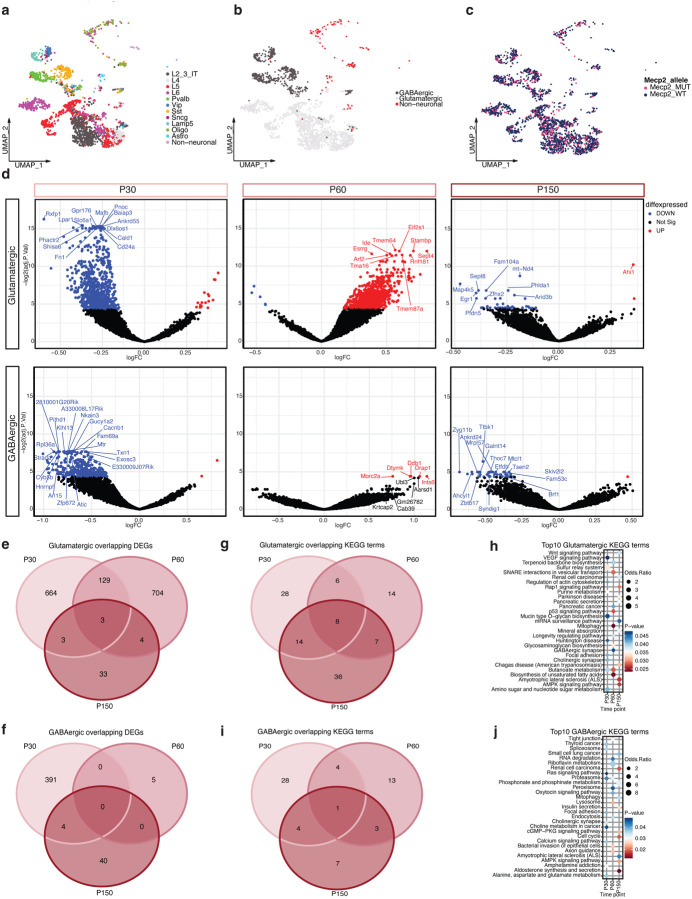
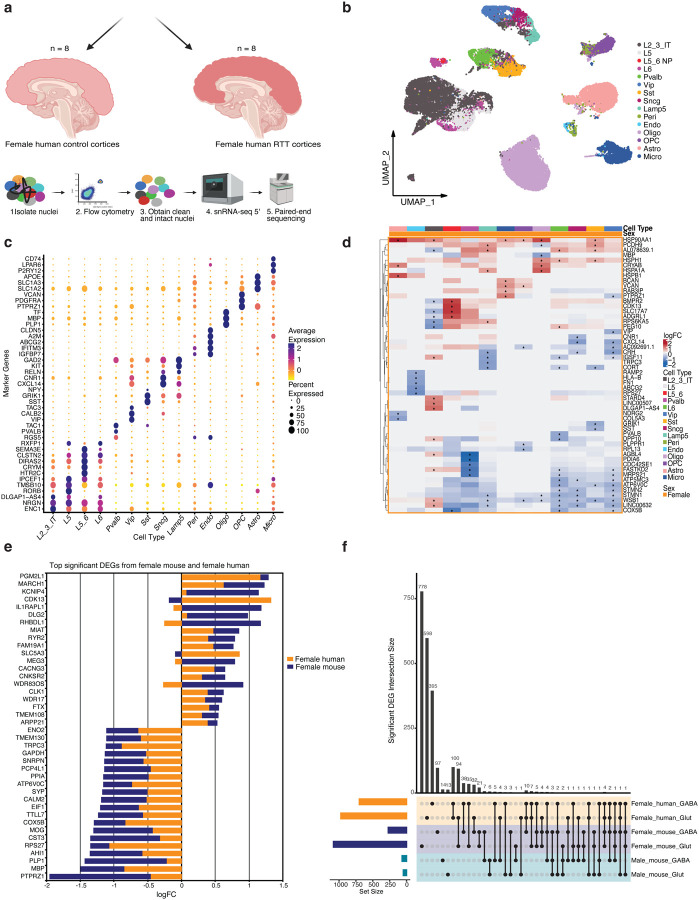
Dominant X-linked diseases are uncommon due to female X chromosome inactivation (XCI). While random XCI usually protects females against X-linked mutations, Rett syndrome (RTT) is a female neurodevelopmental disorder caused by heterozygous MECP2 mutation. After 6-18 months of typical neurodevelopment, RTT girls undergo poorly understood regression. We performed longitudinal snRNA-seq on cerebral cortex in a construct-relevant Mecp2e1 mutant mouse model of RTT, revealing transcriptional effects of cell type, mosaicism, and sex on progressive disease phenotypes. Across cell types, we observed sex differences in the number of differentially expressed genes (DEGs) with 6x more DEGs in mutant females than males. Unlike males, female DEGs emerged prior to symptoms, were enriched for homeostatic gene pathways in distinct cell types over time, and correlated with disease phenotypes and human RTT cortical cell transcriptomes. Non-cell-autonomous effects were prominent and dynamic across disease progression of Mecp2e1 mutant females, indicating wild-type-expressing cells normalizing transcriptional homeostasis. These results improve understanding of RTT progression and treatment.


Figures

Figure 1.
Figure 1.. A scheme showing the overall mouse study design.
a. Cortical samples were collected from postnatal mice at four different timepoints corresponding to three different disease stages (n = 28). Four different Mecp2e1 genotypes were considered that include both sexes. B. UMAP of the unsupervised clustering of cell types (n = 93,798 cells post QC) identified. Cell type labels were transferred from Van, Yao et al. 2021. c. Top gene markers for each cell type are shown on y-axis. The color refers to the average expression of genes in a cell type and the percent expressed describes the percentage of cells within a cell type that express each gene marker. d. Design of computational experiments comparing mutant to WT cells from mice of both sexes. Experiments 3 to 5 are comparing subtypes of cells in females due to X chromosome inactivation to examine potential non-cell-autonomous effects of Mecp2e1 mutation.
Figure 2.
Figure 2.. Sexually-dimorphic dynamic patterns of DEGs and KEGG pathway terms across time and cell type.
a. Heatmap of top 5 differentially expressed genes (DEGs) based on the lowest adjusted p-value ≤ 0.05 comparing male Mecp2e1−/y and Mecp2e1+/y cortical cells across timepoints (experiment 1). b. Heatmap of top 5 DEGs comparing female Mecp2e1−/+ and Mecp2e1+/+ cortical cells across timepoints (experiment 2). *indicates adjusted p-value ≤ 0.05 (corrected via Benjamini and Hochberg method). c, d. Number of DEGs over time at adjusted p-value ≤ 0.05 for experiments 1 and 2, respectively. e, f. Dot plots showing the KEGG pathway terms for DEGs (adjusted p-value ≤ 0.1) from each cell type, selected for terms that are persistent over time for experiments 1 and 2, respectively.
Figure 3.
Figure 3.. hdWGCNA identifies co-expression networks for each cell type in the mouse cortex that correlated with Mecp2e1 genotype, disease phenotypes, and sex.
a. Top 10 hub genes identified for each of the 9 modules generated by hdWGCNA on entire snRNAseq dataset, identified by color. The x-axis are all the genes in each module and the y-axis is the corresponding kME value. b. Dot plot of the average gene expression of the top 10 hub genes in each module generated for each cortical cell type. c. A heat map of correlations between experimental phenotypes and variables (body weight, disease score, genotype, time point, sex) and averaged gene expression (eigenmode value) for each cell type (cell types not shown are in Supplemental Figure 7a). * , **, *** indicates FDR-corrected p-value ≤ 0.05, 0.01, and 0.001, respectively. The color bar shows the Pearson correlation coefficient.
Figure 4.
Figure 4.. Dynamic non-cell-autonomous effects on differentially expressed genes and KEGG pathways over disease progression.
As shown in Experiment #3 (Fig. 1d), we compared WT cells from Mecp2e1−/+ female with WT cells from Mecp2e1+/+ glutamatergic and GABAergic neurons longitudinally. a. UMAP plot of cell types indentified in the mosaic females b. UMAP plot of the female cortices showing the clustering of the broad cell type categories. c. UMAP plot of mosaic female cells parsed by Mecp2 allele d. Volcano plots showing differentially expressed genes (DEGs) of the mouse cortical neurons contrasting WT cells from WT Mecp2e1+/+ females and WT cells from Mecp2e1−/+ mosaic females. e,f. Venn diagrams of overlapping glutamatergic and GABAergic DEGs respectfully over time. g,i. Venn diagrams of significant KEGG terms of glutamatergic and GABAergic neurons over time. H. Top 10 KEGG terms of glutamatergic neurons over time. j Top 10 KEGG terms of GABAergic neurons over time.
Figure 5.
Figure 5.. Human RTT cortical neurons share transcriptional dysregulation specifically with Mecp2e1−/+ mosaic female mice.
a. A schematic of postmortem human RTT cortices and age/sex matched control cortices. b. UMAP of the unsupervised clustering of cell types identified in the human cortices (n = 39336 cells post QC). Cell type labels were transferred from Bakken Trygve et al. 2021. c. Top gene markers for each cell type in the human cortex. d. Heatmap of top differentially expressed genes (DEGs) for human female cortices. *indicates adjusted p-value ≤ 0.05. e. Bar graph showing overlapping of the top significant upregulated and downregulated genes by logFC in female mouse and female human. f. Upset plot showing overlap of the significant DEGs from both GABAergic and glutamatergic neurons in female human, female mouse, and male mouse.

Similar articles

References

    1. Amir R. E. et al. Rett syndrome is caused by mutations in X-linked MECP2, encoding methyl- CpG-binding protein 2. Nat. Genet. 23, 185–188 (1999). - PubMed
    1. Zoghbi H. Y. MeCP2 dysfunction in humans and mice. J. Child Neurol. 20, 736–740 (2005). - PubMed
    1. Sharifi O. & Yasui D. H. The Molecular Functions of MeCP2 in Rett Syndrome Pathology. Front. Genet. 12, (2021). - PMC - PubMed
    1. Yasui D. H. et al. Mice with an isoform-ablating Mecp2exon 1 mutation recapitulate the neurologic deficits of Rett syndrome. Hum. Mol. Genet. 23, 2447–2458 (2014). - PMC - PubMed
    1. Guy J., Hendrich B., Holmes M., Martin J. E. & Bird A. A mouse Mecp2-null mutation causes neurological symptoms that mimic rett syndrome. Nat. Genet. 27, 322–326 (2001). - PubMed

Publication types