. 2024;8(5):567-576.
doi: 10.1038/s41550-024-02206-x. Epub 2024 Mar 4.

Oxygen production from dissociation of Europa's water-ice surface

Affiliations

Oxygen production from dissociation of Europa's water-ice surface

J R Szalay et al. Nat Astron. 2024.

Abstract

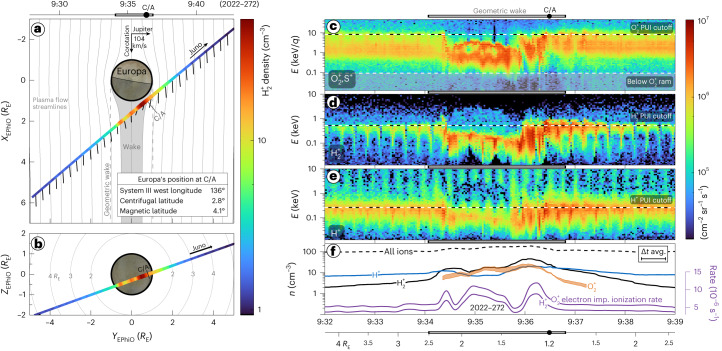
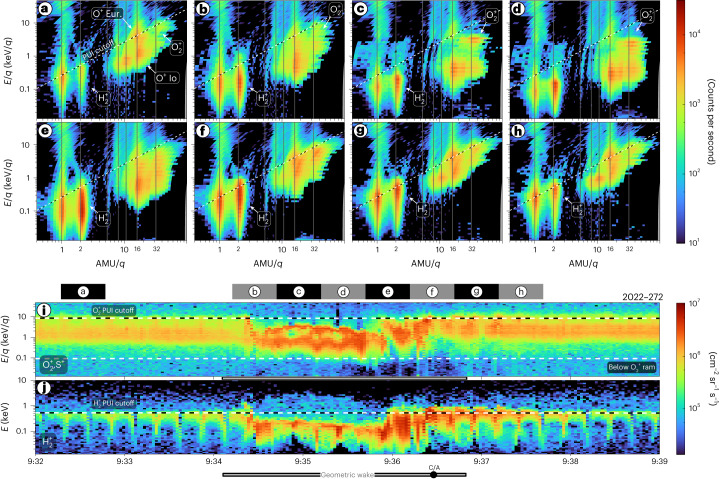
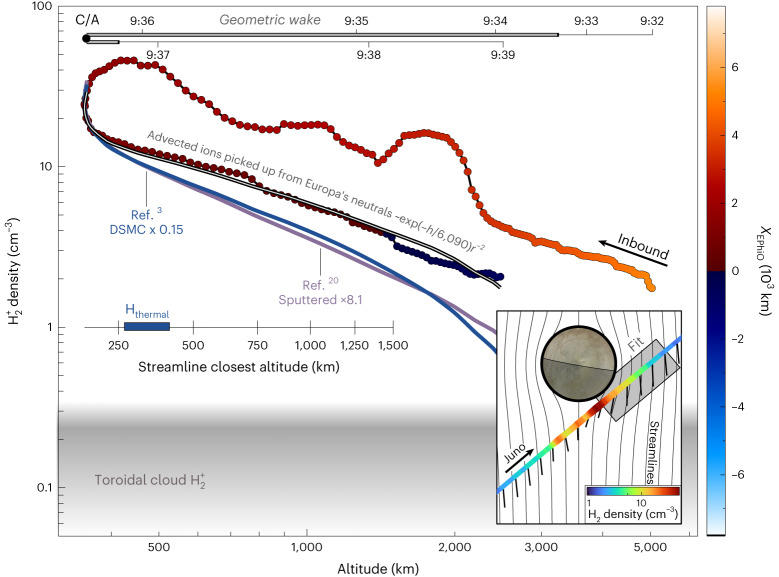
Jupiter's moon Europa has a predominantly water-ice surface that is modified by exposure to its space environment. Charged particles break molecular bonds in surface ice, thus dissociating the water to ultimately produce H2 and O2, which provides a potential oxygenation mechanism for Europa's subsurface ocean. These species are understood to form Europa's primary atmospheric constituents. Although remote observations provide important global constraints on Europa's atmosphere, the molecular O2 abundance has been inferred from atomic O emissions. Europa's atmospheric composition had never been directly sampled and model-derived oxygen production estimates ranged over several orders of magnitude. Here, we report direct observations of H2+ and O2+ pickup ions from the dissociation of Europa's water-ice surface and confirm these species are primary atmospheric constituents. In contrast to expectations, we find the H2 neutral atmosphere is dominated by a non-thermal, escaping population. We find 12 ± 6 kg s-1 (2.2 ± 1.2 × 1026 s-1) O2 are produced within Europa's surface, less than previously thought, with a narrower range to support habitability in Europa's ocean. This process is found to be Europa's dominant exogenic surface erosion mechanism over meteoroid bombardment.

Keywords: Magnetospheric physics; Rings and moons.


Conflict of interest statement

Competing interestsThe authors declare no competing interests.

Figures

Fig. 1
Fig. 1. Overview of Europa fly-by and plasma observations.
a,b, Density of H2+ PUIs directly picked up from Europa’s neutral atmosphere for XEPhiO (a) and ZEPhiO (b). Velocity arrows indicate the plasma velocity vector as determined from proton observations, with the rigid corotation of 104 km s−1. RE ≡ 1,560.8 km is Europa’s radius. Streamlines and associated wake are from an analytic model (Methods). ce, Fluxes of O2+ and S+ (c), H2+ (d) and H+ (e) from JADE’s TOF product. Horizontal dashed lines indicate the ram energy for O2+ (c) and cutoff energies (ce) for PUIs assuming rigid corotation (Methods). f, Densities of individual species (orange, black and blue), all ions (dashed black) and electron impact ionization rates (purple, right axis). The altitude is shown underneath cf. The boundaries of the geometric wake are shown with horizontal grey bars above or below each panel. Juno’s close approach (C/A) was on 2022-272 9:36:29. Each horizontal tick corresponds to 1 min. avg., average; imp., impact. Source data
Fig. 2
Fig. 2. Ion composition for eight periods along the fly-by.
ah, Average ion count rates as a function of energy per charge and mass per charge. The diagonal line on each shows the cutoff for locally picked up ions assuming that they are picked up at a rigid corotation speed of 104 km s−1 relative to Europa (Methods). The corresponding 30 s intervals are indicated on the top of i. i,j The same as shown in Figs. 1c (i) and 1e (j). Source data
Fig. 3
Fig. 3. Altitude profile for H2+ PUIs.
H2+ density coloured by XEPhiO such that densities observed upstream from the centre of Europa are blue and are red or orange downstream. The outbound portion of the trajectory, ‘Fit’ in the inset, is compared to a PUI advection solution (Methods). Overlaid curves show PUI densities corresponding to the advection solution for a PUI population from: (1) an ionized neutral atmosphere varying as exp(−h/λ)r2 where λ = 6,090 ± 890 km (grey), (2) scaled from a comprehensive DSMC atmosphere model (blue) and (3) scaled from a sputtered-only model (purple). The grey region at the bottom shows the expected density of Europa-genic H2+ PUIs already incorporated into Jupiter’s magnetospheric plasma. Source data
Fig. 4
Fig. 4. Overview of Juno’s Europa fly-by.
Water ice on the surface of Europa is dissociated by radiolysis to form O2 and H2. These gases can migrate both inwards towards the subsurface ocean or escape the surface by thermal desorption or direct sputtering to form its atmosphere. The lighter H2 occupies a more extended region than heavier O2, which remains closer to the surface. A portion of the neutrals in the atmosphere are ionized and picked up by the magnetospheric plasma. Juno observes these PUIs, with the relative abundances driven by the various processes described here. The radiolysis dissociation inset was adapted from ref. . Particles shown are O2 (blue), H2 (pink) and H2+ (grey).
Extended Data Fig. 1
Extended Data Fig. 1. Masking analysis for O2+ density estimation.
Panels (a) and (b) show identical data in panels (a) and (c) in Fig. 1, where a mask has been applied to each determined by the percentage from peak flux in H2+. The time range shown is 2022-272 9:34:20 to 9:37:15, where modified M/q = 32 fluxes were observed above the background magnetospheric heavy ions. Panel (c) shows the densities derived solely from the masked data (dotted lines) and those corrected for the missing portion of the distribution (dashed lines) using the correction factor shown in panel (d) from H2+.
Extended Data Fig. 2
Extended Data Fig. 2. Electron intensity distribution for electron reaction rates.
Panel (a) shows example electron spectra when Juno was between r = 9-10 RJ and within z = 2 RJ from the magnetic equator during the 38th perijove. Panel (b) shows these spectra along with the extrapolated lower energy component of the distribution function by fitting each individual spectrum to a kappa distribution. These extrapolations are used to compute the full electron reaction rate cross-sections.
Extended Data Fig. 3
Extended Data Fig. 3. Electron impact ionization rates for H2 and O2 as a function of zmag.
Panels (a) and (b) show the average electron impact ionization rates for each separate species derived from Juno/JADE electron measurements in the vicinity of Europa’s orbit (r = 9-10 RJ and within z = 2 RJ). Panel (c) shows the relative residence time Europa spends in each location. These distributions are used to determine the normalized rates in Extended Data Fig. 4.
Extended Data Fig. 4
Extended Data Fig. 4. Electron impact ionization rates for H2 and O2.
Panels (a) and (b) show the same information for separate species. The blue histogram shows the probability distribution of total electron impact ionization rates derived from Juno/JADE electron measurements in the vicinity of Europa’s orbit (r = 9-10 RJ and within Zmag ≤ 2 RJ) normalized by time Europa spends as a function of magnetic latitude. The purple histogram shows these values derived when Juno was within Europa’s geometric wake. Widths of the blue and purple bars at the bottom indicate the 10% and 90% percentiles with the median value shown in the central vertical line. Previous estimates in the vicinity of Europa’s orbit are shown in grey,.
Extended Data Fig. 5
Extended Data Fig. 5. Coordinate systems used to calculate streamlines.
Orange axes show the coordinate system where -zB is aligned with the magnetic field direction and the component of B out of the page is considered negligible. This coordinate system differs from EPhiO by a rotation by angle φ about the x direction. The ionospheric altitude HI and radius RI are also indicated.
Extended Data Fig. 6
Extended Data Fig. 6. Comparison of JADE plasma flow speeds with streamline model.
Each time series panel shows the Juno/JADE derived mean local speed using JADE proton measurements along with the 1σ uncertainties summed in quadrature from values within the JADE data files. The three curves show model predictions for this speed for corotation speeds of 104 km s−1 (orange, rigid corotation), 100 km s−1 (red), and 95 km s−1 (purple). The panel to the right of each time series shows the corresponding streamline model along with Juno’s trajectory and observed velocity vectors. The light grey circle corresponds to Europa and the dark grey annulus corresponds to the modeled ionospheric height HI. Nine different model cases are shown for interaction strength α = (0.4,0.55,0.7) and HI = (30 km, 100 km, 300 km). We use values of α = 0.55 and HI = 30 throughout the analysis (middle row, left column).

References

    1. Johnson, R. E. Energetic Charged-Particle Interactions with Atmospheres and Surfaces (Springer, 1990).
    1. Johnson, R. E. et al. The origin and fate of O2 in Europa’s ice: an atmospheric perspective. Space Sci. Rev. 10.1007/s11214-019-0582-1 (2019).
    1. Smyth WH, Marconi ML. Europa’s atmosphere, gas tori, and magnetospheric implications. Icarus. 2006;181:510–526.
    1. Oza AV, Johnson RE, Leblanc F. Dusk/dawn atmospheric asymmetries on tidally-locked satellites: O2 at Europa. Icarus. 2018;305:50–55.
    1. Davis MR, Meier RM, Cooper JF, Loeffler MJ. The contribution of electrons to the sputter-produced O2 exosphere on Europa. Astrophys. J. Lett. 2021;908:L53.