. 2024 May 21:12:e17449.
doi: 10.7717/peerj.17449. eCollection 2024.

Exploring the influence of self-identification on perceptual judgments of physical and social causality

Affiliations

Exploring the influence of self-identification on perceptual judgments of physical and social causality

Michele Vicovaro et al. PeerJ. .

Abstract

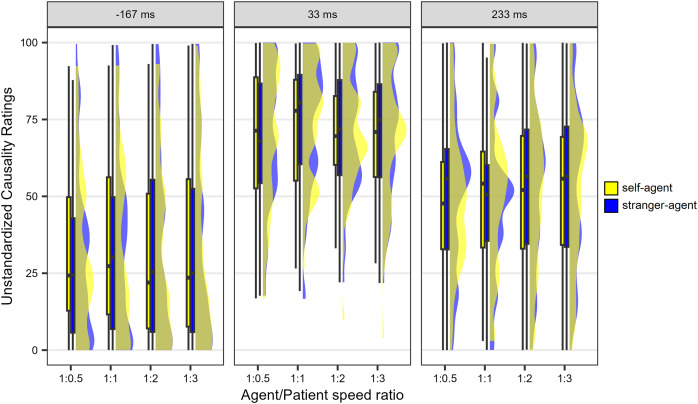
People tend to overestimate the causal contribution of the self to the observed outcome in various situations, a cognitive bias known as the 'illusion of control.' This study delves into whether this cognitive bias impacts causality judgments in animations depicting physical and social causal interactions. In two experiments, participants were instructed to associate themselves and a hypothetical stranger identity with two geometrical shapes (a circle and a square). Subsequently, they viewed animations portraying these shapes assuming the roles of agent and patient in causal interactions. Within one block, the shape related to the self served as the agent, while the shape associated with the stranger played the role of the patient. Conversely, in the other block, the identity-role association was reversed. We posited that the perception of the self as a causal agent might influence explicit judgments of physical and social causality. Experiment 1 demonstrated that physical causality ratings were solely shaped by kinematic cues. In Experiment 2, emphasising social causality, the dominance of kinematic parameters was confirmed. Therefore, contrary to the hypothesis anticipating diminished causality ratings with specific identity-role associations, results indicated negligible impact of our manipulation. The study contributes to understanding the interplay between kinematic and non-kinematic cues in human causal reasoning. It suggests that explicit judgments of causality in simple animations primarily rely on low-level kinematic cues, with the cognitive bias of overestimating the self's contribution playing a negligible role.

Keywords: Agency; Animacy; Causal judgement; Illusion of control; Intentional reaction; Launching effect; Perceptual matching; Self-identification; Self-prioritization; Social causality.


Conflict of interest statement

Mario Dalmaso is an Academic Editor for PeerJ.

Figures

Figure 1
Figure 1. Representation of animations associated with the perception of physical and social causality.
(A) Three frames depicting the launching effect (physical causality). (B) Three frames depicting an ‘intentional reaction’ effect (social causality). Arrows indicate the direction of the object motion and are not part of the animation sequence, as well as letters.
Figure 2
Figure 2. Sequence and tasks composing the whole experiment.
(A) Illustration of the main tasks that made up the whole experiment. (B) Illustration (not drawn to scale) of the matching task used in Experiments 1 and 2. (A) A trial with the circle shape, the label ‘you’, and the feedback associated with an incorrect response. (B) A trial with the square shape, the label ‘stranger’, and the feedback associated with a correct response. The participants decided, by means of a keypress, whether the shape-label association was identical to the association presented in the learning phase. (C) Illustration (not drawn to scale) of the causality judgment task used in Experiments 1. Note that at the end of the animation, participants were presented with the question aimed at assessing the judgement of causality.
Figure 3
Figure 3. Results observed in the causality task of Experiment 1.
The animations are arranged on the horizontal axis based on the agent/patient speed ratio, in descending order. The lower and upper hinges of the boxplots correspond to the first and third quartiles of the distribution, the thick horizontal line corresponds to the median. The lower and upper whiskers extend from the lower and upper hinges to the lowest or largest value no further than 1.5 * IQR from the hinge, where IQR is the inter-quartile range. The density curves represent the distribution of the data.
Figure 4
Figure 4. Distribution of Cohen’s d for the 24 animations of Experiment 1.
The vertical red dashed line represents the mean d (i.e., 0.0284).
Figure 5
Figure 5. Schematic representations of the twelve animations used as stimuli in Experiment 2.
The first panel in each row is referred to as the ‘first step’ of the animation in the main text, the second panel as ‘second step’ and the third and fourth panel as ‘third step’. The stimuli are not drawn to scale. To simplify the main features of the animations, some of their elements have been intentionally left out from this representation, namely the two ‘vertical hops on the spot’ that the shapes performed during the first step, and the two vertical rectangles that delimited the screen to the left and to the right. At the end of the animation, participants were presented with the question aimed at assessing the judgement of causality. A summary description of the kinematic characteristics of each animation is provided in Table 1. Please note that the layout of the figure may convey the impression that the two moving objects are observed from above a flat horizontal surface, contrasting with the customary lateral perspective seen in launching or intentional reaction animations (see Fig. 1). It is important to note that this perception is likely a result of the layout of the static depiction. The accompanying videos of the stimuli, available on OSf (http://dx.doi.org/10.17605/OSF.IO/E6HD7), indicate a more conventional lateral perspective.
Figure 6
Figure 6. Results observed in the causality task of Experiment 2.
The animations are arranged on the horizontal axis based on the observed causality ratings, in descending order. The lower and upper hinges of the boxplots correspond to the first and third quartiles of the distribution, the thick horizontal line corresponds to the median. The lower and upper whiskers extend from the lower and upper hinges to the lowest or largest value no further than 1.5 * IQR from the hinge, where IQR is the inter-quartile range. The density curves represent the distribution of the data.
Figure 7
Figure 7. Distribution of Cohen’s d for the 12 animations of Experiment 2.
The vertical red dashed line represents the mean d (i.e., 0.1033).

References

    1. Alloy LB, Abramson LY. Judgment of contingency in depressed and nondepressed students: sadder but wiser? Journal of Experimental Psychology: General. 1979;108(4):441–485. doi: 10.1037/0096-3445.108.4.441. - DOI - PubMed
    1. Badler J, Lefèvre P, Missal M. Causality attribution biases oculomotor responses. Journal of Neuroscience. 2010;30(31):10517–10525. doi: 10.1523/JNEUROSCI.1733-10.2010. - DOI - PMC - PubMed
    1. Badler JB, Lefèvre P, Missal M. Divergence between oculomotor and perceptual causality. Journal of Vision. 2012;12(5):3. doi: 10.1167/12.5.3. - DOI - PubMed
    1. Bae GY, Flombaum JI. Amodal causal capture in the tunnel effect. Perception. 2011;40(1):74–90. doi: 10.1068/p6836. - DOI - PubMed
    1. Bassili JN. Temporal and spatial contingencies in the perception of social events. Journal of Personality and Social Psychology. 1976;33(6):680–685. doi: 10.1037/0022-3514.33.6.680. - DOI

LinkOut - more resources