

Behavioural heterogeneity across killer whale social units in their response to feeding opportunities from fisheries
- PMID: 38799391
- PMCID: PMC11116761
- DOI: 10.1002/ece3.11448
Behavioural heterogeneity across killer whale social units in their response to feeding opportunities from fisheries
Abstract
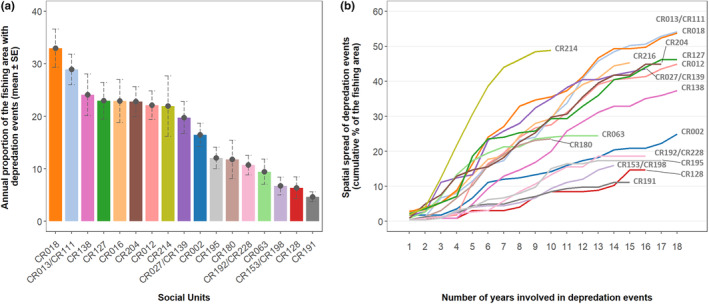
Intra-population heterogeneity in the behavioural response of predators to changes in prey availability caused by human activities can have major evolutionary implications. Among these activities, fisheries, while extracting resources, also provide new feeding opportunities for marine top predators. However, heterogeneity in the extent to which individuals have responded to these opportunities within populations is poorly understood. Here, we used 18 years of photo-identification data paired with statistical models to assess variation in the way killer whale social units within a subantarctic population (Crozet Islands) interact with fisheries to feed on fish caught on fishing gear (i.e., depredation behaviour). Our results indicate large heterogeneity in both the spatial and temporal extents of depredation across social units. While some frequently depredated on fishery catches over large areas, others sporadically did so and in small areas consistently over the years. These findings suggest that killer whale social units are exposed to varying levels of impacts of depredation, both negative (potential retaliation from fishers) and positive (food provisioning), on their life history traits, and may explain the contrasted demographic patterns observed within the declining population at Crozet but also potentially within the many other killer whale populations documented depredating on fisheries catches worldwide.
Keywords: Orcinus orca; depredation; human‐wildlife conflicts; intra‐population variation; marine top predator; social network.
© 2024 The Author(s). Ecology and Evolution published by John Wiley & Sons Ltd.
Conflict of interest statement
We declare we have no competing interests.
Figures


References
-
- Anderson, D. , Baird, R. W. , Bradford, A. L. , & Oleson, E. M. (2020). Is it all about the haul? Pelagic false killer whale interactions with longline fisheries in the central North Pacific. Fisheries Research, 230, 105665. 10.1016/j.fishres.2020.105665 - DOI
-
- Arenas, A. , Fernández, A. , & Gómez, S. (2008). Analysis of the structure of complex networks at different resolution levels. New Journal of Physics, 10, 53039. 10.1088/1367-2630/10/5/053039 - DOI
-
- Baird, R. W. , Anderson, D. B. , Kratofil, M. A. , Webster, D. L. , & Mahaffy, S. D. (2019). Cooperative conservation and long‐term management of false killer whales in Hawaiʻi: Geospatial analyses of fisheries and satellite tag data to understand fishery interactions. No. 67703: 48. https://www.cascadiaresearch.org/files/Bairdetal2019_Section6_FinalRepor...
-
- Baird, R. W. , & Dill, L. M. (1996). Ecological and social determinants of group size in transient killer whales. Behavioral Ecology, 7, 408–416. 10.1093/beheco/7.4.408 - DOI
Associated data
LinkOut - more resources
Full Text Sources
