. 2024 May 10:15:1411161.
doi: 10.3389/fimmu.2024.1411161. eCollection 2024.

Hepatitis B-related hepatocellular carcinoma: classification and prognostic model based on programmed cell death genes

Affiliations

Hepatitis B-related hepatocellular carcinoma: classification and prognostic model based on programmed cell death genes

Jinyue Tian et al. Front Immunol. .

Abstract

Instruction: Hepatitis B virus (HBV) infection is a major risk factor for hepatocellular carcinoma (HCC). Programmed cell death (PCD) is a critical process in suppressing tumor growth, and alterations in PCD-related genes may contribute to the progression of HBV-HCC. This study aims to develop a prognostic model that incorporates genomic and clinical information based on PCD-related genes, providing novel insights into the molecular heterogeneity of HBV-HCC through bioinformatics analysis and experimental validation.

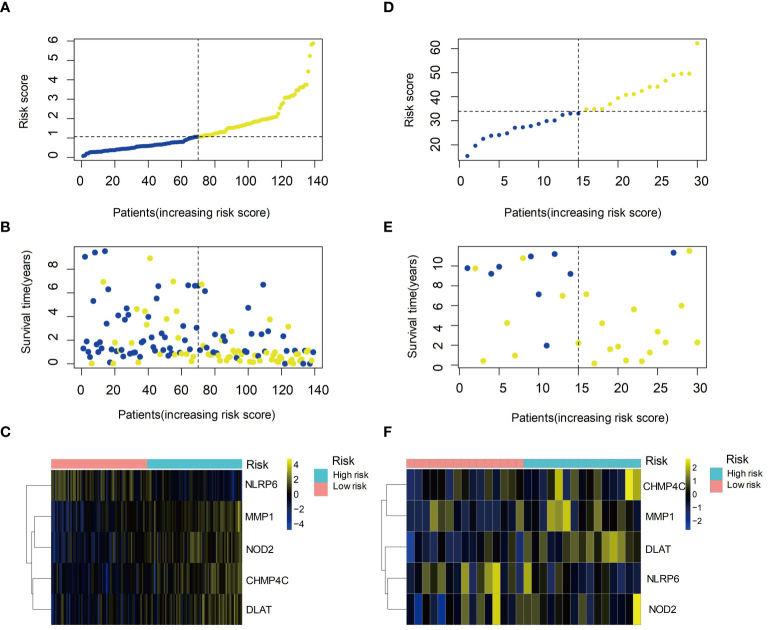
Methods: In this study, we analyzed 139 HBV-HCC samples from The Cancer Genome Atlas (TCGA) and validated them with 30 samples from the Gene Expression Omnibus (GEO) database. Various bioinformatics tools, including differential expression analysis, gene set variation analysis, and machine learning algorithms were used for comprehensive analysis of RNA sequencing data from HBV-HCC patients. Furthermore, among the PCD-related genes, we ultimately chose DLAT for further research on tissue chips and patient cohorts. Besides, immunohistochemistry, qRT-PCR and Western blot analysis were conducted.

Results: The cluster analysis identified three distinct subgroups of HBV-HCC patients. Among them, Cluster 2 demonstrated significant activation in DNA replication-related pathways and tumor-related processes. Analysis of copy number variations (CNVs) of PCD-related genes also revealed distinct patterns in the three subgroups, which may be associated with differences in pathway activation and survival outcomes. DLAT in tumor tissues of HBV-HCC patients is upregulated.

Discussion: Based on the PCD-related genes, we developed a prognostic model that incorporates genomic and clinical information and provided novel insights into the molecular heterogeneity of HBV-HCC. In our study, we emphasized the significance of PCD-related genes, particularly DLAT, which was examined in vitro to explore its potential clinical implications.

Keywords: clinical characteristics; hepatitis B virus infection; hepatocellular carcinoma; prognostic model; programmed cell death.


Conflict of interest statement

The authors declare that the research was conducted in the absence of any commercial or financial relationships that could be construed as a potential conflict of interest.

Figures

Figure 1
Figure 1
Clustering analysis of HBV-HCC samples based on gene expression profiles. (A) Clustering heatmap shows the identification of three distinct subgroups of HBV-HCC samples, labeled as Cluster 1, Cluster 2, and Cluster 3. (B) Kaplan-Meier survival analysis shows the overall survival (OS) of patients in each cluster. (C) Heatmap shows the expression levels of PCD-related genes in each cluster. (D-F) Stacked bar plot shows the distribution of histological grade, pathological stage, and T stage in each cluster. OS, Overall survival; PCD, Programmed cell death.
Figure 2
Figure 2
Microenvironment and immunotherapy sensitivity evaluation of three subgroups. (A) Heatmap represents immune cell infiltration in three subgroups of HBV-HCC using seven algorithms. (B-G) Stromal score, Immune score, ESTIMATE score, Exclusion score, Dysfunction score and MSI in Cluster 1, Cluster 2, and Cluster 3. MSI, Microsatellite instability. It signifies a lack of significant differences. *p≤0.05, **p≤0.01, ***p≤0.001. ns means p>0.05.
Figure 3
Figure 3
Pathway activation and CNV analysis reveal differences among HBV-HCC subgroups. (A) GSVA analysis shows the differences in pathway activity among the three HBV-HCC subgroups. The color red denotes DNA replication pathways, whereas purple signifies pathways related to metabolism. (B-D) Frequencies of CNV gain, loss, and non-CNV among PCD-related genes in the three HBV-HCC subgroups. CNV, Copy number variation; GSVA, Gene set variation analysis.
Figure 4
Figure 4
GO and KEGG analysis in HBV-HCC subgroups. GO enrichment analysis of Cluster 1 (A), Cluster 2 (B), and Cluster 3 (C). KEGG pathway analysis of Cluster 1 (D), Cluster 2 (E), and Cluster 3 (F). GO, Gene ontology; KEGG, Kyoto encyclopedia of genes and genomes.
Figure 5
Figure 5
Identification of hub genes and construction of PCD-related prognostic model for HBV-HCC. (A) Univariate Cox regression analysis profiles 20 genes significantly associated with OS. (B) LASSO regression showed that when the error of the model was minimized, 12 variables were selected for further logistic regression analysis. (C) Variable importance plot for the top 10 genes identified by RSF analysis. (D) Classification error rates of the RSF analysis for different numbers of genes. (E) Kaplan-Meier survival curves for patients in the high- and low-risk groups defined by the five-gene prognostic model. (F) ROC curve analysis of the five-gene prognostic model for 1-year, 3-year and 5-year OS. (G) PCA analysis of the high- and low-risk groups based on the five-gene prognostic model. (H) tSNE analysis of the high- and low-risk groups based on the five-gene prognostic model. (I-L) The prognostic value of the five-gene signature was validated in an independent cohort. The Kaplan-Meier survival curves (I), ROC curve analysis (J), PCA analysis (K), and tSNE analysis (L) showed consistent results with those of the training cohort. OS, Overall survival; LASSO, Least absolute shrinkage and selection operator; RSF, Random survival forest; ROC, Receiver operating characteristic curve; PCA, Principal components analysis; tSNE, t-distributed stochastic neighbor embedding.
Figure 6
Figure 6
Prognostic value of the risk score and expression of hub genes in HBV-HCC. (A) Kaplan-Meier survival curves of the high- and low-risk groups based on the risk score. (B) Time-dependent ROC curves of the risk score for predicting survival outcomes. (C) Heatmap showing the expression levels of the five hub genes in the high- and low-risk groups. (D) Kaplan-Meier survival curves of the high- and low-risk groups in the validation set. (E) Time-dependent ROC curves of the risk score in the validation set. (F) Heatmap showing the expression levels of the five hub genes in the high- and low-risk groups in the validation set. ROC, Receiver operating characteristic curve.
Figure 7
Figure 7
Immune cell infiltration and microenvironment in high- and low-risk groups of HBV-HCC patients. (A-J) Heatmap showing the ssGSEA scores of immune cell types in the high- and low-risk groups. (K) Boxplot showing the distribution of ssGSEA scores of immune processes in the high-risk and low-risk groups. (L-N) ImmunCellAI scores of the high-risk and low-risk groups for immunotherapy sensitivity, immunotherapy exclusion, and cytotoxic activity, respectively. (O) Boxplot showing the MSI scores of the high-risk and low-risk groups. ssGSEA, single sample gene set enrichment analysis; MSI, Microsatellite instability. *p≤0.05, **p≤0.01, ***p≤0.001. ns means p>0.05.
Figure 8
Figure 8
Development of a clinical prediction model based on T stage and risk score for HBV-HCC patients. (A) Univariate cox regression analysis of T stage and risk score for OS. (B) The distribution of risk scores in the training set. The dotted line represents the cut-off point for dividing patients into high- and low-risk groups. (C) The ROC curve of the multivariate Cox regression model based on T stage and risk score. (D) Calibration curves for 1-year, 3-year, and 5-year OS of HBV-HCC patients in the training cohort for the multivariate Cox regression model. (E) Kaplan-Meier curves for OS of patients in the high-risk and low-risk groups. OS, Overall survival; ROC, Receiver operating characteristic curve.
Figure 9
Figure 9
Upregulation of DLAT in tumor tissues of HBV-HCC patients. (A, B) Verify the expression of DLAT protein and mRNA levels in cells through in vitro experiments. (C, D) IHC staining of a tissue microarray was used to verify the expression of DLAT in HBV-HCC patients. (E, F) The relationship between DLAT IHC scores and levels of ALT and GGT. ** means p≤0.01, *** means p≤0.001, they all indicate significant differences.

References

    1. Feng X, Lu H, Wei Y, Guan M, Wang J, Liu C, et al. . Prognostic impact of hepatitis B virus infection in patients with primary cervical cancer. Cancer Med. (2021) 10:8310–9. doi: 10.1002/cam4.4358 - DOI - PMC - PubMed
    1. Conners EE, Panagiotakopoulos L, Hofmeister MG, Spradling PR, Hagan LM, Harris AM, et al. . Screening and testing for hepatitis B virus infection: CDC recommendations - United States 2023. MMWR Recomm Rep. (2023) 72:1–25. doi: 10.15585/mmwr.rr7201a1 - DOI - PMC - PubMed
    1. Li Q, Chen C, Huang C, Xu W, Hu Q, Chen L. Noninvasive models for predicting poor prognosis of chronic HBV infection patients precipitating acute HEV infection. Sci Rep. (2020) 10:2753. doi: 10.1038/s41598-020-59670-4 - DOI - PMC - PubMed
    1. Ndow G, Vo-Quang E, Shimakawa Y, Ceesay A, Tamba S, Njai HF, et al. . Clinical characteristics and outcomes of patients with cirrhosis and hepatocellular carcinoma in The Gambia, west Africa: a prospective cohort study. Lancet Glob Health. (2023) 11:e1383–92. doi: 10.1016/S2214-109X(23)00263-2 - DOI - PubMed
    1. Griffioen AW, Nowak-Sliwinska P. Programmed cell death lives. Apoptosis. (2022) 27:619–21. doi: 10.1007/s10495-022-01758-5 - DOI - PMC - PubMed

Substances