. 2024 May 10:15:1399989.
doi: 10.3389/fimmu.2024.1399989. eCollection 2024.

Retinal microglia express more MHC class I and promote greater T-cell-driven inflammation than brain microglia

Affiliations

Retinal microglia express more MHC class I and promote greater T-cell-driven inflammation than brain microglia

Christina L Bloomfield et al. Front Immunol. .

Abstract

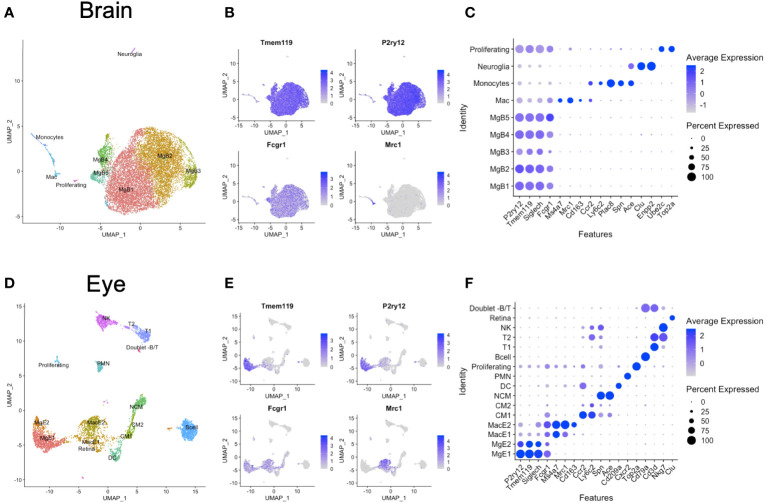
Introduction: Macrophage function is determined by microenvironment and origin. Brain and retinal microglia are both derived from yolk sac progenitors, yet their microenvironments differ. Utilizing single-cell RNA sequencing (scRNA-seq) data from mice, we tested the hypothesis that retinal and brain microglia exhibit distinct transcriptional profiles due to their unique microenvironments.

Methods: Eyes and brains from 2-4 month wildtype mice were combined (20 eyes; 3 brains) to yield one biologically diverse sample per organ. Each tissue was digested into single cell suspensions, enriched for immune cells, and sorted for scRNA-seq. Analysis was performed in Seurat v3 including clustering, integration, and differential expression. Multi-parameter flow cytometry was used for validation of scRNA-seq results. Lymphocytic choriomeningitis virus (LCMV) Clone 13, which produces a systemic, chronic, and neurotropic infection, was used to validate scRNA-seq and flow cytometry results in vivo.

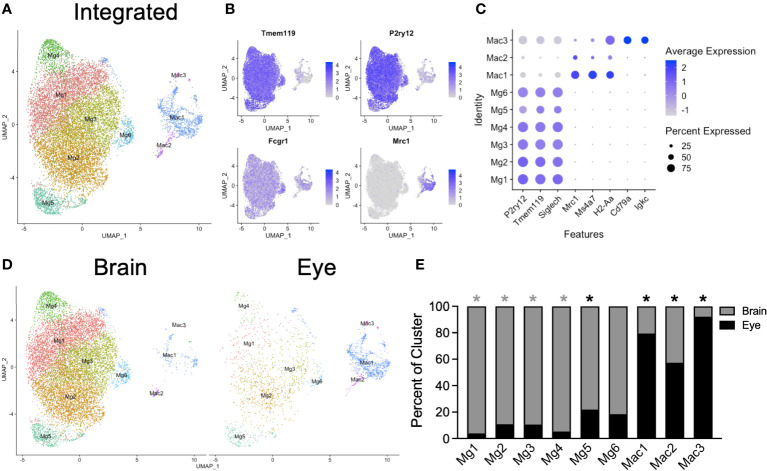
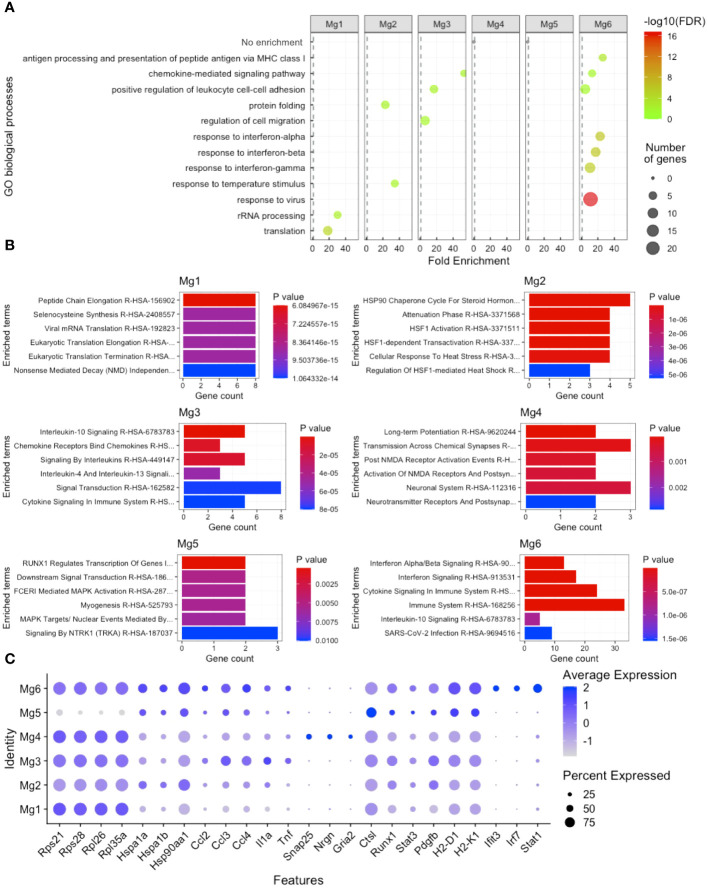
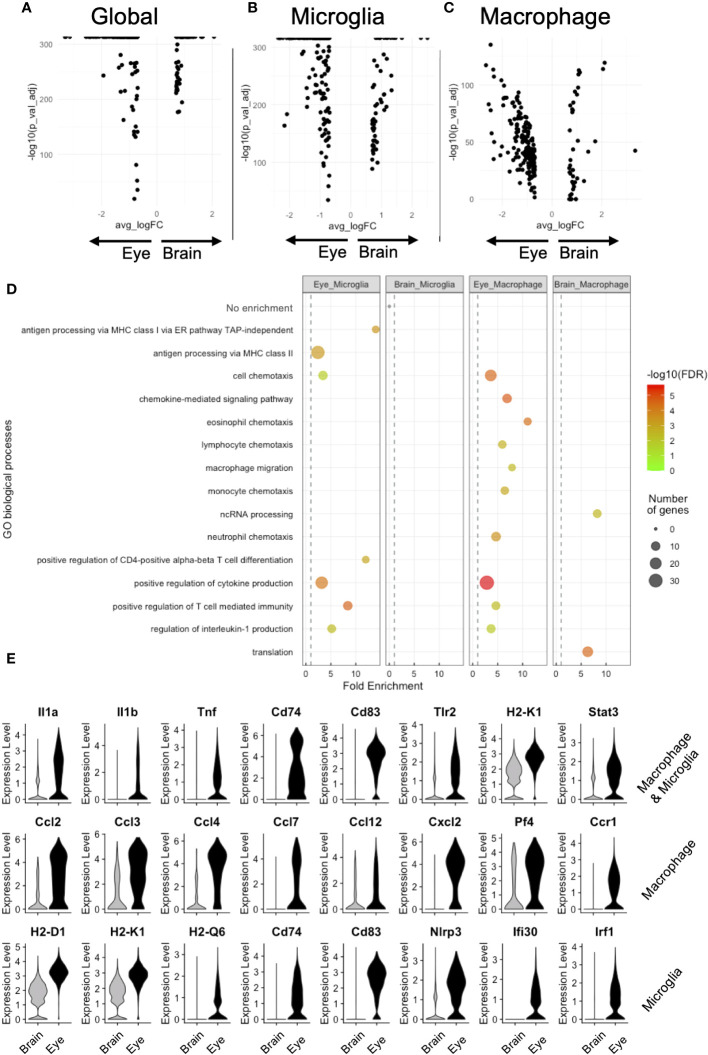
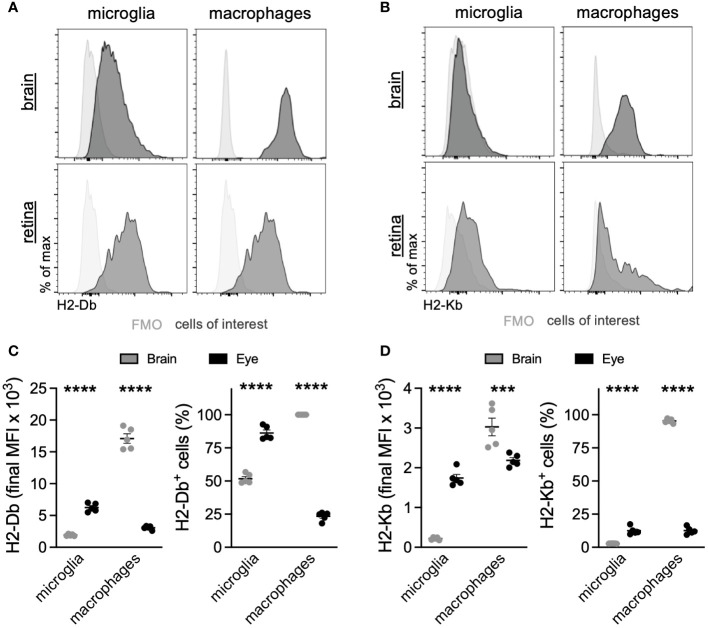
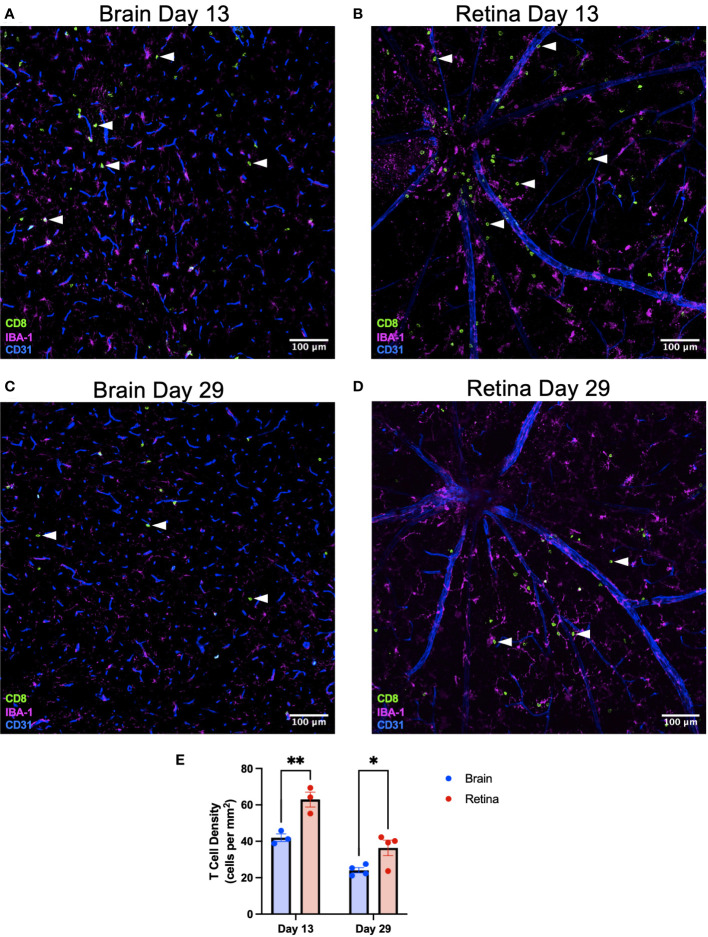
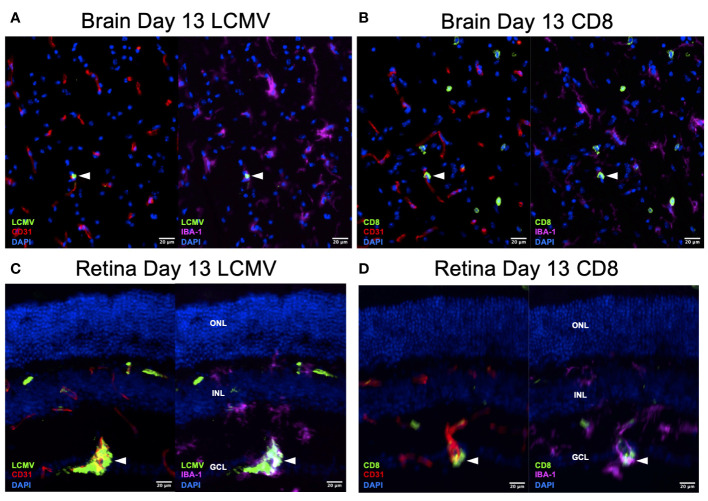
Results: Cluster analysis of integrated gene expression data from eye and brain identified 6 Tmem119 + P2ry12 + microglial clusters. Differential expression analysis revealed that eye microglia were enriched for more pro-inflammatory processes including antigen processing via MHC class I (14.0-fold, H2-D1 and H2-K1) and positive regulation of T-cell immunity (8.4-fold) compared to brain microglia. Multi-parameter flow cytometry confirmed that retinal microglia expressed 3.2-fold greater H2-Db and 263.3-fold more H2-Kb than brain microglia. On Day 13 and 29 after LCMV infection, CD8+ T-cell density was greater in the retina than the brain.

Discussion: Our data demonstrate that the microenvironment of retina and brain differs, resulting in microglia-specific gene expression changes. Specifically, retinal microglia express greater MHC class I by scRNA-seq and multi-parameter flow cytometry, resulting in a possibly enhanced capability to stimulate CD8+ T-cell inflammation during LCMV infection. These results may explain tissue-specific differences between retina and brain during systemic viral infections and CD8+ T-cell driven autoimmune disease.

Keywords: MHC class I; antigen presentation; brain; microenvironment; microglia; retina.


Conflict of interest statement

JL is a consultant for Line 6 Biotechnology and Genentech. JAL received research grant support from Therini Bio. The remaining authors declare that the research was conducted in the absence of any commercial or financial relationships that could be construed as a potential conflict of interest. The author(s) declared that they were an editorial board member of Frontiers, at the time of submission. This had no impact on the peer review process and the final decision.

Figures

Figure 1
Figure 1
Unintegrated scRNA-seq analysis of brain and eye CD45+ immune cells. (A) Dimensionality reduction with uniform manifold approximation and projection (UMAP) for the brain. (B) Canonical marker genes are displayed for brain microglia and macrophage clusters in feature plots. (C) Canonical marker genes are displayed for each cellular cluster in the brain in a dot plot. (D) Dimensionality reduction with UMAP for the eye. (E) Canonical marker genes are displayed for eye microglia and macrophage clusters in feature plots. (F) Canonical marker genes are displayed for each cellular cluster in the eye in a dot plot. Mg, microglia; Mac, macrophage; CM, classical monocyte; NCM, nonclassical monocyte; DC, dendritic cell; PMN, polymorphonuclear neutrophil; NK cell, natural killer cell.
Figure 2
Figure 2
Integrated scRNA-seq analysis of brain and eye macrophages. (A) Dimensionality reduction with UMAP for integrated macrophage data. (B) Canonical marker genes are displayed for brain microglia and macrophage clusters in feature plots. (C) Canonical marker genes are displayed for each cellular cluster in a dot plot. (D) The contribution of the experimental tissue to each cluster is visualized in the faceted UMAP plot. (E) The contribution of each to the two tissue clusters is visualized with a stacked bar chart. Mg, microglia; Mac, macrophage. * p<0.05. Color of asterisk indicates eye vs brain.
Figure 3
Figure 3
Microglia heterogeneity analysis. (A) Gene ontology (GO) enrichment of cluster-based DE genes. (B) Enrichr pathway analysis of cluster-based DE genes. (C) Dot plot visualization of cluster-based DE genes driving GO and pathway enrichment. FDR, false-discovery rate.
Figure 4
Figure 4
DE analysis demonstrates greater antigen presentation via MHC class I and inflammation in eye microglia compared to brain microglia. Volcano plots for global (A), microglia (B), and macrophage (C) DE genes. (D) GO enrichment of DE genes for eye and brain microglia subsets. (E) Violin plot visualization of DE genes associated with GO processes. FDR, false-discovery rate.
Figure 5
Figure 5
Retinal microglia express greater MHC class I than brain microglia. Representative multiparameter flow cytometry histograms of H2-Db (A) and H2-Kb (B) from the brain and retina. Retinal microglia express greater H2-Db (C) and H2-Kb (D) than brain microglia by both mean fluorescence intensity (MFI) and percent of cells using fluorescence minus one (FMO) controls to define positive staining. *** p < 0.001; **** p < 0.0001. N = 5 mice per group.
Figure 6
Figure 6
CD8+ T-cell density is greater in the retina than the brain after systemic LCMV clone 13 infection. Representative immunofluorescence image of a ×20 brain section identifying CD8+ T cells with white arrowheads on day 13 (A) and day 29 (C) postinfection. Scale bars are 100 µm. Representative immunofluorescence image of a ×20 retinal flat-mount section identifying CD8+ T cells with white arrowheads on day 13 (B) and day 29 (D) postinfection. (E) CD8+ T-cell density is greater in the retina than the brain on days 13 and 29. * p < 0.05; ** p < 0.01. N = 3–4 mice per group.
Figure 7
Figure 7
LCMV staining on Day 13 confirms active viral infection. (A, B) Immunofluorescence images of ×20 serial brain sections showing LMCV particles in close proximity to macrophages, endothelial cells, and CD8+ T cells (white arrowheads) on day 13. Scale bars are 20 µm. (C, D) Immunofluorescence images of ×20 serial retinal sections showing LMCV particles in close proximity to macrophages, endothelial cells, and CD8+ T cells (white arrowheads) on day 13. Scale bars are 20 µm. ONL, outer nuclear layer; INL, inner nuclear layer; GCL, ganglion cell layer.

References

    1. O’Koren EG, Yu C, Klingeborn M, Wong AYW, Prigge CL, Mathew R, et al. . Microglial function is distinct in different anatomical locations during retinal homeostasis and degeneration. Immunity. (2019) 50:1–23. doi: 10.1016/j.immuni.2019.02.007 - DOI - PMC - PubMed
    1. Ginhoux F, Greter M, Leboeuf M, Nandi S, See P, Gokhan S, et al. . Fate mapping analysis reveals that adult microglia derive from primitive macrophages. Science. (2010) 330:841–5. doi: 10.1126/science.1194637 - DOI - PMC - PubMed
    1. Kaiser T, Feng G. Tmem119-EGFP and tmem119-creERT2 transgenic mice for labeling and manipulating microglia. eNeuro. (2019) 6:1–18. doi: 10.1523/eneuro.0448-18.2019 - DOI - PMC - PubMed
    1. Su N, März S, Plagemann T, Cao J, Schnittler H-J, Eter N, et al. . Occurrence of transmembrane protein 119 in the retina is not restricted to the microglia: an immunohistochemical study. Trans Vis Sci Tech. (2019) 8:29–11. doi: 10.1167/tvst.8.6.29 - DOI - PMC - PubMed
    1. McKinsey GL, Lizama CO, Keown-Lang AE, Niu A, Santander N, Larpthaveesarp A, et al. . A new genetic strategy for targeting microglia in development and disease. Elife. (2020) 9:e54590. doi: 10.7554/eLife.54590 - DOI - PMC - PubMed

MeSH terms

Substances