. 2024 May 3;27(6):109863.
doi: 10.1016/j.isci.2024.109863. eCollection 2024 Jun 21.

Ablation of Atp5if1 impairs metabolic reprogramming and proliferation of T lymphocytes and compromises mouse survival

Affiliations

Ablation of Atp5if1 impairs metabolic reprogramming and proliferation of T lymphocytes and compromises mouse survival

Inés Romero-Carramiñana et al. iScience. .

Abstract

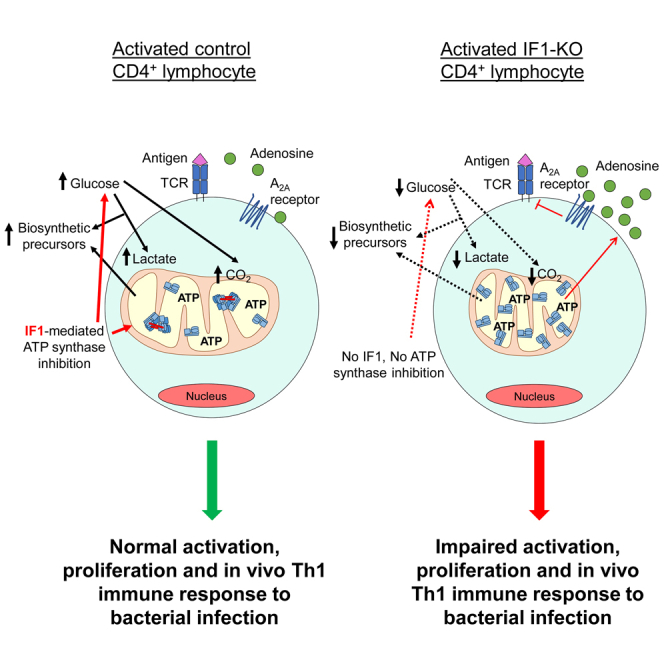
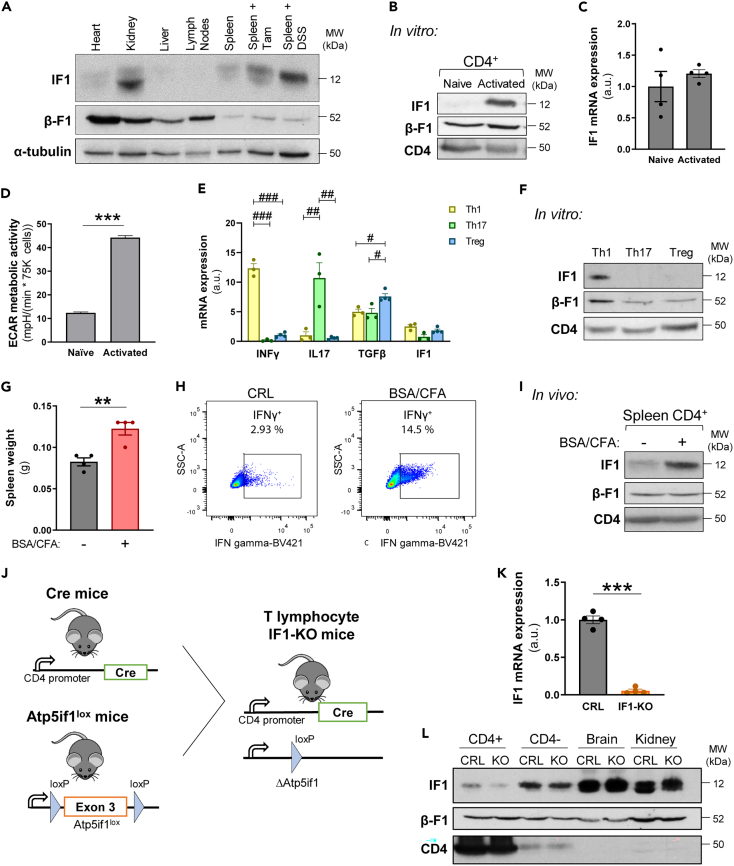
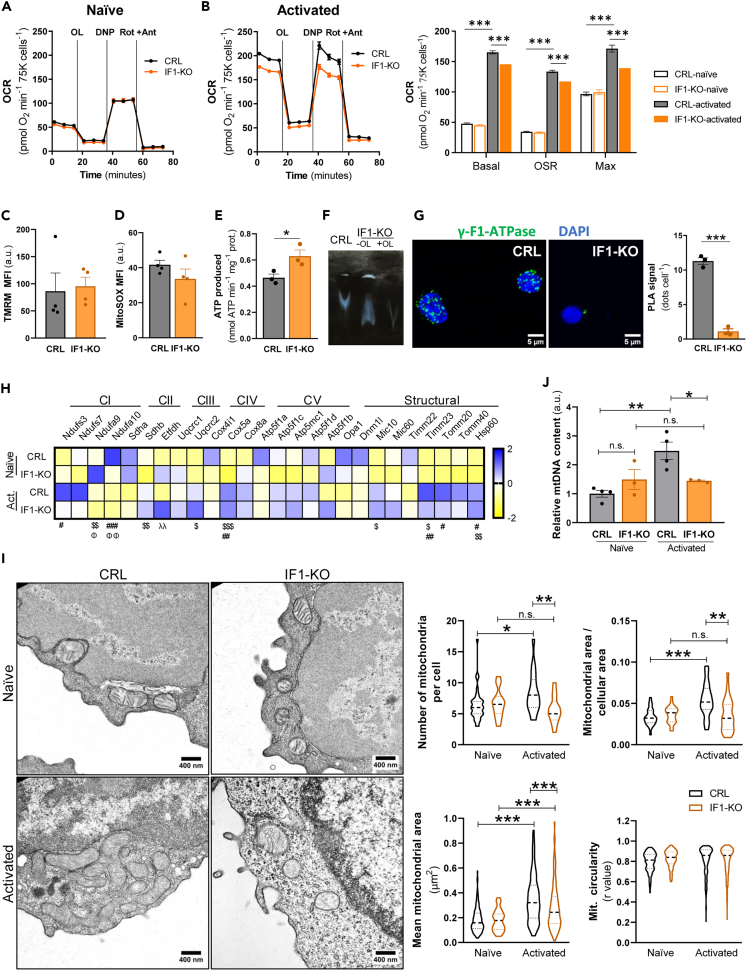
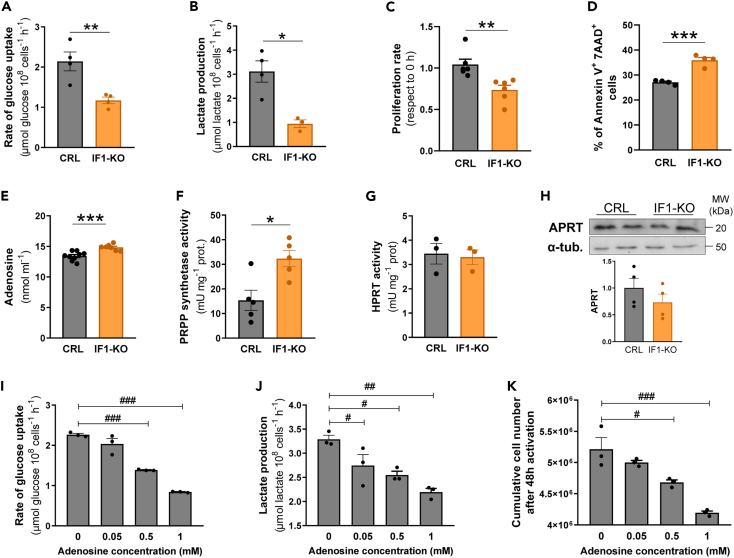
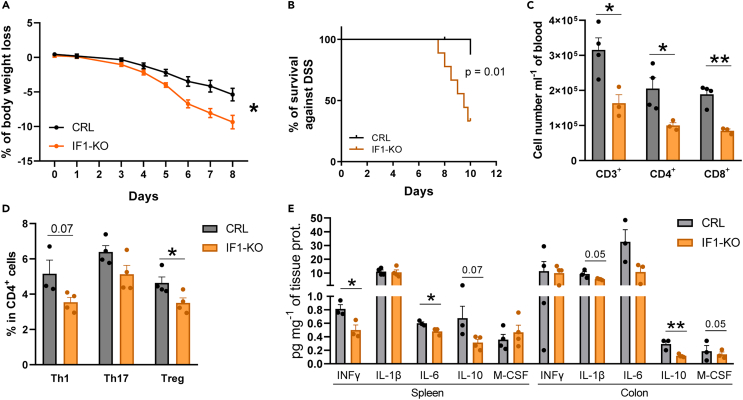
T cells experience metabolic reprogramming to an enhanced glycolysis upon activation. Herein, we have investigated whether ATPase Inhibitory Factor 1 (IF1), the physiological inhibitor of mitochondrial ATP synthase, participates in rewiring T cells to a particular metabolic phenotype. We show that the activation of naive CD4+ T lymphocytes both in vitro and in vivo is accompanied by a sharp upregulation of IF1, which is expressed only in Th1 effector cells. T lymphocytes of conditional CD4+-IF1-knockout mice display impaired glucose uptake and flux through glycolysis, reducing the biogenesis of mitochondria and cellular proliferation after activation. Consequently, mice devoid of IF1 in T lymphocytes cannot mount an effective Th1 response against bacterial infection compromising their survival. Overall, we show that the inhibition of a fraction of ATP synthase by IF1 regulates metabolic reprogramming and functionality of T cells, highlighting the essential role of IF1 in adaptive immune responses.

Keywords: Biological sciences; Immunology; Molecular biology; Physiology.


Conflict of interest statement

The authors declare no competing interests.

Figures

None
Graphical abstract
Figure 1
Figure 1
Expression of IF1 in T cells and development of IF1-KO mice in CD4+ lymphocytes (A) Representative blot of IF1 and β-F1-ATPase expression in mouse tissue extracts of heart, kidney, liver, lymph nodes and spleen, and in spleen of mice treated with tamoxifen (Tam) or dextran sodium sulfate (DSS). α-tubulin is shown as loading control. (B) Representative blot of IF1 and β-F1-ATPase expression in naive and in vitro activated CD4+ mouse lymphocytes. CD4 is shown as loading control. (C) Quantification of IF1 mRNA levels in naive and activated CD4+ lymphocytes (n = 4). (D) Extracellular acidification rates (ECAR) of naive and activated CD4+ lymphocytes (n = 3). B–D, In vitro activation of CD4+ lymphocytes was performed by incubating the cells with anti-CD3 and anti-CD28 during 48 h. (E) Quantification of mRNA levels of IFNγ, IL17, TGFβ and IF1 in CD4+ lymphocytes polarized to the Th1, Th17 or Treg subsets (n = 3–4). (F) Representative blot of IF1 and β-F1-ATPase expression in CD4+ lymphocytes polarized to the Th1, Th17 or Treg subsets. CD4 is shown as loading control. (G) Spleen weight of mice 10 days after immunization with PBS (−) or BSA/CFA (n = 4). (H) Representative plots of the percentage of IFNγ+ immune cells (CD45+) in the spleen of mice 10 days after PBS (−) or BSA/CFA (+) injection. (I) Representative blot of IF1 and β-F1-ATPase expression in CD4+ lymphocytes 10 days after PBS (−) or BSA/CFA (+) injection. CD4 is shown as loading control. (J) Schematic of the generation of the CD4+-IF1-KO mouse model. IF1-KO mice in CD4+ lymphocytes were obtained by breeding CD4-Cre with IF1-floxed mouse lines. (K) Histograms show the quantification of IF1 mRNA levels in CRL and IF1-KO CD4+ lymphocytes (n = 4). (L) Representative blot of IF1 and β-F1-ATPase expression in extracts of CD4+ cells, immune CD4 cells, brain and kidney of CRL and CD4+-IF1-KO mice. The histograms show the mean and the error bars ±SEM. ∗∗p ≤ 0.01; ∗∗∗p ≤ 0.001 when compared to PBS (−) or CRL by Student’s t test. #p ≤ 0.05; ##p ≤ 0.01; ###p ≤ 0.001 when compared by one-way ANOVA test and the Tukey multiple comparison test. See also Figure S1.
Figure 2
Figure 2
The biogenesis of mitochondria is restrained in activated CD4+ IF1-KO lymphocytes (A and B) Profiles of oxygen consumption rates (OCR) of naive (a) (n = 3) and activated (b) (n = 3) murine CRL and IF1-KO CD4+ lymphocytes using glucose as respiratory substrate. The addition of oligomycin (OL), 2,4-dinitrophenol (DNP) and rotenone (Rot) plus antimycin A (Ant) is indicated. (B) Histogram shows the quantification of basal, oligomycin-sensitive (OSR) and maximal respiration rates of CRL and IF1-KO naive and activated CD4+ lymphocytes. (C) Mitochondrial membrane potential in CRL and IF1-KO activated CD4+ lymphocytes (n = 4). MFI, mean fluorescent intensity. (D) Mitochondrial reactive oxygen species (mtROS) production in CRL and IF1-KO activated CD4+ lymphocytes (n = 4). (E) Histogram shows the rate of ATP production per mg of cellular protein in digitonin-permeabilized CRL and IF1-KO activated CD4+ lymphocytes (n = 3). (F) Representative ATP hydrolytic activity of complex V in CN-PAGE gels of CRL and IF1-KO activated CD4+ lymphocytes. Where indicated, 2 μM oligomycin (OL) was added in the sample to inhibit ATP hydrolysis. (G) Representative images of Proximity Ligation Assays (PLA) using γ-F1-ATPase as target (green dots) in CRL and IF1-KO activated CD4+ lymphocytes. DAPI (blue) stained nuclei. Histograms show the number of PLA signals per cell (n = 3). (H) Heatmap shows normalized Z-scores of mRNA levels of genes encoding different mitochondrial proteins in naive and activated CRL and IF1-KO CD4+ lymphocytes (n = 3–4). #p ≤ 0.05; ##p ≤ 0.01; ###p ≤ 0.001 when compared naive CRL vs. activated CRL; $p ≤ 0.05; $$p ≤ 0.01; $$$p ≤ 0.001 when compared naive CRL vs. naive IF1-KO; λλp ≤0.01; when compared activated CRL vs. activated IF1-KO; Φp ≤ 0.05; ΦΦp ≤0.01 when compared naive IF1-KO vs. activated IF1-KO by one-way ANOVA and Tukey multiple comparison test. (I) Representative electron micrographs of naive (upper panels) and activated (lower panels) CRL and IF1-KO CD4+ lymphocytes. Violin plots show the number of mitochondria per cell (n = 17–36), the mitochondrial area per cytoplasmatic surface (n = 17–28), the mean mitochondrial area (n = 59–256) and the mean mitochondrial circularity (n = 59–256) assessed in micrographs. (J) mtDNA copy number analysis in naive and activated CRL or IF1-KO CD4+ lymphocytes (n = 3–4). In vitro activation of CD4+ lymphocytes was performed by incubating the cells with anti-CD3 and anti-CD28 during 48 h. The profiles and histograms show the mean and the error bars ±SEM. n.s., no significant. ∗p ≤ 0.05; ∗∗∗p ≤ 0.001 when compared to CRL or naive by Student’s t test.
Figure 3
Figure 3
IF1-KO lymphocytes have restrained rates of glycolysis and proliferation upon activation (A) Rates of glucose uptake in CRL and IF1-KO activated CD4+ lymphocytes (n = 4). (B) Rates of lactate production in CRL (n = 4) and IF1-KO (n = 3) activated CD4+ lymphocytes. (C) Proliferation rates of CRL and IF1-KO CD4+ lymphocytes after 24 h of activation (n = 6). (D) Percentage of dead (AnnexinV+/7AAD+) CRL and IF1-KO CD4+ lymphocytes after 48 h of activation (n = 4). (E) Determination of adenosine released into the culture medium of CRL (n = 9) and IF1-KO (n = 7) CD4+ lymphocytes after 48 h of activation. (F and G) Activities of phosphoribosyl pyrophosphate synthetase (PRPP synthetase) (f) (n = 5) and hypoxanthine-guanine phosphoribosyl transferase (HPRT) (n = 3) (k) in CRL and IF1-KO activated CD4+ lymphocytes. (H) Representative blot of the expression of adenine phosphoribosyl transferase (APRT) in CRL and IF1-KO activated CD4+ lymphocytes. α-tubulin is shown as loading control. Histogram shows the expression level relative to α-tubulin (n = 4). (I–K) Rates of glucose uptake (i), lactate production (j) and proliferation (k) in CRL CD4+ lymphocytes treated with the indicated doses of adenosine during activation (n = 3). In vitro activation of CD4+ lymphocytes was performed by incubating the cells with anti-CD3 and anti-CD28 during 48 h. The histograms show the mean and the error bars ±SEM. ∗p ≤ 0.05; ∗∗p ≤ 0.01; ∗∗∗p ≤ 0.001 when compared to CRL by Student’s t test. #p ≤ 0.05; ##p ≤ 0.01; ###p ≤ 0.001 when compared by one-way ANOVA and Tukey multiple comparison test.
Figure 4
Figure 4
Survival of CD4+-IF1-KO mice is compromised in response to bacterial infection due to a restrained adaptive immune response (A) Progressive weight change of CRL (n = 5) and IF1-KO (n = 4) mice treated with 2.5% dextran sodium sulfate (DSS) in the drinking water for nine days. (B) Kaplan–Meier survival analysis of CRL (n = 9) and IF1-KO mice (n = 9) after treatment with 2.5% DSS in the drinking water. The p-value of the log rank test is shown. (C) Number of CD3+ (CD3+;CD45+;DAPI), CD4+ (CD4+;CD45+;DAPI) and CD8+ (CD8+;CD45+;DAPI) cells in the blood of CRL and IF1-KO mice after 6-day treatment with 2.5% DSS (n = 3–4). (D) Percentage of Th1 (INFγ+;CD4+;CD45+), Th17 (IL17+;CD4+;CD45+) and Treg (FoxP3+;CD4+;CD45+) cells in the blood of CRL and IF1-KO mice after 6-day treatment with 2.5% DSS (n = 3–4). (E) Multiplexed quantitative analysis of cytokines and chemokines. Histograms show the mean and the error bars ±SEM of cytokine levels in the spleen and colon of CRL and IF1-KO mice after 6-day treatment with 2.5% DSS (n = 3–4). ∗p ≤ 0.05; ∗∗p ≤ 0.01 when compared to CRL by Student’s t test. See also Table S1.

Similar articles

Cited by

References

    1. Boyer P.D. The ATP synthase. A splendid molecular machine. Annu. Rev. Biochem. 1997;66:717–749. - PubMed
    1. Walker J.E. The ATP synthase: the understood, the uncertain and the unknown. Biochem. Soc. Trans. 2013;41:1–16. - PubMed
    1. Campanella M., Casswell E., Chong S., Farah Z., Wieckowski M.R., Abramov A.Y., Tinker A., Duchen M.R. Regulation of mitochondrial structure and function by the F1Fo-ATPase inhibitor protein, IF1. Cell Metab. 2008;8:13–25. - PubMed
    1. Kuhlbrandt W. Structure and Mechanisms of F-Type ATP Synthases. Annu. Rev. Biochem. 2019;88:515–549. - PubMed
    1. Frezza C., Cipolat S., Martins de Brito O., Micaroni M., Beznoussenko G.V., Rudka T., Bartoli D., Polishuck R.S., Danial N.N., De Strooper B., Scorrano L. OPA1 controls apoptotic cristae remodeling independently from mitochondrial fusion. Cell. 2006;126:177–189. - PubMed