. 2024 May 7;27(6):109929.
doi: 10.1016/j.isci.2024.109929. eCollection 2024 Jun 21.

Islet cell stress induced by insulin-degrading enzyme deficiency promotes regeneration and protection from autoimmune diabetes

Affiliations

Islet cell stress induced by insulin-degrading enzyme deficiency promotes regeneration and protection from autoimmune diabetes

Shuaishuai Zhu et al. iScience. .

Abstract

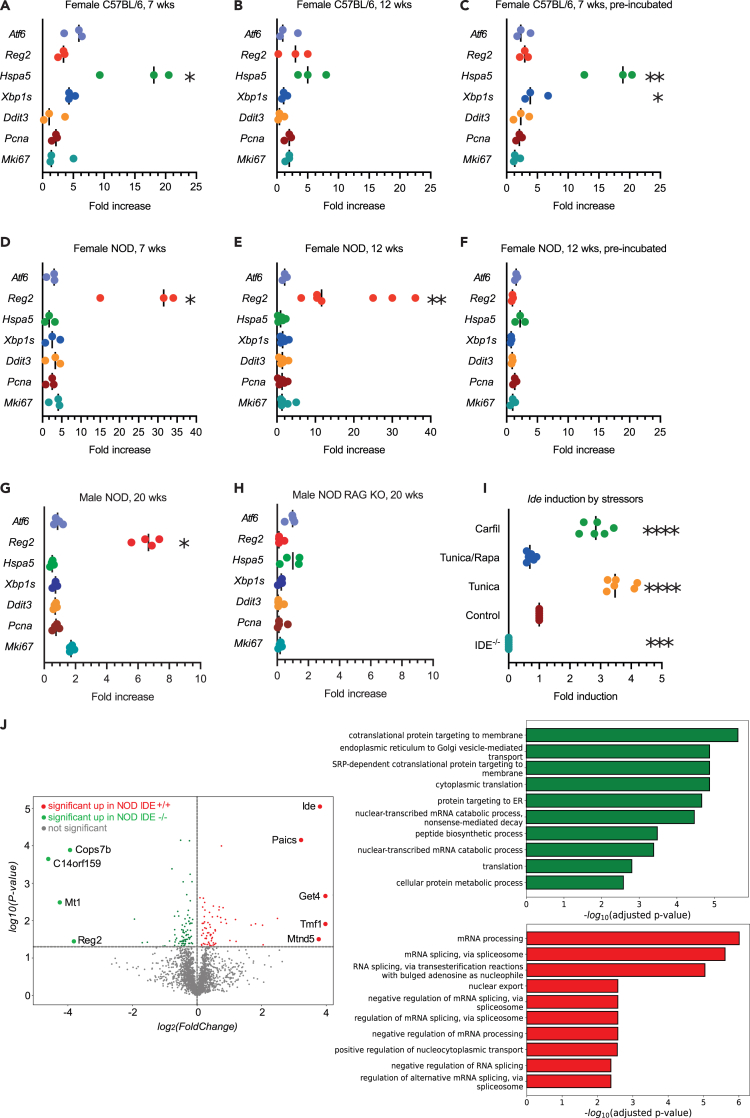
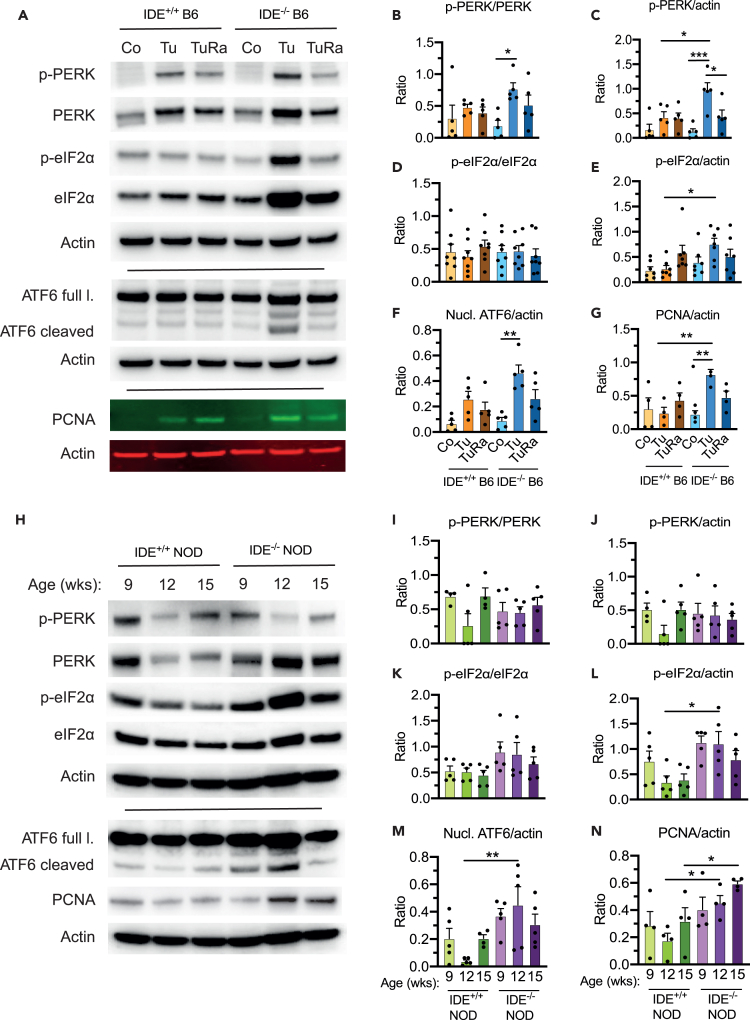
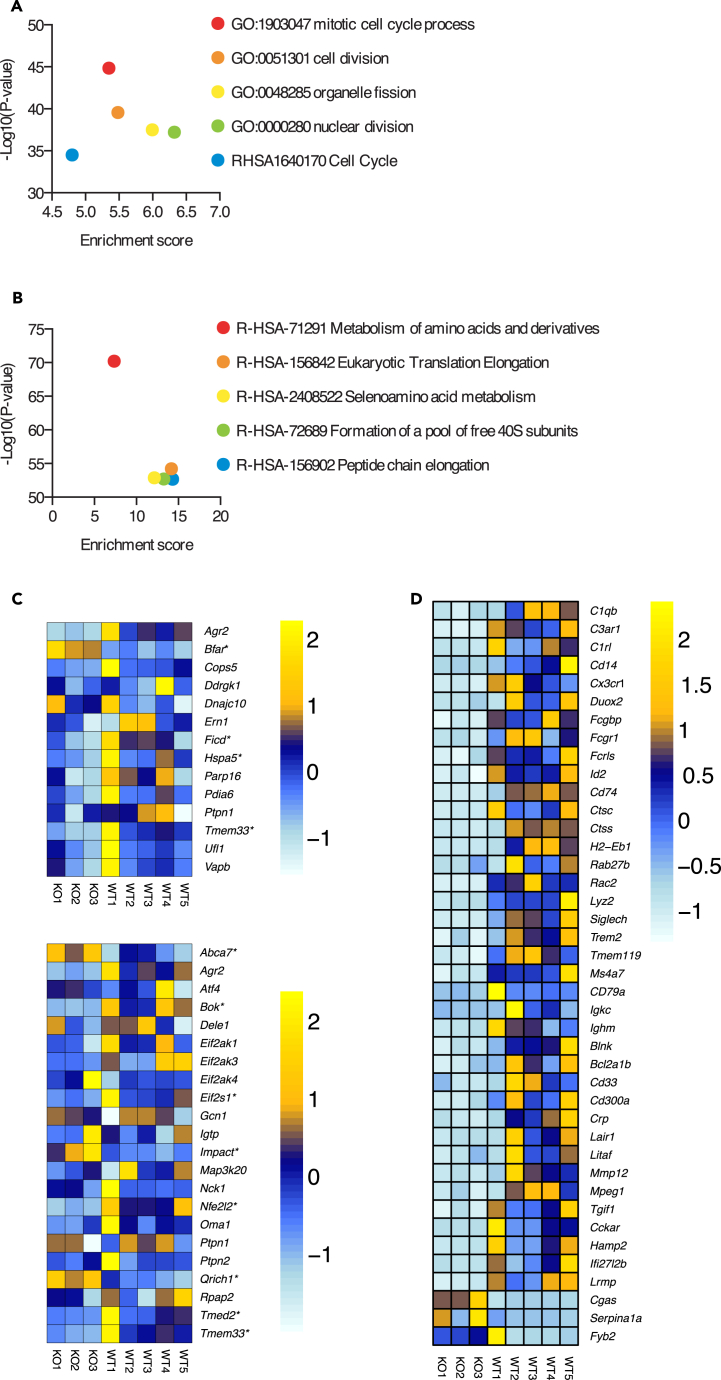
Tuning of protein homeostasis through mobilization of the unfolded protein response (UPR) is key to the capacity of pancreatic beta cells to cope with variable demand for insulin. Here, we asked how insulin-degrading enzyme (IDE) affects beta cell adaptation to metabolic and immune stress. C57BL/6 and autoimmune non-obese diabetic (NOD) mice lacking IDE were exposed to proteotoxic, metabolic, and immune stress. IDE deficiency induced a low-level UPR with islet hypertrophy at the steady state, rapamycin-sensitive beta cell proliferation enhanced by proteotoxic stress, and beta cell decompensation upon high-fat feeding. IDE deficiency also enhanced the UPR triggered by proteotoxic stress in human EndoC-βH1 cells. In Ide-/- NOD mice, islet inflammation specifically induced regenerating islet-derived protein 2, a protein attenuating autoimmune inflammation. These findings establish a role of IDE in islet cell protein homeostasis, demonstrate how its absence induces metabolic decompensation despite beta cell proliferation, and UPR-independent islet regeneration in the presence of inflammation.

Keywords: Molecular biology; Physiology; Proteomics; Transcriptomics.


Conflict of interest statement

The authors declare no competing interests.

Figures

None
Graphical abstract
Figure 1
Figure 1
Beta cell function in Ide−/− C57BL/6J and NOD mice (A) Ide+/+ and Ide−/− NOD mice aged 14 weeks were subjected to an OGTT and glycemia was measured at indicated time points before (0 min) or after the glucose bolus. Data are mean values ±SEM of 15 independent mice for each group. (B) Insulinemia during the OGTT as measured by ELISA. Data are mean values ±SEM of 15 independent mice for each group. (C) Hand-picked islets obtained from female Ide+/+ and Ide−/− NOD mice aged 8 weeks were counted in three separate experiments. Data are mean values ±SEM of 19 independent mice for each group. (D) Following 90 min incubation without glucose, hand-picked islets from 10-week-old Ide−/− and Ide+/+ NOD mice were sequentially incubated for 1 h in 2.8- and 28-mM glucose, and glucose-stimulated insulin secretion (GSIS) into the supernatant was quantified by commercial ELISA. Data are mean values ±SEM of 6 mice for each group. (E) The volume of hand-picked islets from female C57BL/6 and NOD mice aged 8 weeks was calculated with Icy Software. Data are mean values ±SEM of an average of 15 mice for each group. Data in A-E were evaluated by Student’s t test, ∗p < 0.05, ∗∗p < 0.01, ∗∗∗p < 0.001. (F) As in E but assessing the volume of islets of C57BL/6 Ide+/+ and Ide−/− mice of different age. N = 8 per group. (G) The amount of IAPP in the serum of female mice of different age was quantified by ELISA. Data are mean values ±SEM of 4 independent mice for each group. ∗∗∗p < 0.001 by Student’s t test. (H) Ide+/+ NOD and back-cross 10 Ide−/− NOD mice were monitored weekly for glycosuria until 29 weeks of age. Data are mean values ±SEM. N = 63 for female Ide+/+, 57 for female Ide−/−, 24 for male Ide+/+, 29 for male Ide−/− mice. ∗∗∗p < 0.001 by Kaplan-Meier, log rank (Mantel-Cox) test. (I) Islets of pre-diabetic female Ide+/+ and Ide−/− mice of different age were stained with hematoxylin/eosin and scored for insulitis. Score 0, no infiltration; 1, peri-insulitis; 2, moderate intra-insulitis (<50% of islet surface); 3, severe insulitis (>50 of surface and/or loss of islet architecture). Between 190 and 350 islets were counted for each group.
Figure 2
Figure 2
UPR effector mRNA and global protein expression by Ide−/ islet cells (A–H) mRNA expression levels, as measured by RT-qPCR, of genes linked to the UPR (Atf6, Hspa5, Xbp1s, Ddit3), to regeneration (Reg2) or to proliferation (Pcna, Mki67) in steady state islets from Ide+/+ and Ide−/− C57BL/6 and NOD mice of different ages, as indicated. Results are expressed as fold change, i.e., the ratio of expression in Ide−/− relative to Ide+/+ islets. Islets were either analyzed immediately after isolation or after overnight culture in RPMI medium, as indicated. Each dot represents islets from one mouse. Data in A–H were evaluated by Mann-Whitney tests with Bonferroni correction for multiple comparisons. p < 0.05, ∗∗p < 0.01, ∗∗∗p < 0.001, ∗∗∗∗p < 0.0001. (I) Ide+/+ or control Ide−/− NOD mice aged 10 weeks were injected for 2 weeks with carfilzomib or for 2 days with tunicamycin with or without addition of rapamycin before isolation of islets and quantification of Ide mRNA expression by RT-qPCR. Data were evaluated by two-way ANOVA with Dunnett’s multiple comparison correction. ∗∗∗p < 0.001, ∗∗∗∗p < 0.0001. (J) Proteomic analysis of islet proteins from 3 Ide+/+ and 3 Ide−/− mice aged 10 weeks. Left: volcano plot showing the proteins up- (in green) and down- (in red) regulated in Ide−/− NOD islets. The horizontal dashed line represents the significance threshold (p-value <0.05) (for details see Table S1). Right: Barplot representing the Gene Ontology Biological Process (GO BP) terms enriched using enrichR software and the GO Biological Process 2021 database. In green are the TOP10 GO BP terms enriched using the up-regulated proteins in Ide−/− and in red the TOP10 GO BP terms enriched using the up-regulated proteins in Ide+/+ islets for analysis. A log-transformed adjusted p-value was used for TOP10 ranking (for details see Table S2).
Figure 3
Figure 3
Immunoblot analysis of UPR effector activation (A) Representative immunoblots showing the expression pattern of phosphorylated PERK, total PERK, phosphorylated eIF2α, total eIF2α, ATF6, cleaved ATF6, and PCNA in islet lysates of C57BL/6 Ide+/+ and Ide−/− mice treated by tunicamycin injection i.p., combined with rapamycin or not, for 48 h. (B–G) quantification of experiments performed as shown in (A), N = 5 in (B), 5 in (C), 8 in (D), 7 in (E), 5 in (F) and 4 in (G). Data represent the ratio of Ide−/− to Ide+/+ islets, are represented as mean ± SEM and were evaluated by Student’s t test in B-F and by ANOVA with Tukey’s correction for multiple comparisons in (G). ∗p < 0.05, ∗∗p < 0.02. (H) Representative protein immunoblots as in A but for steady state islets from Ide+/+ and Ide−/− NOD mice aged 9, 12 or 15 weeks. (I–N) quantification of experiments performed as shown in (H). N = 5 for panels I-M and 4 for N. Data are represented as mean ± SEM and were evaluated by Student’s t test; ∗p < 0.05.
Figure 4
Figure 4
Effect of IDE deficiency on expression of inflammatory genes (A) RT-qPCR analysis of relative Tnfa, Il1b, Oas3, and Ifi47 expression in islets of female Ide+/+ and Ide−/− NOD mice aged 4 to 15 weeks. Results represent the ratio of expression in Ide−/− relative to Ide+/+ islets and are mean values ±SEM of 3–6 independent mice for each group. ∗p < 0.05, ∗∗p < 0.02, and ∗∗∗p < 0.01 by Student’s t test. (B) mRNA expression of the indicated genes in the islets of Ide−/− relative to Ide+/+ NOD mice treated with tunicamycin for 48 h. Data are mean values ±SEM of 8 independent mice for each group. ∗p < 0.05, ∗∗p < 0.02, and ∗∗∗p < 0.01 by Student’s t test for panels A and B. (C) mRNA expression of the indicated genes in Ide−/− relative to Ide+/+ islets from C57BL/6 mice aged 15 to 25 weeks treated with tunicamycin for 48 h. Data are mean values ±SEM of 6 independent mice for each group. ∗p < 0.05, ∗∗p < 0.02, and ∗∗∗p < 0.01 by ANOVA test with Tukey’s correction.
Figure 5
Figure 5
Effect of IDE deficiency on the metabolic and UPR response to HFD Seven-week-old female Ide−/− and Ide+/+ C57BL/6J mice were fed a standard chow or HFD for 7 weeks. N = 10 per group. (A) Representative appearance of Ide+/+ and Ide−/− mice at sacrifice. (B) Body weight was recorded once a week. Data are mean values ±SEM. Statistical significance is indicated in the insert. (C–F) Serum insulin and proinsulin levels and total insulin and proinsulin content in islets were determined for Ide−/− and Ide+/+ mice at the time of sacrifice, N = 3–4 per group. (G) Non-fasting glucose concentrations were monitored weekly; N = 8 per group. (H–K) Expression levels of genes related to ER stress, proliferation, and regeneration, as measured by RT-qPCR, in islets obtained at sacrifice of Ide−/− and Ide+/+ mice fed standard chow or HFD, N = 8. Results are expressed as ratio of expression as indicated: H, HFD vs. standard chow for Ide+/+ mice; I, HFD vs. standard chow for Ide−/− mice; J,Ide−/− vs. Ide+/+ for standard chow-fed; K,Ide−/− vs. Ide+/+ for HFD-fed mice. All panels show mean values ±SEM, plus individual data points in H–K. Statistical evaluation was performed by two-way ANOVA with Dunnett’s or Dunn’s correction for multiple comparisons. ∗p < 0.05, ∗∗p < 0.01, ∗∗∗p < 0.001, ∗∗∗∗p < 0.0001.
Figure 6
Figure 6
Effect of proteotoxic or metabolic stress and of IDE deficiency on islet cell proliferation (A) Representative images stained for insulin (green) and Ki67 (red) of islets of female Ide−/− or Ide+/+ NOD mice aged 12 weeks and treated for 2 days with tunicamycin and/or rapamycin or solvent alone. (B) Number of Ki67 spots per volume for the conditions indicated in (A). N = 3 per group, with an average of 40 islets per mouse counted. (C) Ide−/− and Ide+/+ NOD mice aged 12 weeks were treated for 2 days as in (A), however using tunicamycin alone or combined with salubrinal. Quantitative evaluation as in (B). N = 6 per group. (D) Representative images, stained for insulin and Ki67, showing islets from Ide−/− and Ide+/+ C57BL/6 mice aged 14 weeks, after an HFD or standard diet for 7 weeks. (E) Quantitative evaluation as in (B) of the experiment shown in (D). N = 3 per group. (F) Female 7-week-old Ide+/+ and Ide−/− C57BL/6 mice were kept on a high-fat diet or standard chow for 8 weeks. Then the coefficient of proximity between insulin and Ki67 staining was calculated for 20 planes of 15 islets for each group. Statistical evaluation by Student’s t test. (G) EdU incorporation in insulin stained cells of Ide−/− and Ide+/+ C57BL/6 mice after treatment with tunicamycin for 2 days followed by administration of EdU for 1 h was quantified. N = 3 mice per group, with on average 55 islets per mouse evaluated. (H) Representative immunofluorescence images showing insulin expression and EdU incorporation in steady state islets from Ide−/− and Ide+/+ NOD mice aged 12 weeks. The arrows point to EdU+ beta cells. (I) Quantification of EdU+ beta cells in (H). N = 3 mice per group, with on average 66 islets per mouse counted. The numbers of Ki67+ spots in panels B, C, E and the numbers of EdU+ beta cells in G, I are represented as mean ± SEM. Statistical analysis was performed for panels B, C, E and G by two-way ANOVA with Sidak’s correction for multiple comparisons and for panel I by unpaired t-test. ∗p < 0.05, ∗∗p < 0.01, ∗∗∗p < 0.001, ∗∗∗∗p < 0.0001.
Figure 7
Figure 7
Expression of selected genes in Ide+/+ and Ide−/− islets of mice subjected to metabolic stress (A and B) Enriched pathways were calculated and clustered by adjusted p-values by automatic Metascape algorithm. Dot plots show the adjusted –Log10(p-value) and Enrichment score for the top 5 pathways specifically enriched in Ide−/−A and Ide+/+B samples. (C) Color heatmap (Z score) of genes from GO:0036498:IRE1-mediated unfolded protein response (top), and GO:0036499: PERK-mediated unfolded protein response and GO:140467:integrated stress response signaling (bottom). The asterisk ∗ marks differentially expressed genes between Ide−/− and Ide+/+ samples with an adjusted p-value <0.05. (D) Color heatmap (Z score) of key genes selected from the list of differentially expressed genes (adjusted p-value<0.01, l2fc > 2) and classified into general into immune system. See also Figure S6.

Update of

References

    1. Roden M., Shulman G.I. The integrative biology of type 2 diabetes. Nature. 2019;576:51–60. doi: 10.1038/s41586-019-1797-8. - DOI - PubMed
    1. Wang J., Yang X., Zhang J. Bridges between mitochondrial oxidative stress, ER stress and mTOR signaling in pancreatic β cells. Cell. Signal. 2016;28:1099–1104. doi: 10.1016/j.cellsig.2016.05.007. - DOI - PubMed
    1. Ardestani A., Lupse B., Kido Y., Leibowitz G., Maedler K. mTORC1 Signaling: A Double-Edged Sword in Diabetic β Cells. Cell Metab. 2018;27:314–331. doi: 10.1016/j.cmet.2017.11.004. - DOI - PubMed
    1. Cnop M., Ladriere L., Hekerman P., Ortis F., Cardozo A.K., Dogusan Z., Flamez D., Boyce M., Yuan J., Eizirik D.L. Selective inhibition of eukaryotic translation initiation factor 2 alpha dephosphorylation potentiates fatty acid-induced endoplasmic reticulum stress and causes pancreatic beta-cell dysfunction and apoptosis. J. Biol. Chem. 2007;282:3989–3997. doi: 10.1074/jbc.M607627200. - DOI - PubMed
    1. Engin F., Yermalovich A., Nguyen T., Hummasti S., Fu W., Eizirik D.L., Mathis D., Hotamisligil G.S. Restoration of the unfolded protein response in pancreatic β cells protects mice against type 1 diabetes. Sci. Transl. Med. 2013;5 doi: 10.1126/scitranslmed.3006534. - DOI - PMC - PubMed