

doi: 10.1021/acscentsci.3c01629.
eCollection 2024 May 22.
The Open DAC 2023 Dataset and Challenges for Sorbent Discovery in Direct Air Capture
Affiliations
- PMID: 38799660
- PMCID: PMC11117325
- DOI: 10.1021/acscentsci.3c01629
Item in Clipboard
The Open DAC 2023 Dataset and Challenges for Sorbent Discovery in Direct Air Capture
ACS Cent Sci.
.
Abstract
Direct air capture (DAC) of CO2 with porous adsorbents such as metal-organic frameworks (MOFs) has the potential to aid large-scale decarbonization. Previous screening of MOFs for DAC relied on empirical force fields and ignored adsorbed H2O and MOF deformation. We performed quantum chemistry calculations overcoming these restrictions for thousands of MOFs. The resulting data enable efficient descriptions using machine learning.
Published 2024 by American Chemical Society.
Conflict of interest statement
The authors declare no competing financial interest.
Figures
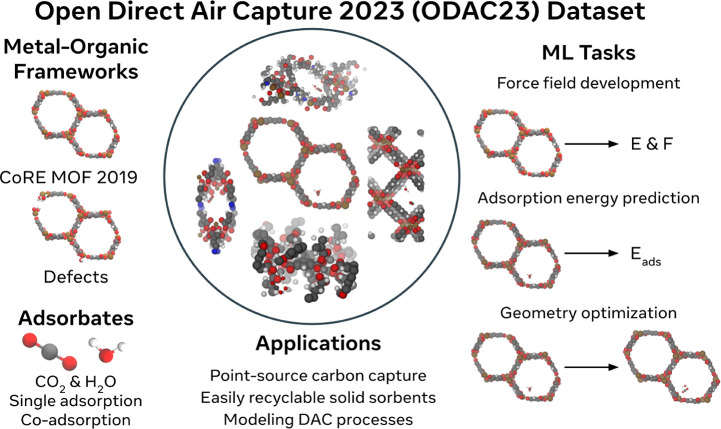
Materials,
adsorbates, tasks, and potential applications of the ODAC23 dataset.
Images are randomly sampled from the dataset.
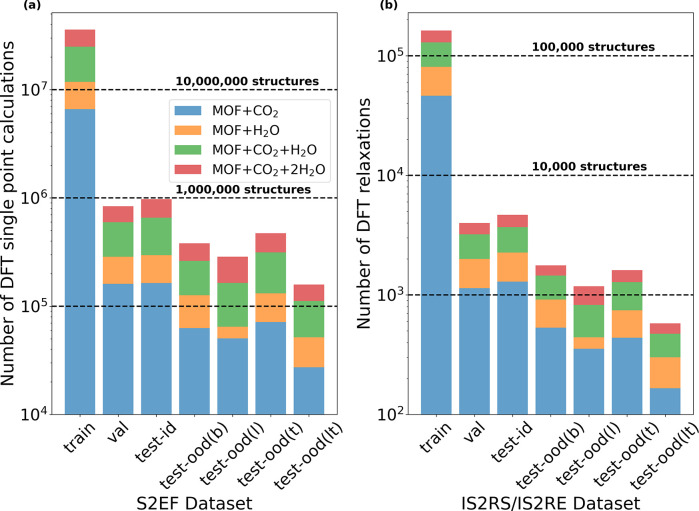
Distribution of the number of MOF + adsorbate DFT calculations
for the (a) S2EF and (b) IS2RS/IS2RE tasks on a logarithmic scale.
The horizontal lines emphasize the size of the dataset.
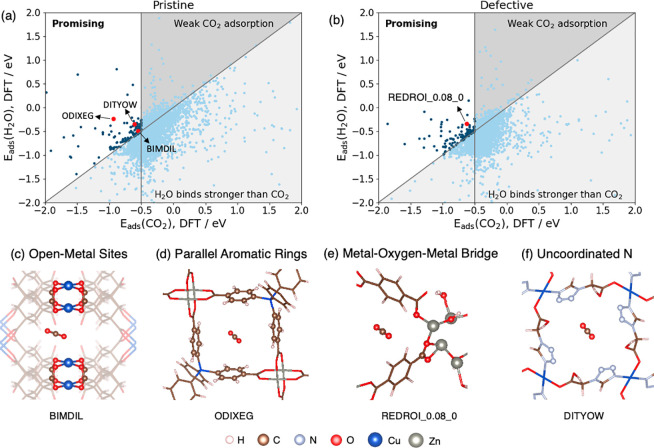
Parity plots showing DFT-calculated CO2 and
H2O adsorption energies in (a) pristine and (b) defective
MOFs. (c–f) MOF examples with common features of the promising
MOFs.
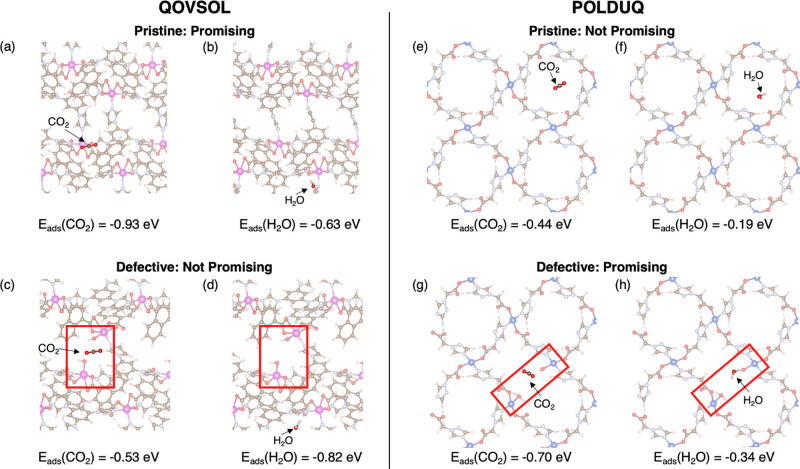
Examples showing different impacts of the defects in MOFs.
The defects generated are shown in red squares. Negative impact of
defects on DAC (a–d): Defective QOVSOL with a defect concentration
of 0.12 shows less favorable CO2 adsorption (a and c) and
stronger H2O adsorption (b and d). Positive impact of defects
on DAC (e–g): The H2O adsorption is slightly more
favorable in defective POLDUQ with a defect concentration of 0.06
(f and h), but the CO2 adsorption is much stronger at the
defect site (e and g).
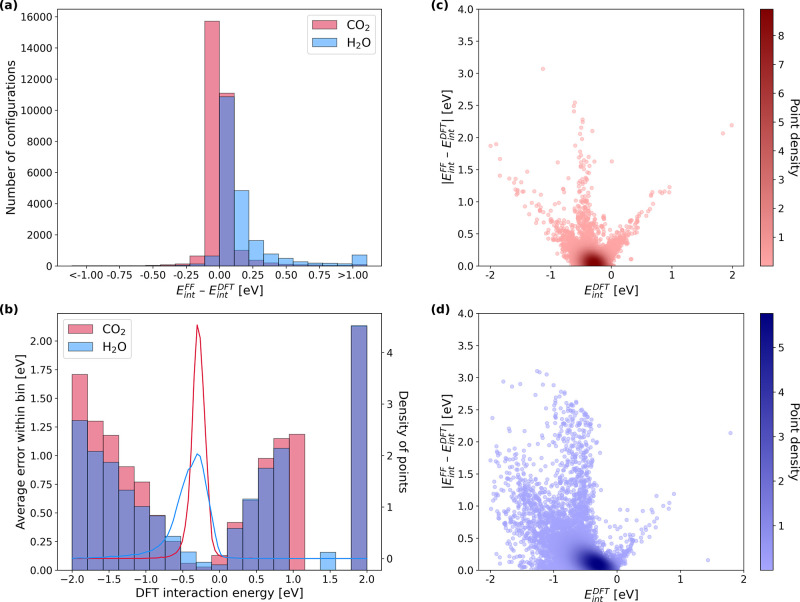
Comparison of adsorbate interaction energies calculated
with FFs and DFT. (a) Histogram of energy differences between FF and
DFT for 29,644 CO2 calculations (red) and 20,892 H2O calculations (blue). (b) Binned errors and DFT interaction
energy distributions split by adsorbate. (c, d) Absolute difference
between FF and DFT energies plotted versus DFT interaction energy for CO2 and H2O, respectively.
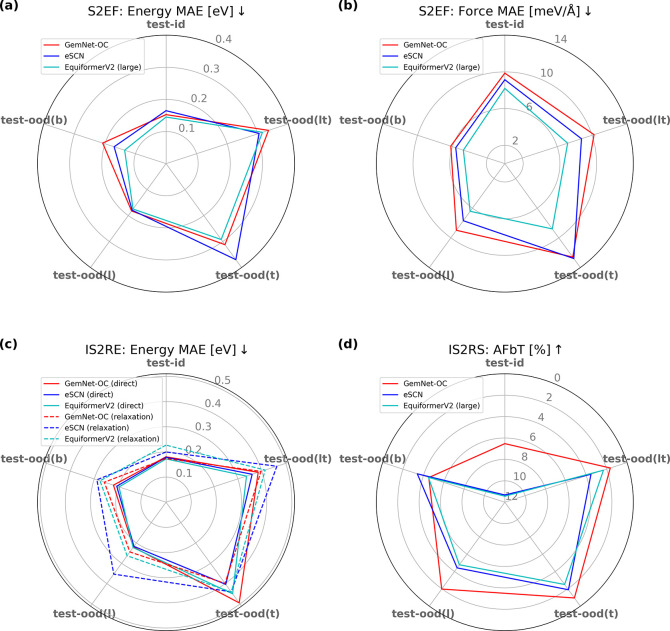
Radar plots for S2EF (a) energy and (b) force MAEs, (c)
IS2RE energy MAEs, and (d) IS2RS AFbT for the top three best models—GemNet-OC
(red), eSCN (blue), and EquiformerV2 (large, except in (c) where the
lighter model is shown) (cyan). Dashed lines correspond to the relaxation
approach for IS2RE; all other models are direct predictions. Axes
correspond to different in- and out-of-domain test sets and are aligned
so that the best result is closest to the origin of the plot in all
cases.
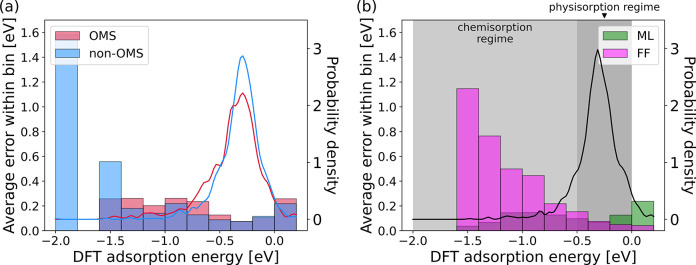
Binned errors and relative density of the number of points
(solid lines) as a function of DFT adsorption energy for (a) ML predicted
adsorption energies on open metal site (OMS) (red) and non-OMS (blue)
and (b) interaction energies predicted by FFs (magenta) and corresponding
adsorption energies predicted by ML (green) models. Compared to FFs,
ML models are significantly more accurate in the chemisorption regime and are comparable in the physisorption regime. Positive adsorption
energies are omitted from the plot because they are rare and likely
unphysical; plots with the full range of adsorption energies are provided
in Figure S4 .
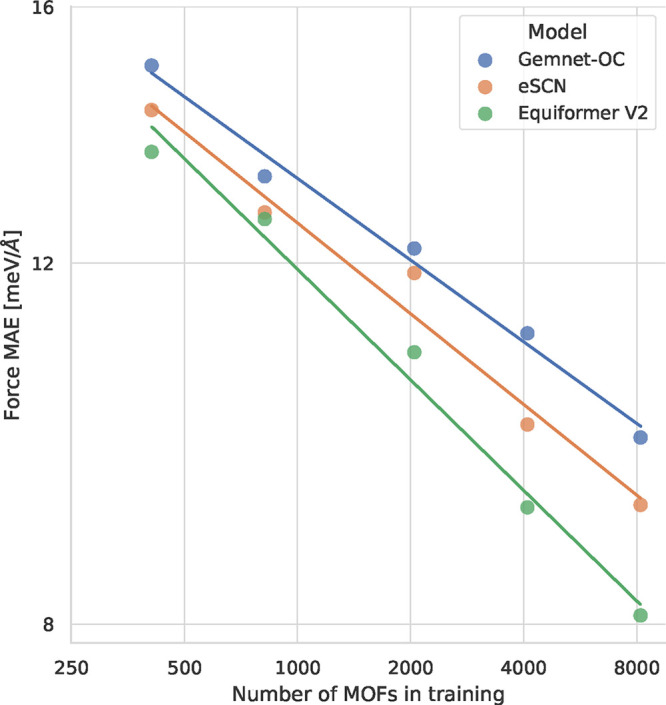
Force MAE on the test-id set for the top 3 S2EF models
when trained on different amounts of training data. The lines show
scaling laws obtained by fitting a line between log of the force MAE
and log of the number of training MOFs for each model.
References
-
- Sood A.; Vyas S. IOP Conf. Ser.: Earth and Environ. Sci. 2017, 83, 012024.10.1088/1755-1315/83/1/012024. - DOI
Publication types
LinkOut - more resources
Full Text Sources