. 2024 May 23;13(5):e1512.
doi: 10.1002/cti2.1512. eCollection 2024.

Engineered CAR-T cells targeting the non-functional P2X purinoceptor 7 (P2X7) receptor as a novel treatment for ovarian cancer

Affiliations

Engineered CAR-T cells targeting the non-functional P2X purinoceptor 7 (P2X7) receptor as a novel treatment for ovarian cancer

Veronika Bandara et al. Clin Transl Immunology. .

Abstract

Objectives: Recent studies have identified expression of the non-functional P2X7 (nfP2X7) receptor on various malignant cells including ovarian cancer, but not on normal cells, which makes it a promising tumour-associated antigen candidate for chimeric antigen receptor (CAR)-T-cell immunotherapies. In this study, we assessed the cytotoxic effects of nfP2X7-CAR-T cells on ovarian cancer using in vitro and in vivo models.

Methods: We evaluated the effects of nfP2X7-CAR-T cells on ovarian cancer cell lines (SKOV-3, OVCAR3, OVCAR5), normal peritoneal cells (LP-9) and primary serous ovarian cancer cells derived from patient ascites in vitro using monolayer and 3D spheroid assays. We also evaluated the effects of nfP2X7-CAR-T cells on patient-derived tissue explants, which recapitulate an intact tumour microenvironment. In addition, we investigated the effect of nfP2X7-CAR-T cells in vivo using the OVCAR-3 xenograft model in NOD-scid IL2Rγnull (NSG) mice.

Results: Our study found that nfP2X7-CAR-T cells were cytotoxic and significantly inhibited survival of OVCAR3, OVCAR5 and primary serous ovarian cancer cells compared with un-transduced CD3+ T cells in vitro. However, no significant effects of nfP2X7-CAR-T cells were observed for SKOV3 or normal peritoneal cells (LP-9) cells with low P2X7 receptor expression. Treatment with nfP2X7-CAR-T cells increased apoptosis compared with un-transduced T cells in patient-derived explants and correlated with CD3 positivity. Treatment with nfP2X7-CAR-T cells significantly reduced OVCAR3 tumour burden in mice compared with un-transduced CD3 cells for 7-8 weeks.

Conclusion: This study demonstrates that nfP2X7-CAR-T cells have great potential to be developed as a novel immunotherapy for ovarian cancer.

Keywords: 3D‐spheroid; CAR‐T cells; explant assays; immunotherapy; in vivo; ovarian cancer.


Conflict of interest statement

The authors report no conflict of interest.

Figures

Figure 1
Figure 1
Effect of nfP2X7‐CAR‐T cell treatment on ovarian cancer cell survival in monolayer culture (MTT assay). Survival of (a) OVCAR3, (b) OVCAR5, (c) SKOV3, (d) primary human ovarian cancer, (e) LP9 normal human mesothelial cells after treatment with control media, nfP2X7 targeting CD3 chimeric antigen receptor T (CAR‐T) cells or untransduced (UT) CD3 cells at a 5:1 or 10:1 effector:target ratio for 48 h and (f) INFγ measurements in conditioned media from OVCAR3, SKOV3, LP9 and primary cells following treatment with control media, UT CD3 or nfP2X7 targeting CAR‐T cells at 10:1 effector:target ratio. Data in a‐e represent cell survival as a percentage of the control media only. Data in (a) are pooled from 9 independent experiments using 6 different batches of CD3 cells. Data in (b) are pooled from 6 independent experiments using 6 different batches of CD3 cells. Data in (c) are pooled from 5 independent experiments using 3 batches of CD3 cells. Data in (d) are pooled from 7 independent experiments using 6 different batches of CD3 cells and 10 different primary ovarian cancer cell samples. Data in (e) are pooled from 3 independent experiments using 2 batches of CD3 cells. Data in (f) are pooled from 3 batches of matched UT CD3 or CAR‐T cells for OVCAR3, SKOV3 and LP9 cells and one batch of UT CD3 or CAR T cells for the primary cells (n = 6). All data are represented as mean ± SEM. One‐way ANOVA (Tukey's multiple comparisons test, *P < 0.05, **P < 0.01, ***P < 0.001, ns, not significant).
Figure 2
Figure 2
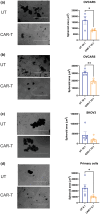
Effect of nfP2X7‐CAR‐T cells on ovarian cancer spheroid culture. Representative images of spheroids (left panels) captured at 72 h post‐treatment and spheroid area quantitation using Image J (right panels). (a) Comparison of OVCAR3 cells treated with either nfP2X7‐CAR‐T cells or un‐transduced (UT) CD3 cells. Significant decrease in spheroid area was observed at 10:1 (E:T) ratio. OVCAR3 data represents mean ± SEM of 4 replicates from 2 independent batches of CD3 cells. (b) Treatment of OVCAR5 cells with nfP2X7‐CAR‐T cells resulted in a significant decrease in spheroid area compared with UT CD3 cells at 10:1 ratio. Data represent mean ± SEM of 4 replicates from 2 independent batches of CD3 cells. (c) SKOV3 cell line did not respond to treatment with nfP2X7‐CAR‐T cells in the 3D spheroid culture. Data represent mean ± SEM of 5 replicates from 3 independent batches of CD3 cells. *P < 0.05, unpaired Student t‐test. (d) nfP2X7‐CAR‐T cells treated primary cells (5:1) had reduced spheroid size at 72 h of treatment compared with UT CD3 cells. *P < 0.05; **P < 0.01, unpaired Student's t‐test. Data were collected from 5 different primary cell cultures using 3 independent batches of CD3 cells. Scale bar = 1000 μm.
Figure 3
Figure 3
Effect of nfP2X7‐CAR‐T cells in patient‐derived explant assays. Representative images of cleaved caspase 3 immunostaining in patient‐derived ovarian cancer explants (patient 5) following treatment with PBS (a), carboplatin (CBP, 100 μm (b), un‐transduced (UT) T cells, (CD4:CD8 1:1) (c), nfP2X7‐CAR‐T (CD4:CD8 1:1) (d) for 48 h. (e) Cleaved caspase 3 quantitation. Data are expressed as % of PBS or UT CD3 controls (n = 10, patients 4–13), The bar graphs show the median values. *, significantly increased compared to PBS control and UT T cell treatment, Wilcoxon signed‐rank test (P < 0.05). CD3 immunostaining in explant tissue that responded to nfP2X7‐CAR‐T treatment (patient 11); treatment with un‐transduced (UT, CD4:CD8 1:1 cells) (f) and nfP2X7‐CAR‐T (CD4:CD8 1:1) (g) for 48 h. CD3 quantitation using quPath analysis in explant tissues that responded to nfP2X7‐CAR‐T treatment (h), n = 7). Data are expressed as % of UT CD3 control. *P = 0.046, Wilcoxon signed‐rank test. CD3 immunostaining in ovarian cancer explant tissue that did not respond to treatment with nfP2X7‐CAR‐T (patient 10) treatment with UT (CD4:CD8 1:1 cells) (i) and nfP2X7‐CAR‐T (CD4:CD8 1:1) (j) for 48 h. CD3 quantitation using quPath analysis in explant tissues that did not respond to nfP2X7‐CAR‐T treatment (k), n = 3). Data are expressed as % of UT CD3 control. (l) Correlation between CD3 positivity (cells mm−2) and response to nfP2X7‐CAR‐T treatment measured by cleaved caspase 3 positivity (% of UT control), Spearman correlation test, r = 0.783, P = 0.0172. (a–d) scale bar = 50 μm, (f–j) scale bar = 100 μm. (f–j) pink asterisks indicate CD3 positive cells.
Figure 4
Figure 4
Effects of intraperitoneal (i.p.) delivery of nfP2X7 CAR‐T cells on ovarian cancer metastasis in OVCAR3‐luc xenografts (Experiment 1). (a) Representative bioluminescence flux imaging from OVCAR3‐luc tumour‐bearing NSG mice injected with 5 × 106 OVCAR3 cells followed by the administration (i.p) with either 1 × 107 cells un‐transduced (UT) CD3 cells or nfP2X7‐CAR‐T cells on day 21 post‐tumour injection (Day 0). IVIS imaging from −day 7 to day 64 post‐treatment. (b) Quantification of flux (each mouse) from OVCAR3‐luc bearing mice treated i.p. with CD3 UT cells (n = 6) or nfP2X7‐CAR‐T cells (n = 6), data from one independent experiment. Data are flux (photons s−1) for each mouse. (c) Average fold change in flux (from minus day 1) of OVCAR3‐luc bearing mice. i.p delivery of nfP2X7 CD3 CAR‐T cells at day 0 significantly reduced tumour burden in OVCAR3‐luc tumour‐bearing mice, compared with UT CD3 cells, at day 13, 27, 41 and 50. Error bars mean ± SEM, *P < 0.05, Student's‐t‐test at each time point. The dotted line indicates time of CD3 cell administration.
Figure 5
Figure 5
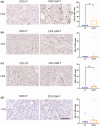
Characterisation of OVCAR3 xenograft tumours. Representative images and quantitation of CD3 (a), CD4 (b), CD8 (c) and PD1 (d) immunostaining in OVCAR3 xenograft tumours from mice treated with UT CD3 T cells or nfP2X7‐CAR‐T cells. OVCAR3 tumours were collected between 106 and 139 days post T‐cell treatment. All images are the same magnification. Scale bar = 100 μm. Data are the % positive CD3, CD4, CD8, or PD1 cells in tumour area. The bar represents the median value of 5 or 6 tumours/group. *P < 0.05, **P < 0.001. Mann–Whitney U‐test.

References

    1. Sung H, Ferlay J, Siegel RL et al. Global cancer statistics 2020: GLOBOCAN estimates of incidence and mortality worldwide for 36 cancers in 185 countries. CA Cancer J Clin 2021; 71: 209–249. - PubMed
    1. Matz M, Coleman MP, Carreira H et al. Worldwide comparison of ovarian cancer survival: Histological group and stage at diagnosis (CONCORD‐2). Gynecol Oncol 2017; 144: 396–404. - PMC - PubMed
    1. Colombo PE, Fabbro M, Theillet C, Bibeau F, Rouanet P, Ray‐Coquard I. Sensitivity and resistance to treatment in the primary management of epithelial ovarian cancer. Crit Rev Oncol Hematol 2014; 89: 207–216. - PubMed
    1. Schwab CL, English DP, Roque DM, Pasternak M, Santin AD. Past, present and future targets for immunotherapy in ovarian cancer. Immunotherapy 2014; 6: 1279–1293. - PMC - PubMed
    1. Mayor P, Starbuck K, Zsiros E. Adoptive cell transfer using autologous tumor infiltrating lymphocytes in gynecologic malignancies. Gynecol Oncol 2018; 150: 361–369. - PMC - PubMed