

This is a preprint.
It has not yet been peer reviewed by a journal.
The National Library of Medicine is
running a pilot
to include preprints that result from research funded by NIH in PMC and PubMed.
[Preprint]. 2024 May 15:arXiv:2405.09646v1.
Protein folding as a jamming transition
Affiliations
- PMID: 38800654
- PMCID: PMC11118678
Item in Clipboard
Protein folding as a jamming transition
ArXiv.
.
Abstract
Proteins fold to a specific functional conformation with a densely packed hydrophobic core that controls their stability. We develop a geometric, yet all-atom model for proteins that explains the universal core packing fraction of found in experimental measurements. We show that as the hydrophobic interactions increase relative to the temperature, a novel jamming transition occurs when the core packing fraction exceeds . The model also recapitulates the global structure of proteins since it can accurately refold to native-like structures from partially unfolded states.
Figures
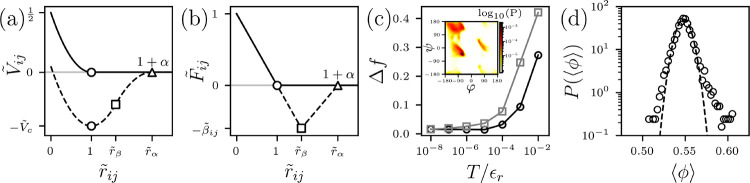
The nonbonded dimensionless pair potential plotted versus atomic separation for purely-repulsive interactions (Eq. 1) (solid line) and attractive interactions (Eq. 5) (dashed line) and (b) the corresponding dimensionless force . The symbols represent the onset of repulsive interactions where and (circles), the change in spring constant where and (squares), and the separation above which the interactions are zero (triangles). (c) The difference between the average fraction of backbone dihedral angle outliers (black circles) and side chain dihedral angle outliers (grey squares) between the HS model and proteins from a high-quality x-ray crystal structure database plotted versus the temperature at which the HS model proteins were simulated. Inset: The probability distribution of backbone dihedral angles sampled by high-quality x-ray crystal structures of proteins. The colors from light to dark indicate increasing probability on a logarithmic scale. (d) Probability distribution of the average core packing fraction in high-quality x-ray crystal structures of proteins calculated using the optimized HS atom sizes on a semi-log plot with a Gaussian fit (black dashed line).
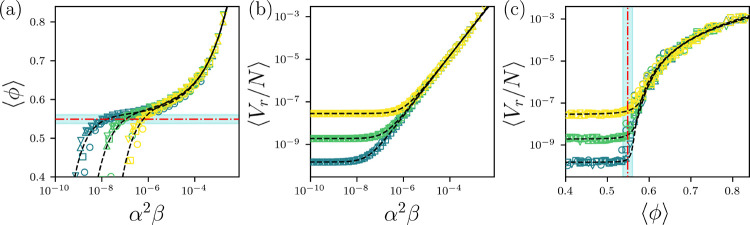
(a) The average core packing fraction plotted versus the attraction strength for the HS+HP protein model for temperatures (yellow), 10−7 (green), and 10−8 (blue) and (circles), 1.0 (squares), 1.5 (upward triangles), and 2.0 (downward triangles). The horizontal red dot-dashed line and cyan shading indicate the average and standard deviation of the core packing fraction in the high-resolution x-ray crystal structure data set. The black dashed lines indicate fits to Eq. 6. (b) The average repulsive potential energy per atom plotted versus . The black dashed lines indicate fits to Eq. 7. (c) plotted versus . The vertical red dot-dashed line and cyan shading indicate the average and standard deviation of the core packing fraction in the high-resolution x-ray crystal structure data set. The black dashed lines indicate fits to Eq. 8.
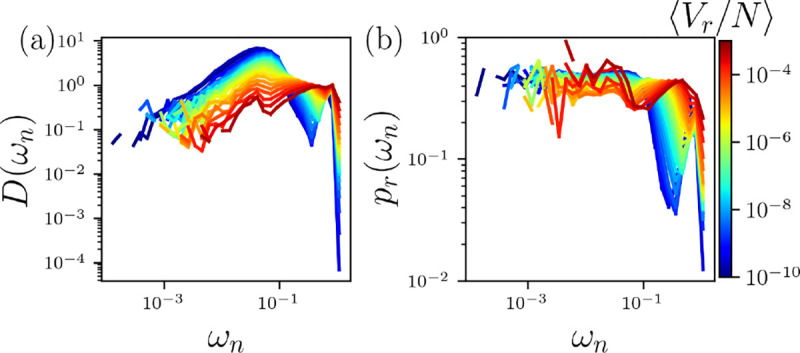
(a) The vibrational density of states (VDOS) , where is the frequency, of the atoms in the HS+HP model at for all and in Fig. 2. (b) Participation ratio plotted versus . The average total nonbonded repulsive potential energy per atom increases from blue to red on a logarithmic scale.
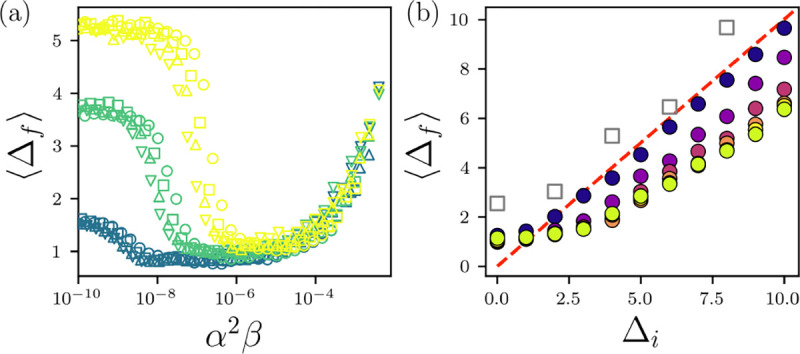
(a) in Å between the HS+HP model proteins and the x-ray crystal structures averaged over 20 proteins plotted versus when starting from the experimental structure for temperature (yellow), 10−7 (green), and 10−8 (blue) and (circles), 1.0 (squares), 1.5 (upward triangles), and 2.0 (downward triangles). (b) Average plotted versus the initial in for . The filled circles are colored by increasing from purple to yellow, and is set so that . All-atom MD simulations of a single protein (PDBID: 2IGP) using the Amber99SB-ILDN force field are shown as grey squares. The red dashed line indicates .
Similar articles
-
Desolvation and development of specific hydrophobic core packing during Im7 folding.J Mol Biol. 2010 Mar 12;396(5):1329-45. doi: 10.1016/j.jmb.2009.12.048. Epub 2010 Jan 4. J Mol Biol. 2010. PMID: 20053361 Free PMC article.
-
Shear thickening and jamming in densely packed suspensions of different particle shapes.Phys Rev E Stat Nonlin Soft Matter Phys. 2011 Sep;84(3 Pt 1):031408. doi: 10.1103/PhysRevE.84.031408. Epub 2011 Sep 28. Phys Rev E Stat Nonlin Soft Matter Phys. 2011. PMID: 22060372
-
Side chain burial and hydrophobic core packing in protein folding transition states.Protein Sci. 2008 Apr;17(4):644-51. doi: 10.1110/ps.073105408. Epub 2008 Feb 27. Protein Sci. 2008. PMID: 18305200 Free PMC article.
-
Pathways of protein folding.Annu Rev Biochem. 1993;62:653-83. doi: 10.1146/annurev.bi.62.070193.003253. Annu Rev Biochem. 1993. PMID: 8352599 Review.
-
Toward a better understanding of protein folding pathways.Proc Natl Acad Sci U S A. 1988 Jul;85(14):5082-6. doi: 10.1073/pnas.85.14.5082. Proc Natl Acad Sci U S A. 1988. PMID: 2455892 Free PMC article. Review.
References
-
- Dill K. A., Dominant forces in protein folding, Biochemistry 29, 7133 (1990). - PubMed
-
- Wolynes P. G., Onuchic J. N., and Thirumalai D., Navigating the folding routes, Science 267, 1619 (1995). - PubMed
-
- Onuchic J. N., Luthey-Schulten Z., and Wolynes P. G., Theory of protein folding: The energy landscape perspective, Annual Review of Physical Chemistry 48, 545 (1997). - PubMed
Publication types
Grants and funding
LinkOut - more resources
Full Text Sources