. 2024 Feb 15;4(3):268-280.
doi: 10.1021/acsphyschemau.3c00065. eCollection 2024 May 22.

Raman Spectroscopic Insights of Phase-Separated Insulin Aggregates

Affiliations

Raman Spectroscopic Insights of Phase-Separated Insulin Aggregates

Sandip Dolui et al. ACS Phys Chem Au. .

Abstract

Phase-separated protein accumulation through the formation of several aggregate species is linked to the pathology of several human disorders and diseases. Our current investigation envisaged detailed Raman signature and structural intricacy of bovine insulin in its various forms of aggregates produced in situ at an elevated temperature (60 °C). The amide I band in the Raman spectrum of the protein in its native-like conformation appeared at 1655 cm-1 and indicated the presence of a high content of α-helical structure as prepared freshly in acidic pH. The disorder content (turn and coils) also was predominately present in both the monomeric and oligomeric states and was confirmed by the presence shoulder amide I maker band at ∼1680 cm-1. However, the band shifted to ∼1671 cm-1 upon the transformation of the protein solution into fibrillar aggregates as produced for a longer time of incubation. The protein, however, maintained most of its helical conformation in the oligomeric phase; the low-frequency backbone α-helical conformation signal at ∼935 cm-1 was similar to that of freshly prepared aqueous protein solution enriched in helical conformation. The peak intensity was significantly weak in the fibrillar aggregates, and it appeared as a good Raman signature to follow the phase separation and the aggregation behavior of insulin and similar other proteins. Tyrosine phenoxy moieties in the protein may maintained its H-bond donor-acceptor integrity throughout the course of fibril formation; however, it entered in more hydrophobic environment in its journey of fibril formation. In addition, it was noticed that oligomeric bovine insulin maintained the orientation/conformation of the disulfide bonds. However, in the fibrillar state, the disulfide linkages became more strained and preferred to maintain a single conformation state.


Conflict of interest statement

The authors declare no competing financial interest.

Figures

Figure 1
Figure 1
(A) Primary amino acid sequences with typical intra- and interchain disulfide bonding (interconnecting yellow lines) of BI. Twenty amino acids make up the A-chain (blue), whereas 30 amino acids make up the B-chain (green). These chains are connected by two intrachain and one interchain disulfide bridges. The secondary structure of insulin is shown in the right panel (RCSB PDB) entry 2ZP6; illustrated in Pymol). There are two α-helices in the A-chain (pink). The cyan B-chain has a random coil in addition to an α helix.
Figure 2
Figure 2
Amyloid fibril formation kinetics of BI monitored by the amyloid-specific binding of extrinsic fluorophore ThT. Each data point in the blue curve indicates the fluorescence intensity (at 482 nm) of ThT solution in the presence of the quantitative amount of aliquots of bovine insulin measured at different time points of incubation. ThT fluorescence was measured at an emission maxima of 482 nm and excited at 440 nm. Inset shows two kinetic parameters, tlag and t1/2, as obtained by fitting the data points (blue curve).
Figure 3
Figure 3
AFM images of BI aggregates produced at different time points of incubation. (A) Topographic view of heterogeneous oligomers (highlighted in black arrowhead) formed after incubation for 50 min. (B) Protofibrils with smaller widths (black arrowhead) produced after 70 min incubation period of the protein solution. The average height is 4–6 nm. (C) Coexistence of both small and long elongated protofilaments (80 min). (D) Images of quite mature bovine insulin fibrils 1–3 μm in length as identified in the stationary states (incubation time 120 min).
Figure 4
Figure 4
UV region CD analysis and major secondary structural rearrangements in the course of bovine insulin fibrillation. (A) Black line represents the CD spectra of BI freshly prepared in acidic buffer (HCl/NaCl) just before incubation (0 min) at a high temperature. Similarly red line is the CD spectra of oligomeric state taken after incubation for 50 min. Blue is obtained from mixtures of oligomers and protofilaments, and incubation time was 70 min. Green line obtained from the protein solution kept for 80 min incubation. Pink line is the representation of fibrillar entity obtained after 120 min of incubation. (B) Changes in the secondary structural components (α-helix and β-sheet) (%) against incubation time of BI in an acidic buffer led to the formation of different amyloidogenic aggregated states: helix (red) and sheet (blue).
Figure 5
Figure 5
532 nm laser-excited Raman spectra of BI at different time points incubation in acidic buffer. The regions 470–1800 cm–1 are shown. Incubation condition: [BI]: 2 mg/mL, 25 mM HCl with 100 mM NaCl buffer, pH 1.6, incubation temperature 60 °C. Raman spectra: (A) 0 time of incubation, monomer; (C) 50 min after incubation (oligomers are formed); (E) 70 min incubation (oligomer and protofilaments); (G) 80 min incubation (protofiber); (I) 120 min incubation (fiber). For each measurement, 20 μL protein solution was dropped and cast onto a glass coverslip for laser excitation, laser power at source 20 mW, ∼5 mW at the sample, recording time of 100 s. The displayed spectrum was an average of three or four scans, and a suitable baseline correction was made. Highlighted boxes indicate major changes in the peak pattern/intensity. Different panels on the right hand side show the curve fitting analysis of the amide I region (1575–1720 cm–1) of the spectra shown on the left side (as stated above). (B) Monomer, (D) oligomer, (F) mixture of oligomer and protofiber, (H) protofiber, and (I) fiber. The band fitting protocol is described in Materials and Methods section. The orange and blue lines are the experimental and fitted spectra, respectively. Four component bands representing amide I regions are shown in green (α-helix, ∼1655 cm–1), orange (loose β-strand and PPII and disordered, 1686 cm–1), violet (β-sheet, ∼1671 cm–1), and maroon (vibronic coupling bands, ∼1637 cm–1). The peak positions are also fitted for aromatic residues: Tyr, ∼1613 cm–1; Phe ∼1605 cm–1, and unknown, 1586 cm–1. A partial assignment of the Raman spectra is given in Table 1.
Figure 6
Figure 6
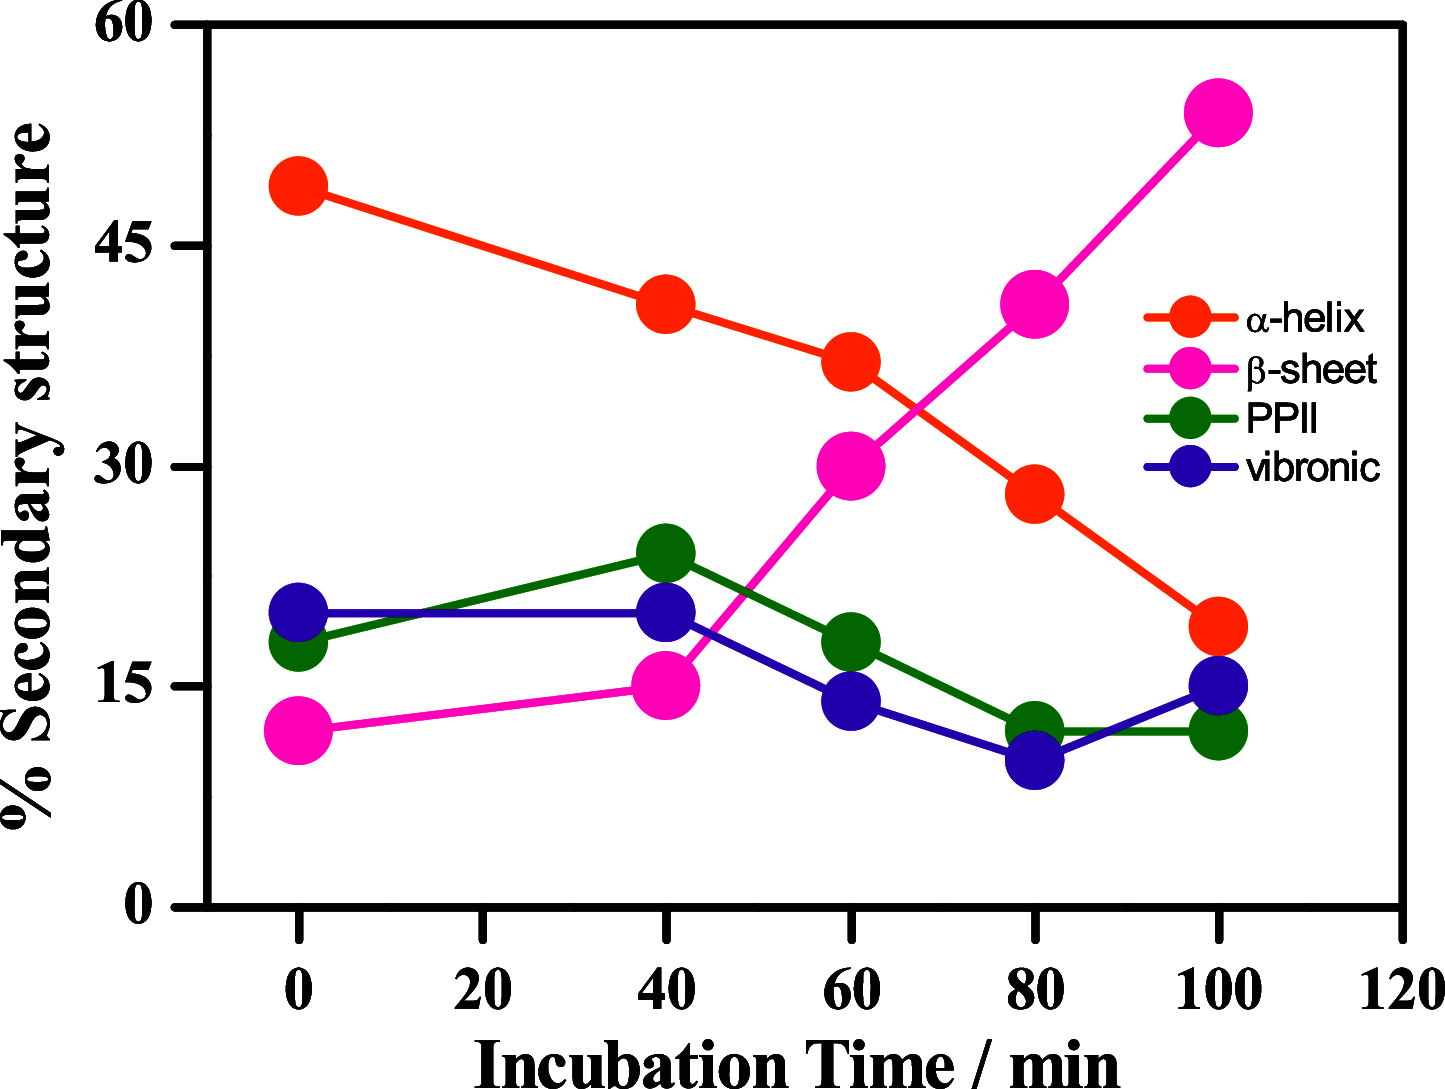
Time-correlated changes in the secondary structural components of incubated bovine insulin, as obtained from the curve fitting analysis of the Raman amide I band. Color key: orange, helix (1655 cm–1); pink, β-sheet (1671 cm–1); green, loose β-strand and PPII and disordered (1686 cm–1); and violet, vibronic coupling bands (∼1637 cm–1).
Figure 7
Figure 7
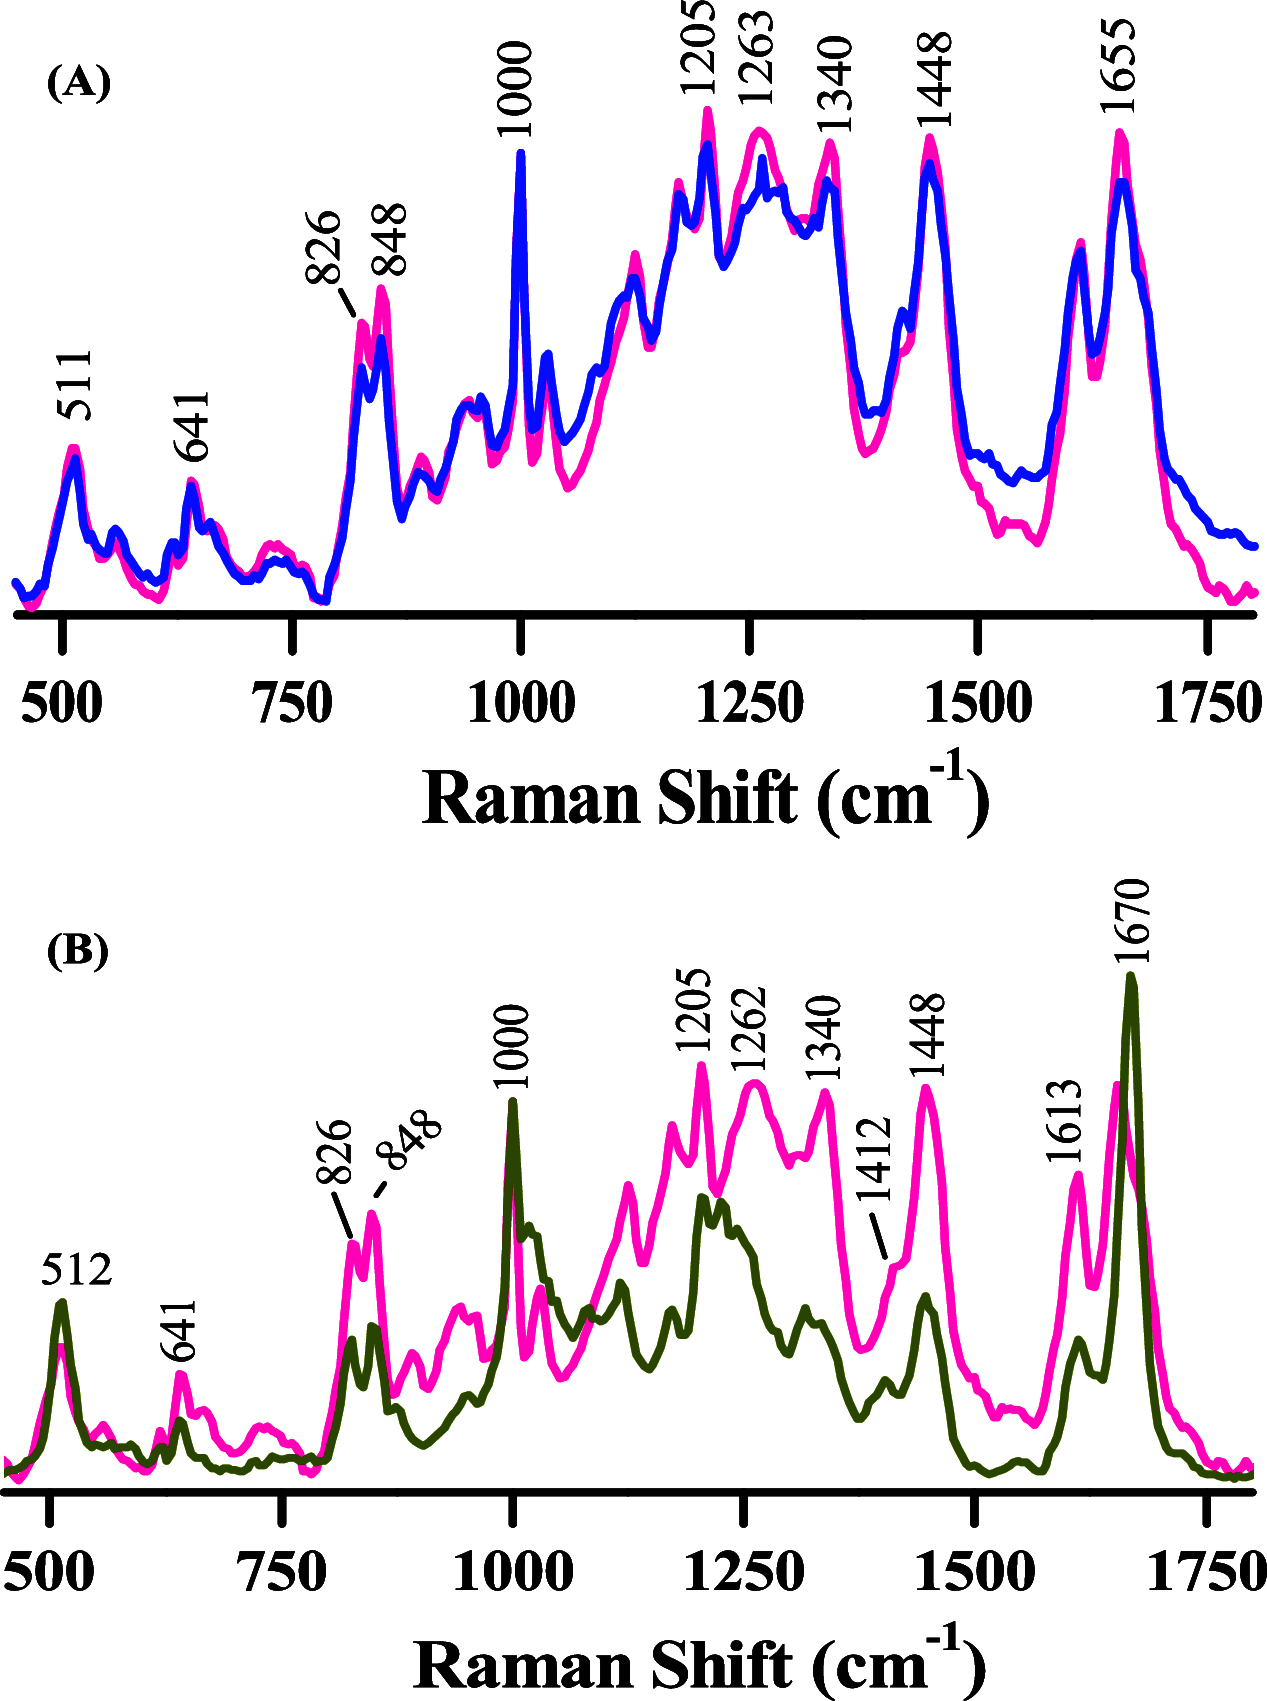
Comparison of Raman spectral signatures between different self-assembled species. (A) Variations in the averaged Raman spectra (470–1800 cm–1) of monomeric bovine insulin at pH 1.6 (red) and its self-assembled oligomers (blue). (B) Comparison of Raman spectra (475–1800 cm–1) of monomer (pink) with that of the mature filament (greenish yellow).
Figure 8
Figure 8
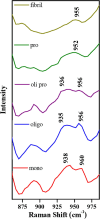
Observed data illustrate changes in the Raman intensity of the distinct helical marker band located at 940 cm–1 across various time intervals of incubation. Sample preparation and other conditions are the same as shown in Figure 5.
Figure 9
Figure 9
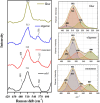
Raman spectra of BI over the spectral region of 420–630 cm–1 representing mainly the S–S disulfide mode of vibrations. Apart, from solid sample, the other experimental conditions were the same as in Figure 5. The right panels show the respective Raman band decomposition (regions 470–580 cm–1) using a Gaussian/Lorentzian function with a maximum fwhm of 30 cm–1.

References

    1. Dobson C. M. Protein Folding and Misfolding. Nature 2003, 426 (6968), 884–890. 10.1038/nature02261. - DOI - PubMed
    1. Chiti F.; Dobson C. M. Protein Misfolding, Functional Amyloid, and Human Disease. Annu. Rev. Biochem. 2006, 75, 333–366. 10.1146/annurev.biochem.75.101304.123901. - DOI - PubMed
    1. Carulla N.; Zhou M.; Arimon M.; Gairí M.; Giralt E.; Robinson C. V.; Dobson C. M. Experimental Characterization of Disordered and Ordered Aggregates Populated during the Process of Amyloid Fibril Formation. Proc. Natl. Acad. Sci. U. S. A. 2009, 106 (19), 7828–7833. 10.1073/pnas.0812227106. - DOI - PMC - PubMed
    1. Lansbury P. T. Evolution of Amyloid: What Normal Protein Folding May Tell Us about Fibrillogenesis and Disease. Proc. Natl. Acad. Sci. U. S. A. 1999, 96 (7), 3342–3344. 10.1073/pnas.96.7.3342. - DOI - PMC - PubMed
    1. Soto C.; Pritzkow S. Protein Misfolding, Aggregation, and Conformational Strains in Neurodegenerative Diseases. Nat. Neurosci 2018, 21 (10), 1332–1340. 10.1038/s41593-018-0235-9. - DOI - PMC - PubMed

LinkOut - more resources