. 2024 Jun 11;58(23):10195-10206.
doi: 10.1021/acs.est.3c09405. Epub 2024 May 27.

Persistence of PFOA Pollution at a PTFE Production Site and Occurrence of Replacement PFASs in English Freshwaters Revealed by Sentinel Species, the Eurasian Otter (Lutra lutra)

Affiliations

Persistence of PFOA Pollution at a PTFE Production Site and Occurrence of Replacement PFASs in English Freshwaters Revealed by Sentinel Species, the Eurasian Otter (Lutra lutra)

Emily O'Rourke et al. Environ Sci Technol. .

Abstract

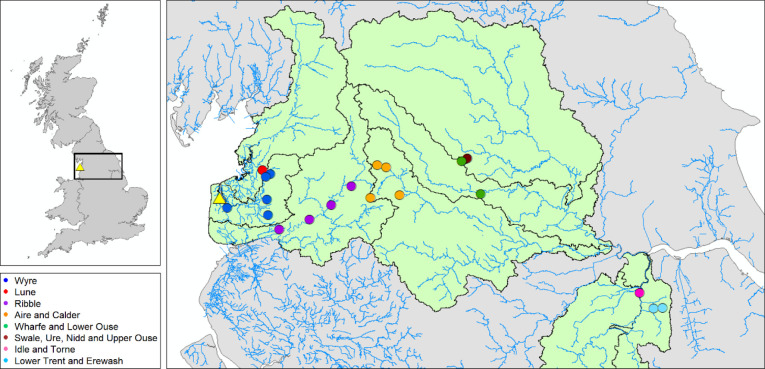
Concentrations of 33 PFASs were determined in 20 Eurasian otters, sampled 2015-2019, along a transect away from a factory, which used PFOA in PTFE manufacture. Despite cessation of usage in 2012, PFOA concentrations remained high near the factory (>298 μg/kg ww <20 km from factory) and declined with increasing distance (<57 μg/kg ww >150 km away). Long-chain legacy PFASs dominated the Σ33PFAS profile, particularly PFOS, PFOA, PFDA, and PFNA. Replacement compounds, PFECHS, F-53B, PFBSA, PFBS, PFHpA, and 8:2 FTS, were detected in ≥19 otters, this being the first report of PFBSA and PFECHS in the species. Concentrations of replacement PFASs were generally lower than legacy compounds (max: 70.3 μg/kg ww and 4,640 μg/kg ww, respectively). Our study underscores the utility of otters as sentinels for evaluating mitigation success and highlights the value of continued monitoring to provide insights into the longevity of spatial associations with historic sources. Lower concentrations of replacement, than legacy, PFASs likely reflect their lower bioaccumulation potential, and more recent introduction. Continued PFAS use will inevitably lead to increased environmental and human exposure if not controlled. Further research is needed on fate, toxicity, and bioaccumulation of replacement compounds.

Keywords: Eurasian otter (Lutra lutra); cyclic PFASs; ether-PFASs; fluorotelomer sulfonates (FTSs); per- and polyfluoroalkyl substances (PFASs); perfluoroalkane sulfonamides (FASAs); perfluoroalkyl carboxylic acids (PFCAs); perfluoroalkyl sulfonic acids (PFSAs); sentinel species.


Conflict of interest statement

The authors declare no competing financial interest.

Figures

Figure 1
Figure 1
Location of factory (yellow triangle) and otters selected for analysis (circles). Otters are color-coded by the river catchment they were found in. River catchments with otters selected for this study are highlighted in green with gray boundaries. Rivers are shown as thin blue lines. The factory location of AGC Chemicals Europe, Ltd., is indicated by the yellow triangle. Map produced using ArcMap 10.7.1.
Figure 2
Figure 2
Model-predicted decline in PFOA concentration with distance from the factory producing PTFE. Colored dots show the raw data, color-coded by river catchment. Solid red line shows the model predicted concentrations and dotted lines show standard error. One leverage point has been removed for modeling (n = 19), and year, latitude, and WWTW load are controlled to their mean values, see statistical methods for details.
Figure 3
Figure 3
Proportion of individual substances in relation to the total concentration of a) all PFASs, b) legacy PFASs, and c) replacement PFASs. Compounds which represented <1% of the profile are not labeled. d) Concentrations of compounds with detection frequency of 70% and above. Compounds are denoted by their abbreviation and carbon chain length, see Table S2 for full compound names. Concentrations are recorded in μg/kg ww, plotted on a log scale. Blue = legacy compounds, orange = replacement compounds, presented in order of decreasing median concentration. Concentrations are presented as a boxplot; the thick black line indicates the median concentration, the lower and upper extents of the box indicate the 25th (Q1) and 75th (Q3) percentiles of the data distribution, whiskers show the lowest and highest values excluding outliers, and circles indicate outliers (1.5× the interquartile range).

References

    1. Buck R. C.; Franklin J.; Berger U.; Conder J. M.; Cousins I. T.; Jensen A. A.; Kannan K.; Mabury S. A.; van Leeuwen S. P. Perfluoroalkyl and polyfluoroalkyl substances in the environment: terminology, classification, and origins. Integr. Environ. Assess. Manage. 2011, 7 (4), 513–541. 10.1002/ieam.258. - DOI - PMC - PubMed
    1. Ti B.; Li L.; Liu J.; Chen C. Global distribution potential and regional environmental risk of F-53B. Sci. Total Environ. 2018, 640, 1365–1371. 10.1016/j.scitotenv.2018.05.313. - DOI - PubMed
    1. Paul A. G.; Jones K. C.; Sweetman A. J. A first global production, emission, and environmental inventory for perfluorooctane sulfonate. Environ. Sci. Technol. 2009, 43 (2), 386–392. 10.1021/es802216n. - DOI - PubMed
    1. Prevedouros K.; Cousins I. T.; Buck R. C.; Korzeniowski S. H. Sources, fate and transport of perfluorocarboxylates. Environ. Sci. Technol. 2006, 40 (1), 32–44. 10.1021/es0512475. - DOI - PubMed
    1. Giesy J. P.; Kannan K. Global distribution of perfluorooctane sulfonate in wildlife. Environ. Sci. Technol. 2001, 35 (7), 1339–1342. 10.1021/es001834k. - DOI - PubMed