

Analysis and forecasting of syphilis trends in mainland China based on hybrid time series models
- PMID: 38800855
- PMCID: PMC11736451
- DOI: 10.1017/S0950268824000694
Analysis and forecasting of syphilis trends in mainland China based on hybrid time series models
Abstract
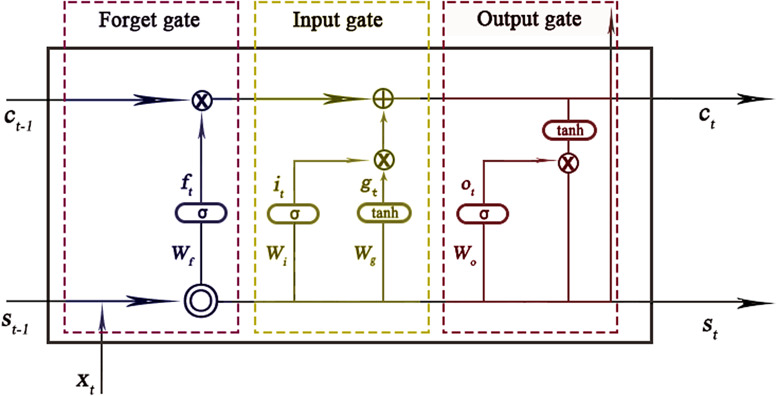
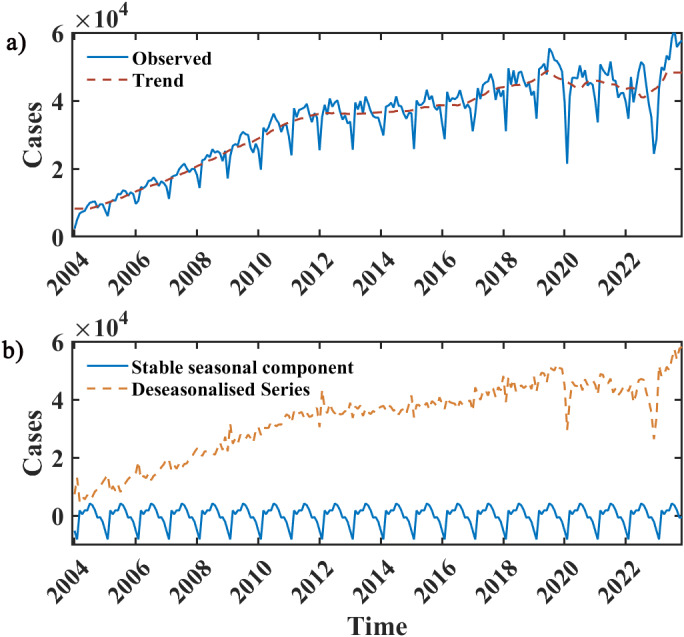
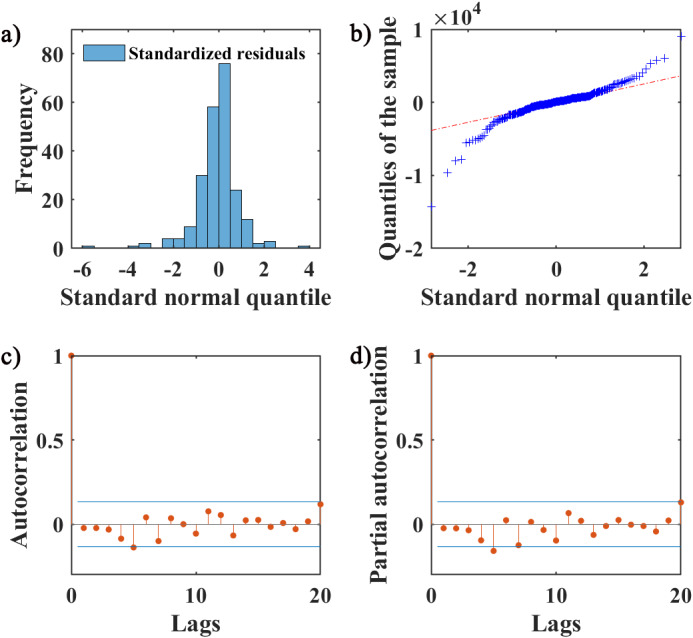
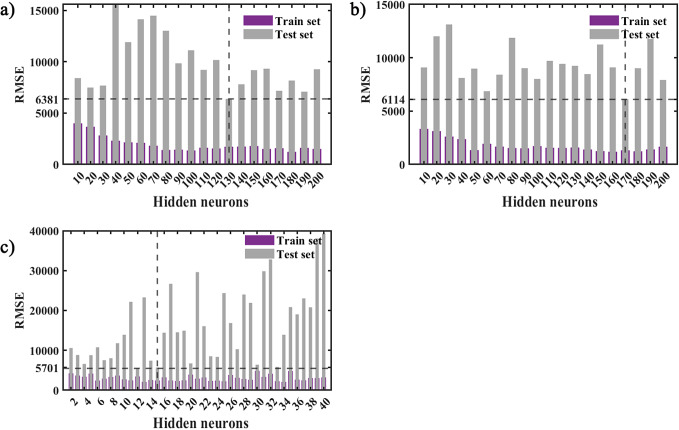
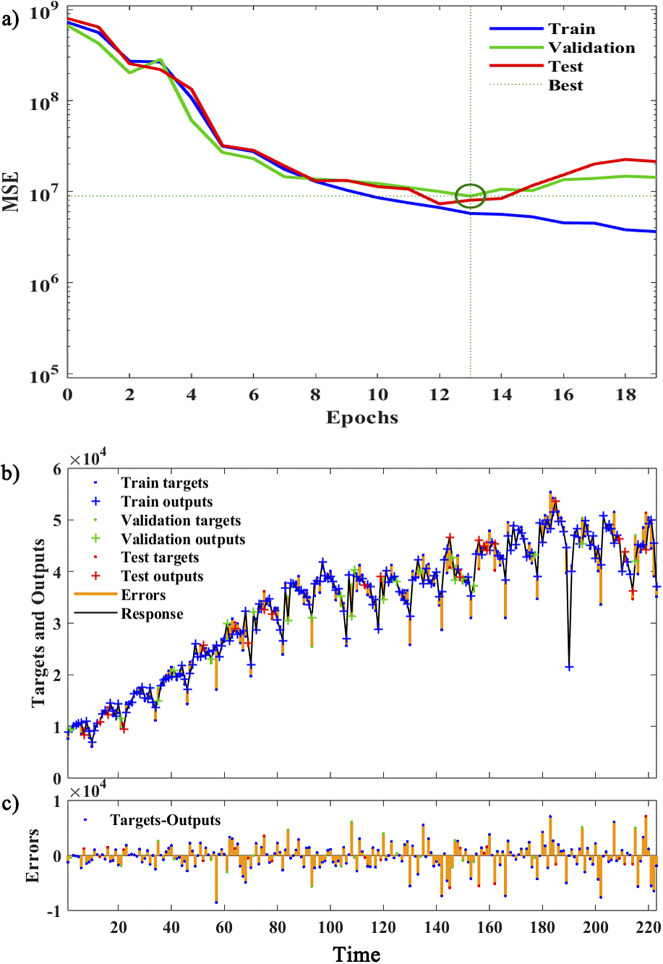
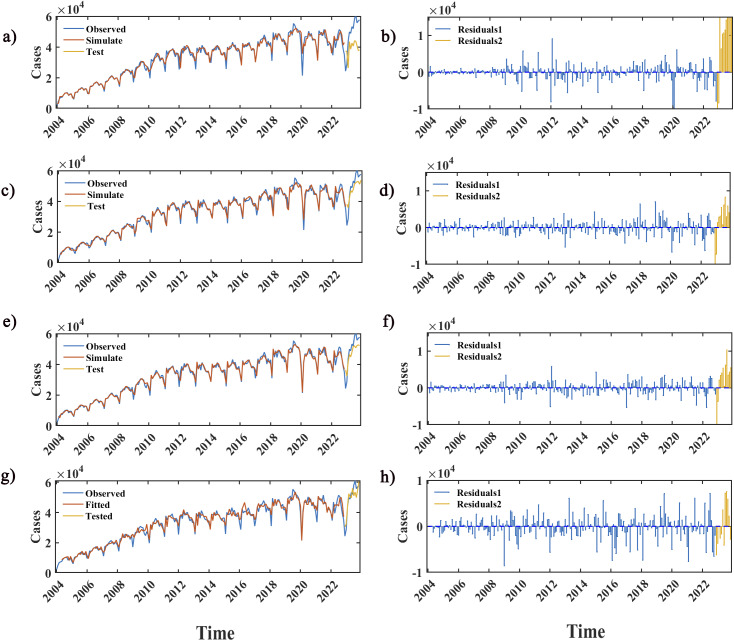
Syphilis remains a serious public health problem in mainland China that requires attention, modelling to describe and predict its prevalence patterns can help the government to develop more scientific interventions. The seasonal autoregressive integrated moving average (SARIMA) model, long short-term memory network (LSTM) model, hybrid SARIMA-LSTM model, and hybrid SARIMA-nonlinear auto-regressive models with exogenous inputs (SARIMA-NARX) model were used to simulate the time series data of the syphilis incidence from January 2004 to November 2023 respectively. Compared to the SARIMA, LSTM, and SARIMA-LSTM models, the median absolute deviation (MAD) value of the SARIMA-NARX model decreases by 352.69%, 4.98%, and 3.73%, respectively. The mean absolute percentage error (MAPE) value decreases by 73.7%, 23.46%, and 13.06%, respectively. The root mean square error (RMSE) value decreases by 68.02%, 26.68%, and 23.78%, respectively. The mean absolute error (MAE) value decreases by 70.90%, 23.00%, and 21.80%, respectively. The hybrid SARIMA-NARX and SARIMA-LSTM methods predict syphilis cases more accurately than the basic SARIMA and LSTM methods, so that can be used for governments to develop long-term syphilis prevention and control programs. In addition, the predicted cases still maintain a fairly high level of incidence, so there is an urgent need to develop more comprehensive prevention strategies.
Keywords: LSTM; NARX; SARIMA; modelling; syphilis.
Conflict of interest statement
The authors declare none.
Figures


Similar articles
-
Trend analysis and prediction of gonorrhea in mainland China based on a hybrid time series model.BMC Infect Dis. 2024 Jan 22;24(1):113. doi: 10.1186/s12879-023-08969-4. BMC Infect Dis. 2024. PMID: 38253998 Free PMC article.
-
Study on the prediction effect of a combined model of SARIMA and LSTM based on SSA for influenza in Shanxi Province, China.BMC Infect Dis. 2023 Feb 6;23(1):71. doi: 10.1186/s12879-023-08025-1. BMC Infect Dis. 2023. PMID: 36747126 Free PMC article.
-
Seasonality and trend prediction of scarlet fever incidence in mainland China from 2004 to 2018 using a hybrid SARIMA-NARX model.PeerJ. 2019 Jan 17;7:e6165. doi: 10.7717/peerj.6165. eCollection 2019. PeerJ. 2019. PMID: 30671295 Free PMC article.
-
Temporal trends analysis of tuberculosis morbidity in mainland China from 1997 to 2025 using a new SARIMA-NARNNX hybrid model.BMJ Open. 2019 Jul 31;9(7):e024409. doi: 10.1136/bmjopen-2018-024409. BMJ Open. 2019. PMID: 31371283 Free PMC article.
-
A new hybrid model SARIMA-ETS-SVR for seasonal influenza incidence prediction in mainland China.J Infect Dev Ctries. 2023 Nov 30;17(11):1581-1590. doi: 10.3855/jidc.18037. J Infect Dev Ctries. 2023. PMID: 38064398
References
-
- Hook EW 3rd (2017) Syphilis. Lancet (London, England) 389(10078), 1550–1557. - PubMed
-
- WHO (2023) Overview of syphlis. Available at https://wwwwhoint/health-topics/syphilis#tab=tab_1 (accessed 9 August 2023).
-
- Mercuri SR, et al. (2022) Syphilis: A mini review of the history, epidemiology and focus on microbiota. The New Microbiologica 45(1), 28–34. - PubMed
-
- Chauhan K, et al. (2023) Demystifying ocular syphilis - A major review. Ocular Immunology and Inflammation 31(7), 1425–1439. - PubMed
MeSH terms
LinkOut - more resources
Full Text Sources
Medical
