. 2024 Jun;33(6):e5024.
doi: 10.1002/pro.5024.

Native dynamics and allosteric responses in PTP1B probed by high-resolution HDX-MS

Affiliations

Native dynamics and allosteric responses in PTP1B probed by high-resolution HDX-MS

Virgil A Woods et al. Protein Sci. 2024 Jun.

Abstract

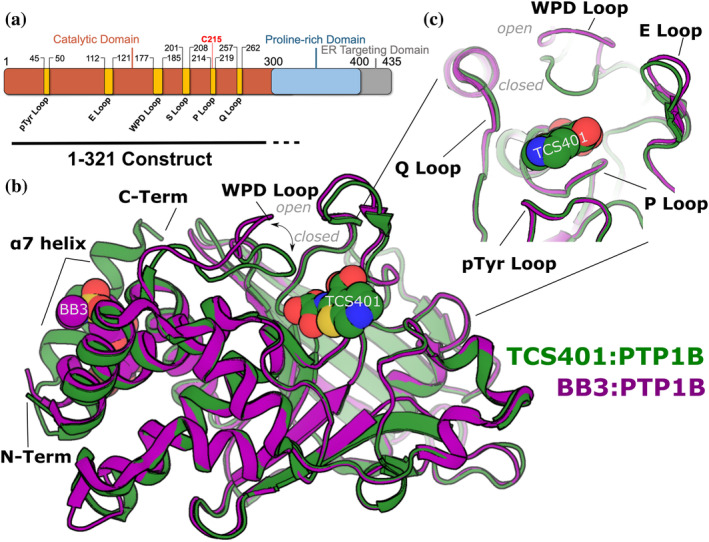
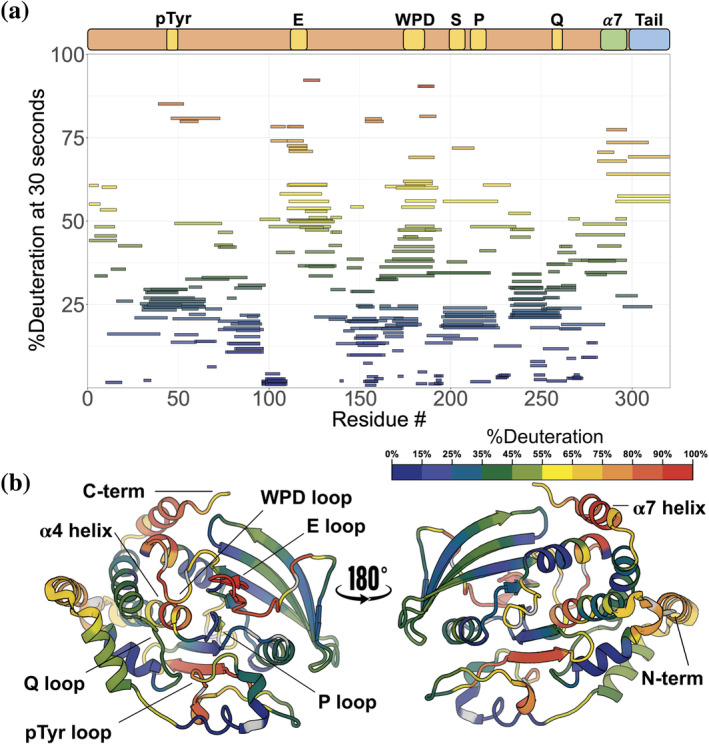
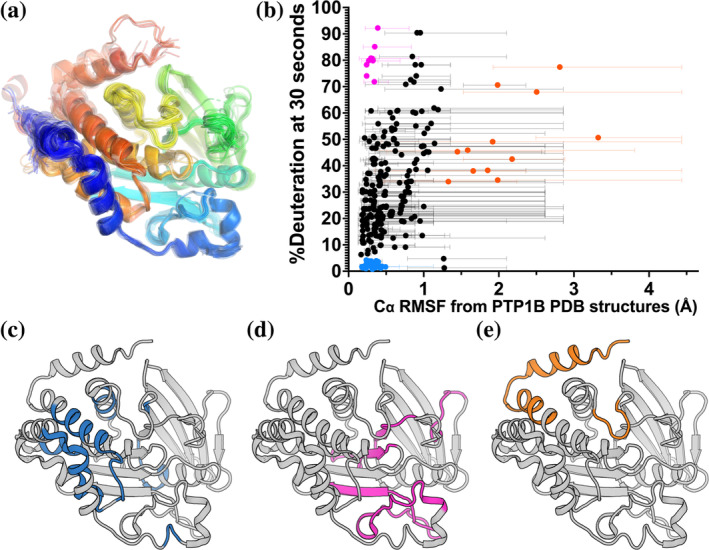
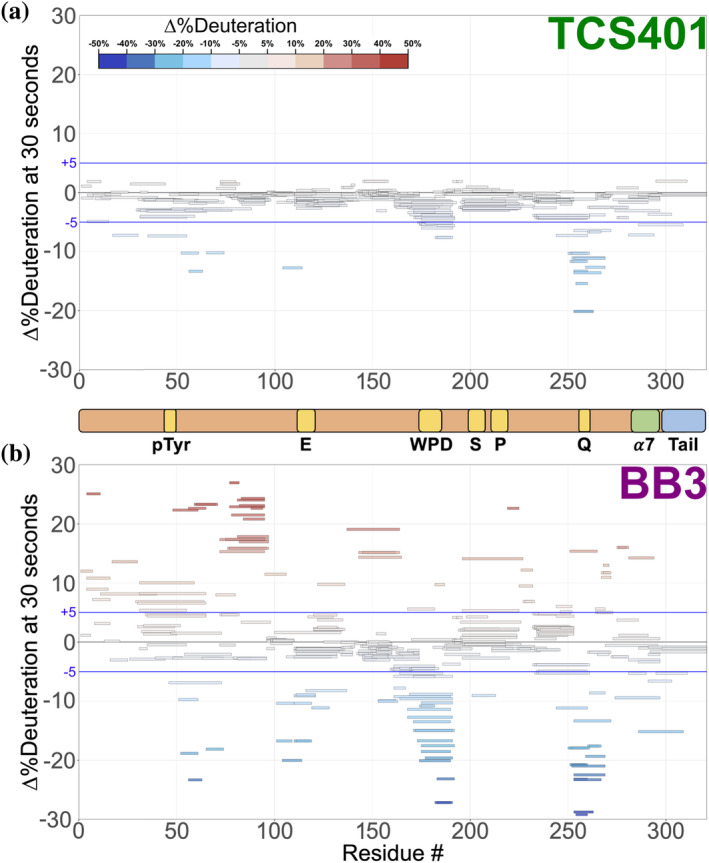
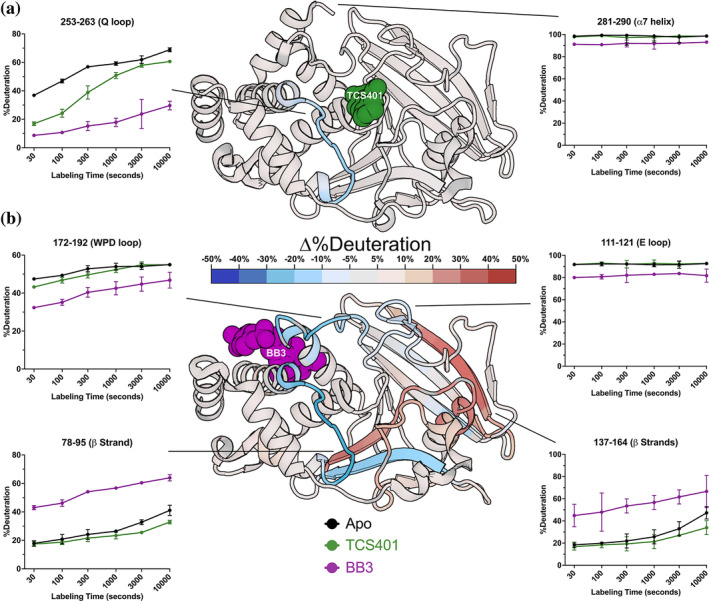
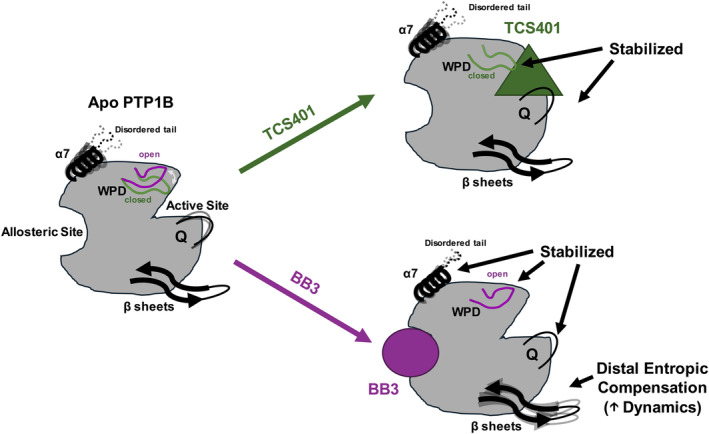
Protein tyrosine phosphatase 1B (PTP1B) is a validated therapeutic target for obesity, diabetes, and certain types of cancer. In particular, allosteric inhibitors hold potential for therapeutic use, but an incomplete understanding of conformational dynamics and allostery in this protein has hindered their development. Here, we interrogate solution dynamics and allosteric responses in PTP1B using high-resolution hydrogen-deuterium exchange mass spectrometry (HDX-MS), an emerging and powerful biophysical technique. Using HDX-MS, we obtain a detailed map of backbone amide exchange that serves as a proxy for the solution dynamics of apo PTP1B, revealing several flexible loops interspersed among more constrained and rigid regions within the protein structure, as well as local regions that exchange faster than expected from their secondary structure and solvent accessibility. We demonstrate that our HDX rate data obtained in solution adds value to estimates of conformational heterogeneity derived from a pseudo-ensemble constructed from ~200 crystal structures of PTP1B. Furthermore, we report HDX-MS maps for PTP1B with active-site versus allosteric small-molecule inhibitors. These maps suggest distinct and widespread effects on protein dynamics relative to the apo form, including changes in locations distal (>35 Å) from the respective ligand binding sites. These results illuminate that allosteric inhibitors of PTP1B can induce unexpected changes in dynamics that extend beyond the previously understood allosteric network. Together, our data suggest a model of BB3 allostery in PTP1B that combines conformational restriction of active-site residues with compensatory liberation of distal residues that aid in entropic balancing. Overall, our work showcases the potential of HDX-MS for elucidating aspects of protein conformational dynamics and allosteric effects of small-molecule ligands and highlights the potential of integrating HDX-MS alongside other complementary methods, such as room-temperature X-ray crystallography, NMR spectroscopy, and molecular dynamics simulations, to guide the development of new therapeutics.

Keywords: HDX‐MS; X‐ray crystallography; allostery; mass spectrometry; protein dynamics; protein structure; structural bioinformatics.


Figures

FIGURE 1
FIGURE 1
Overview of PTP1B structure and key sites. (a) Schematic of full‐length PTP1B primary structure, including catalytic domain and disordered C‐terminus. Key structural sites in the catalytic domain are labeled. The 1–321 construct used throughout this study is indicated below the diagram. The last ~22 residues of this construct do not appear in crystal structures. (b) Superposed structures of the PTP1B catalytic domain bound to the active‐site inhibitor TCS401 (green, PDB ID 5K9W, closed state) and bound to the allosteric inhibitor BB3 (purple, PDB ID 1T49, open state). (c) Close‐up view of PTP1B active site showing the positions of catalytic loops surrounding TCS401.
FIGURE 2
FIGURE 2
High‐resolution local HDX‐MS map for apo PTP1B. (a) Woods plot of HDX rates for 312 peptides of apo PTP1B showing %deuteration at 30 s of labeling for each peptide. (b) Deconvoluted HDX rates at 30 s of labeling time mapped to a crystal structure of the PTP1B catalytic domain in the closed state (PDB ID 1SUG). Several key loops and the α4 helix (residues 187–200) and α7 helix (residues 285–298) are indicated.
FIGURE 3
FIGURE 3
Apo PTP1B local HDX‐MS reaction rates are only partially explained by a pseudo‐ensemble of crystal structures. (a) PTP1B pseudo‐ensemble derived from all non‐PanDDA (Pearce et al., 2017) crystal structures from the PDB (n = 199; see Section 4). Only protein chain A shown; colored from N‐ to C‐terminus (blue to red). (b) Plot of peptide‐level HDX‐MS %deuteration (back‐exchange corrected) at the 30 s time point versus pseudo‐ensemble Cα root‐mean‐square fluctuation (RMSF). Average RMSF values are shown as circles. Range of individual residue RMSF values within each peptide are shown as bars. (c–e) The three peptide groups based on criteria of Cα RMSF and HDX from panel (b), mapped to a crystal structure of the PTP1B catalytic domain in the closed state (PDB ID 1SUG). (c) Peptides with low mean RMSF (<0.5 Å) and low HDX (<5%), in blue. (d) Peptides with low mean RMSF (<0.5 Å) and high HDX (>70%), in magenta. (e) Peptides with high mean RMSF (>1.25 Å), in orange.
FIGURE 4
FIGURE 4
Difference Woods plot of active‐site and allosteric inhibitors relative to apo PTP1B. Difference in %deuteration values at 30 s in each inhibitor‐bound state minus the apo PTP1B state, plotted against amino acid sequence. Blue lines indicate a difference interval of ±5%. (a) Active‐site inhibitor, TCS401. (b) Allosteric inhibitor, BB3.
FIGURE 5
FIGURE 5
Effects of active‐site inhibitor (TCS401) and allosteric site inhibitor (BB3) on local HDX. The structure of PTP1B in complex with (a) the active‐site inhibitor TCS401 (PDB ID 5K9W) and (b) the allosteric inhibitor BB3 (PDB ID 1T49) color‐mapped with the deconvoluted differential HDX values at 30 s of labeling time. Particular peptides of interest have been selected and their fractional deuterium build‐up plots shown. See also Figure S3.
FIGURE 6
FIGURE 6
Model of differential allosteric effects of active‐site versus allosteric inhibitors of PTP1B. Left: Apo PTP1B populates a conformational ensemble in solution, with localized regions with heightened dynamics. Top‐right: TCS401 binds at the active site, stabilizing nearby regions (most prominently the Q loop), but has minimal effects elsewhere. Bottom‐right: By contrast, BB3 binds at the BB allosteric site, distal from the active site, and quenches dynamics in a broader swath of the protein, including the active‐site Q loop and WPD loop. Compensating for this reduced flexibility, BB3 also induces increased dynamics at selected regions on the opposite end of PTP1B from the allosteric site (two distal β‐strands and the α2 helix), demonstrating the proposed entropic compensation mechanism.

Update of

Similar articles

Cited by

References

    1. Andersen JN, Mortensen OH, Peters GH, Drake PG, Iversen LF, Olsen OH, et al. Structural and evolutionary relationships among protein tyrosine phosphatase domains. Mol Cell Biol. 2001;21:7117–7136. - PMC - PubMed
    1. Bakan A, Meireles LM, Bahar I. ProDy: protein dynamics inferred from theory and experiments. Bioinformatics. 2011;27:1575–1577. - PMC - PubMed
    1. Berman HM, Westbrook J, Feng Z, Gilliland G, Bhat TN, Weissig H, et al. The protein data bank. Nucleic Acids Res. 2000;28:235–242. - PMC - PubMed
    1. Best RB, Lindorff‐Larsen K, DePristo MA, Vendruscolo M. Relation between native ensembles and experimental structures of proteins. Proc Natl Acad Sci U S A. 2006;103:10901–10906. - PMC - PubMed
    1. Brandão TAS, Johnson SJ, Hengge AC. The molecular details of WPD‐loop movement differ in the protein‐tyrosine phosphatases YopH and PTP1B. Arch Biochem Biophys. 2012;525:53–59. - PMC - PubMed

MeSH terms

Substances

LinkOut - more resources