. 2024 May;28(10):e18385.
doi: 10.1111/jcmm.18385.

Lithium prevents glucocorticoid-induced osteonecrosis of the femoral head by regulating autophagy

Affiliations

Lithium prevents glucocorticoid-induced osteonecrosis of the femoral head by regulating autophagy

Qiuru Wang et al. J Cell Mol Med. 2024 May.

Abstract

Autophagy may play an important role in the occurrence and development of glucocorticoid-induced osteonecrosis of the femoral head (GC-ONFH). Lithium is a classical autophagy regulator, and lithium can also activate osteogenic pathways, making it a highly promising therapeutic agent for GC-ONFH. We aimed to evaluate the potential therapeutic effect of lithium on GC-ONFH. For in vitro experiments, primary osteoblasts of rats were used for investigating the underlying mechanism of lithium's protective effect on GC-induced autophagy levels and osteogenic activity dysfunction. For in vivo experiments, a rat model of GC-ONFH was used for evaluating the therapeutic effect of oral lithium on GC-ONFH and underlying mechanism. Findings demonstrated that GC over-activated the autophagy of osteoblasts and reduced their osteogenic activity. Lithium reduced the over-activated autophagy of GC-treated osteoblasts through PI3K/AKT/mTOR signalling pathway and increased their osteogenic activity. Oral lithium reduced the osteonecrosis rates in a rat model of GC-ONFH, and restrained the increased expression of autophagy related proteins in bone tissues through PI3K/AKT/mTOR signalling pathway. In conclusion, lithium can restrain over-activated autophagy by activating PI3K/AKT/mTOR signalling pathway and up-regulate the expression of genes for bone formation both in GC induced osteoblasts and in a rat model of GC-ONFH. Lithium may be a promising therapeutic agent for GC-ONFH. However, the role of autophagy in the pathogenesis of GC-ONFH remains controversial. Studies are still needed to further explore the role of autophagy in the pathogenesis of GC-ONFH, and the efficacy of lithium in the treatment of GC-ONFH and its underlying mechanisms.

Keywords: autophagy; glucocorticoid; lithium; osteoblast; osteonecrosis of the femoral head.


Conflict of interest statement

The authors declare no conflict of interest.

Figures

FIGURE 1
FIGURE 1
CYTO‐ID autophagy fluorescence staining of osteoblasts treated with nothing (control group) and dexamethasone in different concentrations (125 μM, 250 μM or 500 μM). (A) Typical images of CYTO‐ID autophagy fluorescence staining. Magnification, 200X. (B) The average fluorescence intensity of CYTO‐ID autophagy fluorescence staining at 24 h and (C) 48 h. *p < 0.05; **p < 0.01; ****p < 0.0001, compared with each other. The error bars indicate the standard deviation of the mean. Con: control group; DEX: dexamethasone group.
FIGURE 2
FIGURE 2
CYTO‐ID autophagy fluorescence staining of osteoblasts treated with nothing (control group), dexamethasone (500 μM) and dexamethasone (500 μM) combined with different concentrations of lithium chloride (0.01 mM, 0.1 mM, 1 mM or 10 mM). (A) Typical images of CYTO‐ID autophagy fluorescence staining. Magnification, 200X. (B) The average fluorescence intensity of CYTO‐ID autophagy fluorescence staining at 48 h. *p < 0.05; **p < 0.01; ****p < 0.0001, compared with each other. The error bars indicate the standard deviation of the mean. Con: control group; DEX: dexamethasone group; Li: dexamethasone combined with lithium chloride group.
FIGURE 3
FIGURE 3
The results of transmission electron microscope (TEM), alkaline phosphatase (ALP) staining and cell counting kit‐8 (CCK8) assay. (A) Typical images of TEM. Boxes in the images at left (magnification, 6000X) show the areas enlarged on the right (magnification, 24,000X). Red arrows indicate autophagosomes. (B) Typical images of ALP staining. Magnification, 20X. (C) The average number of autophagosomes in each group. (D) The average percentage of ALP expression area in each group. (E) The average cell viability (CCK8 assay) in each group. *p < 0.05; **p < 0.01; ***p < 0.001; ****p < 0.0001, compared with each other. The error bars indicate the standard deviation of the mean. Con: control group; DEX: dexamethasone group (500 μM); DEX + Li: dexamethasone (500 μM) combined with lithium chloride (10 mM) group.
FIGURE 4
FIGURE 4
The results of RT‐qPCR from osteoblasts. The average relative expression of (A) RUNX2, (B) LC3B, (C) AKT, and (D) mTOR.
FIGURE 5
FIGURE 5
The results of western blot analysis from osteoblasts. (A) Typical images of western blot analysis from osteoblasts. The average relative expression of (B) RUNX2, (C) phosphorylated AKT/AKT, (D) phosphorylated mTOR/mTOR, and (E) LC3II/I. *p < 0.05; **p < 0.01; ***p < 0.001; ****p < 0.0001, compared with each other. The error bars indicate the standard deviation of the mean. Con: control group; DEX: dexamethasone group (500 μM); DEX + Li: dexamethasone (500 μM) combined with lithium chloride (10 mM) group. p‐AKT: phosphorylated AKT; p‐mTOR: phosphorylated mTOR.
FIGURE 6
FIGURE 6
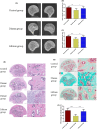
(A‐C) The results of micro‐computed tomography. (A) Typical images of micro‐computed tomography. (B) Bone volume as a percentage of total volume. (C) Trabecular number per mm. *p < 0.05; **p < 0.01; ***p < 0.001; ****p < 0.0001, compared with each other. The error bars indicate the standard deviation of the mean. (D‐F) The results of Haematoxylin–eosin staining and Goldner staining. The typical images of (D) Haematoxylin–eosin staining and (E) Goldner staining. Boxes in the images at left (magnification, 20X) show the areas enlarged on the right (magnification, 100X). Arrows in the second line of Haematoxylin–eosin staining indicate empty lacunae or pyknotic nucleus. The third line of Haematoxylin–eosin staining indicate abnormal hyperplasia of articular surface cartilage. (F) The average percentage of osteoid area of Goldner staining. ****p < 0.0001, compared with each other. The error bars indicate the standard deviation of the mean.
FIGURE 7
FIGURE 7
The results of immunohistochemistry. (A) Typical images of immunohistochemistry. Magnification, 200X. The average relative expression of (B) RUNX2, (C) phosphorylated AKT/AKT, (D) phosphorylated mTOR/mTOR, and (E) LC3B. **p < 0.01; ***p < 0.001; ****p < 0.0001, compared with each other. The error bars indicate the standard deviation of the mean. p‐AKT: phosphorylated AKT; p‐mTOR: phosphorylated mTOR.

Similar articles

Cited by

References

    1. Yang Z, Liu H, Li D, et al. The efficacy of statins in preventing glucocorticoid‐related osteonecrosis in animal models: A meta‐analysis. Bone Joint Res. 2016;5(9):393‐402. - PMC - PubMed
    1. Fukushima W, Fujioka M, Kubo T, Tamakoshi A, Nagai M, Hirota Y. Nationwide epidemiologic survey of idiopathic osteonecrosis of the femoral head. Clin Orthop Relat Res. 2010;468(10):2715‐2724. - PMC - PubMed
    1. Okazaki S, Nagoya S, Matsumoto H, et al. Development of non‐traumatic osteonecrosis of the femoral head requires toll‐like receptor 7 and 9 stimulations and is boosted by repression on nuclear factor kappa B in rats. Lab Investig. 2015;95(1):92‐99. - PMC - PubMed
    1. Li M, Gao P, Zhang J. Crosstalk between autophagy and apoptosis: potential and emerging therapeutic targets for cardiac diseases. Int J Mol Sci. 2016;17(3):332. - PMC - PubMed
    1. Luo P, Gao F, Han J, Sun W, Li Z. The role of autophagy in steroid necrosis of the femoral head: a comprehensive research review. Int Orthop. 2018;42(7):1747‐1753. - PubMed

MeSH terms