

Prognostic impact and immunotherapeutic implications of NETosis-related prognostic model in clear cell renal cell carcinoma
- PMID: 38801430
- PMCID: PMC11129999
- DOI: 10.1007/s00432-024-05761-y
Prognostic impact and immunotherapeutic implications of NETosis-related prognostic model in clear cell renal cell carcinoma
Abstract
Background: The ramifications of necroptosis on the prognostication of clear cell renal cell carcinoma (ccRCC) remain inadequately expounded.
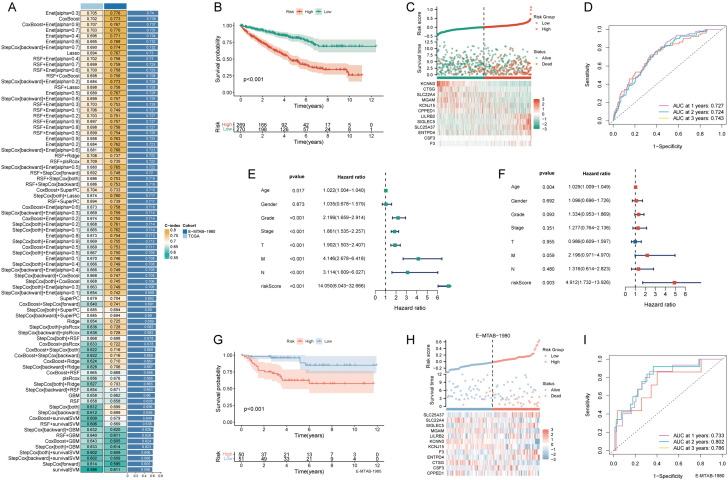
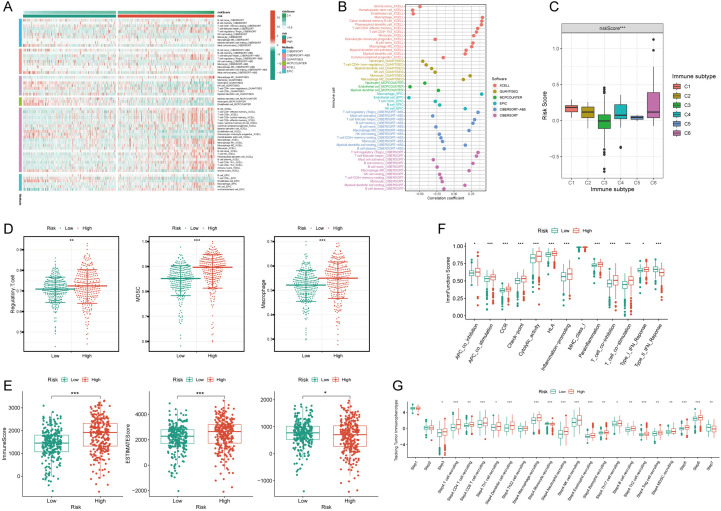
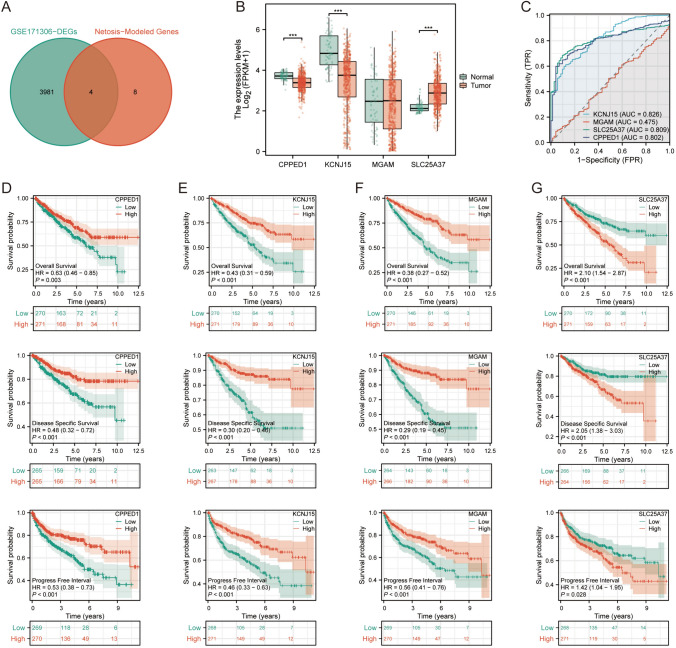
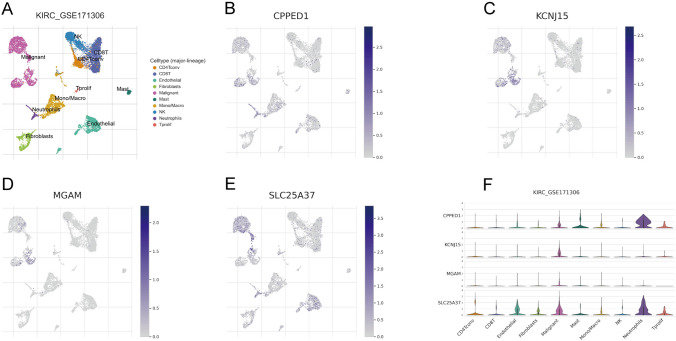
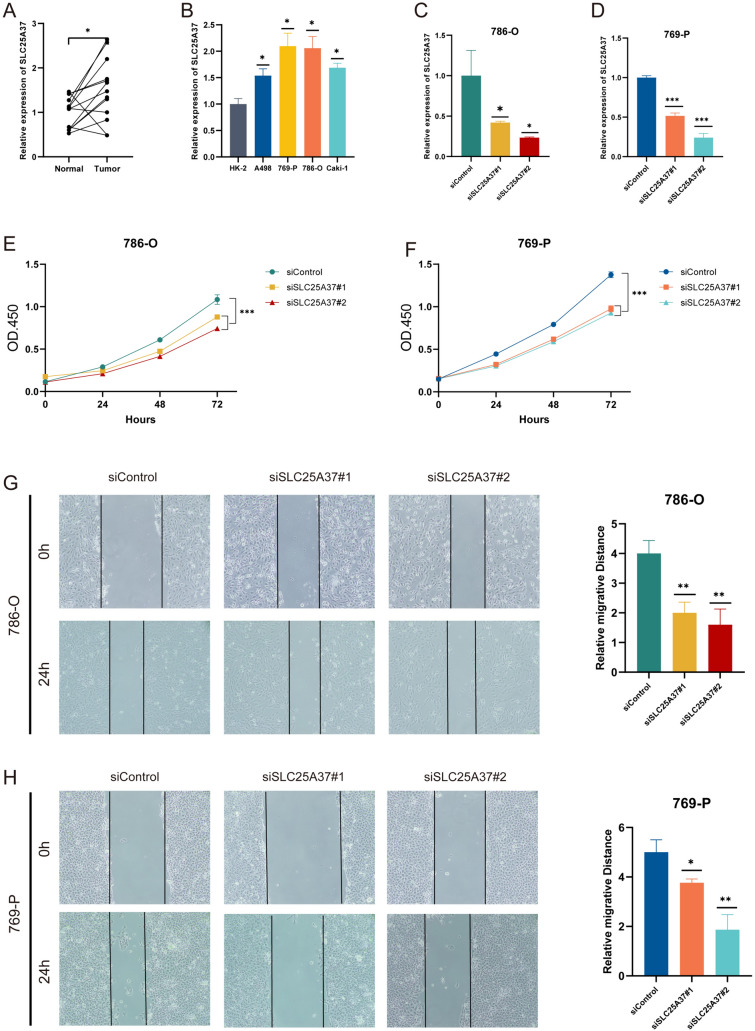
Methods: A prognostic model delineating the facets of necroptosis in ccRCC was constructed, employing a compendium of algorithms. External validation was effectuated using the E-MTAB-1980 dataset. The exploration of immune infiltration scores was undertaken through the exploitation of multiple algorithms. Single-cell RNA sequencing data were procured from the GSE171306 dataset. Real-time quantitative PCR (RT-qPCR) was engaged to scrutinize the differential expression of SLC25A37 across cancer and paracancer tissues, as well as diverse cell lines. Assessments of proliferative and metastatic alterations in 769-P and 786-O cells were accomplished through Cell Counting Kit-8 (CCK8) and wound healing assays.
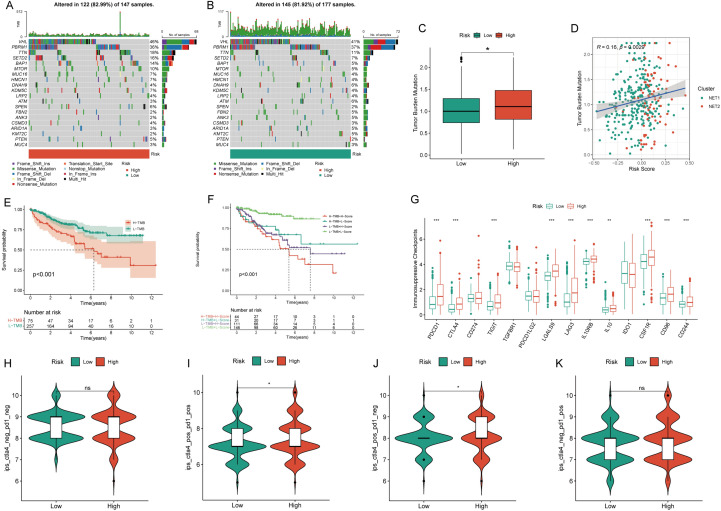
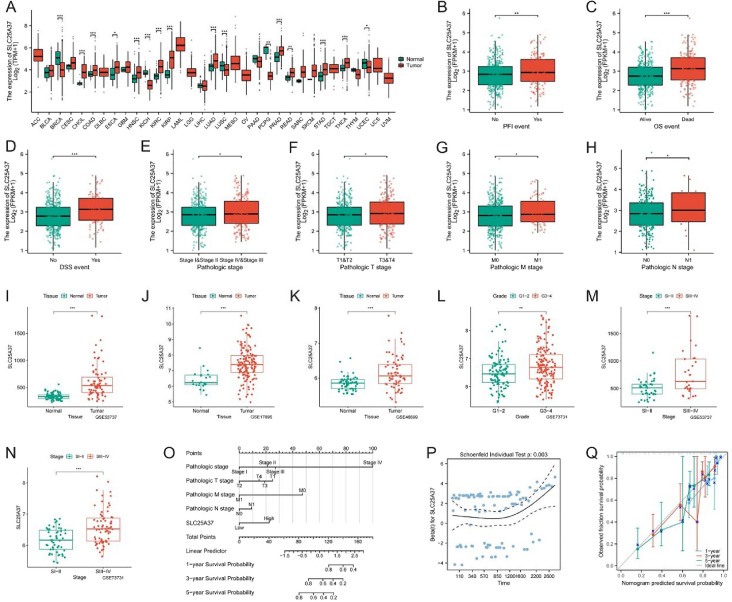
Results: The necroptosis-related signature (NRS) emerges as a discerning metric, delineating patients' immune attributes, tumor mutation burden, immunotherapy response, and drug susceptibility. Single-cell RNA sequencing analysis unveils the marked enrichment of SLC25A37 in tumor cells. Concurrently, RT-qPCR discloses the overexpression of SLC25A37 in both ccRCC tissues and cell lines. SLC25A37 knockdown mitigates the proliferative and metastatic propensities of 769-P and 786-O cells, as evidenced by CCK8 and wound healing assays.
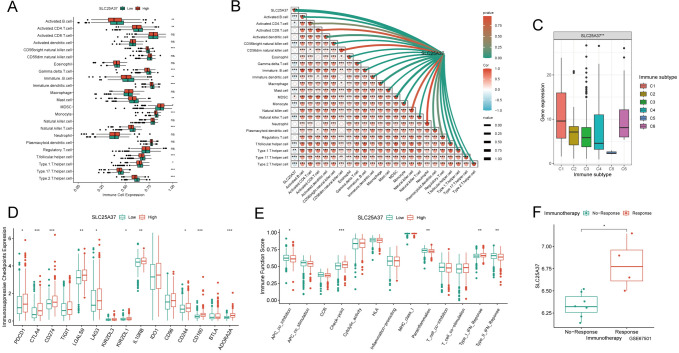
Conclusion: The NRS assumes a pivotal role in ascertaining the prognosis, tumor mutation burden, immunotherapy response, drug susceptibility, and immune cell infiltration features of ccRCC patients. SLC25A37 emerges as a putative player in immunosuppressive microenvironments, thereby providing a prospective avenue for the design of innovative immunotherapeutic targets for ccRCC.
Keywords: Clear cell renal cell carcinoma; Necroptosis; SLC25A37; Single-cell analysis; Tumor microenvironment.
© 2024. The Author(s).
Conflict of interest statement
The authors declare no conflict of interests.
Figures
Similar articles
-
Identification and validation of prognostic and tumor microenvironment characteristics of necroptosis index and BIRC3 in clear cell renal cell carcinoma.PeerJ. 2023 Dec 18;11:e16643. doi: 10.7717/peerj.16643. eCollection 2023. PeerJ. 2023. PMID: 38130918 Free PMC article.
-
Integrated single-cell and bulk characterization of branched chain amino acid metabolism-related key gene BCAT1 and association with prognosis and immunogenicity of clear cell renal cell carcinoma.Aging (Albany NY). 2024 Feb 2;16(3):2715-2735. doi: 10.18632/aging.205506. Epub 2024 Feb 2. Aging (Albany NY). 2024. PMID: 38309289 Free PMC article.
-
Comprehensive analysis of heat shock protein 110, 90, 70, 60 families and tumor immune microenvironment characterization in clear cell renal cell carcinoma.Sci Rep. 2025 Jan 2;15(1):469. doi: 10.1038/s41598-024-84834-x. Sci Rep. 2025. PMID: 39747468 Free PMC article.
-
TUBA1C orchestrates the immunosuppressive tumor microenvironment and resistance to immune checkpoint blockade in clear cell renal cell carcinoma.Front Immunol. 2024 Sep 5;15:1457691. doi: 10.3389/fimmu.2024.1457691. eCollection 2024. Front Immunol. 2024. PMID: 39301023 Free PMC article.
-
Exploring necrosis-associated mitochondrial gene signatures: revealing their role in prognosis and immunotherapy of renal clear cell carcinoma.Clin Exp Med. 2024 Jul 18;24(1):161. doi: 10.1007/s10238-024-01426-9. Clin Exp Med. 2024. PMID: 39023752 Free PMC article. Review.
Cited by
-
The role of adherent-to-suspension transition factors in clear cell renal cell carcinoma progression: a comprehensive analysis.Sci Rep. 2025 Apr 19;15(1):13618. doi: 10.1038/s41598-025-96807-9. Sci Rep. 2025. PMID: 40253446 Free PMC article.
-
Integrating bulk, single-cell, and spatial transcriptomics to identify and functionally validate novel targets to enhance immunotherapy in NSCLC.NPJ Precis Oncol. 2025 Apr 16;9(1):112. doi: 10.1038/s41698-025-00893-x. NPJ Precis Oncol. 2025. PMID: 40240582 Free PMC article.
References
-
- Barata PC, Rini BI (2017) Treatment of renal cell carcinoma: current status and future directions. CA Cancer J Clin 67:507–524 - PubMed
-
- Bianchi C, Meregalli C, Bombelli S, Di Stefano V, Salerno F, Torsello B, De Marco S, Bovo G, Cifola I, Mangano E, Battaglia C, Strada G, Lucarelli G, Weiss RH, Perego RA (2017) The glucose and lipid metabolism reprogramming is grade-dependent in clear cell renal cell carcinoma primary cultures and is targetable to modulate cell viability and proliferation. Oncotarget 8:113502–113515 - PMC - PubMed
-
- Bombelli S, Torsello B, De Marco S, Lucarelli G, Cifola I, Grasselli C, Strada G, Bovo G, Perego RA, Bianchi C (2020) 36-kDa annexin A3 isoform negatively modulates lipid storage in clear cell renal cell carcinoma cells. Am J Pathol 190:2317–2326 - PubMed
-
- Bray F, Ferlay J, Soerjomataram I, Siegel RL, Torre LA, Jemal A (2018) Global cancer statistics 2018: GLOBOCAN estimates of incidence and mortality worldwide for 36 cancers in 185 countries. CA Cancer J Clin 68:394–424 - PubMed
MeSH terms
Substances
Grants and funding
LinkOut - more resources
Full Text Sources
Medical
