. 2024 May 27;147(1):92.
doi: 10.1007/s00401-024-02743-9.

Neuropathological findings in Down syndrome, Alzheimer's disease and control patients with and without SARS-COV-2: preliminary findings

Affiliations

Neuropathological findings in Down syndrome, Alzheimer's disease and control patients with and without SARS-COV-2: preliminary findings

Ann-Charlotte E Granholm et al. Acta Neuropathol. .

Abstract

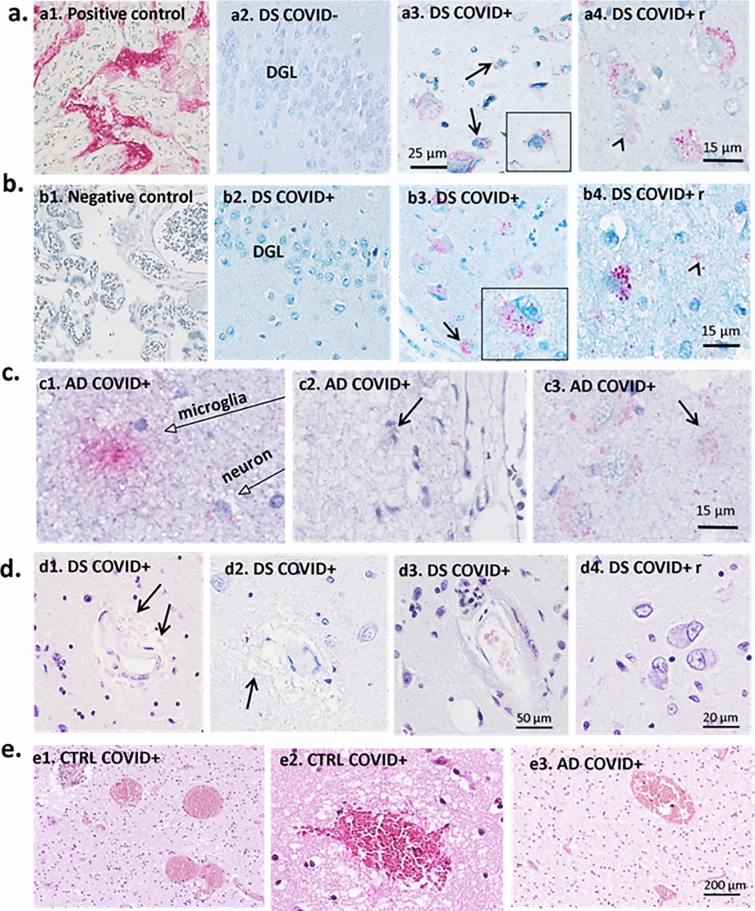
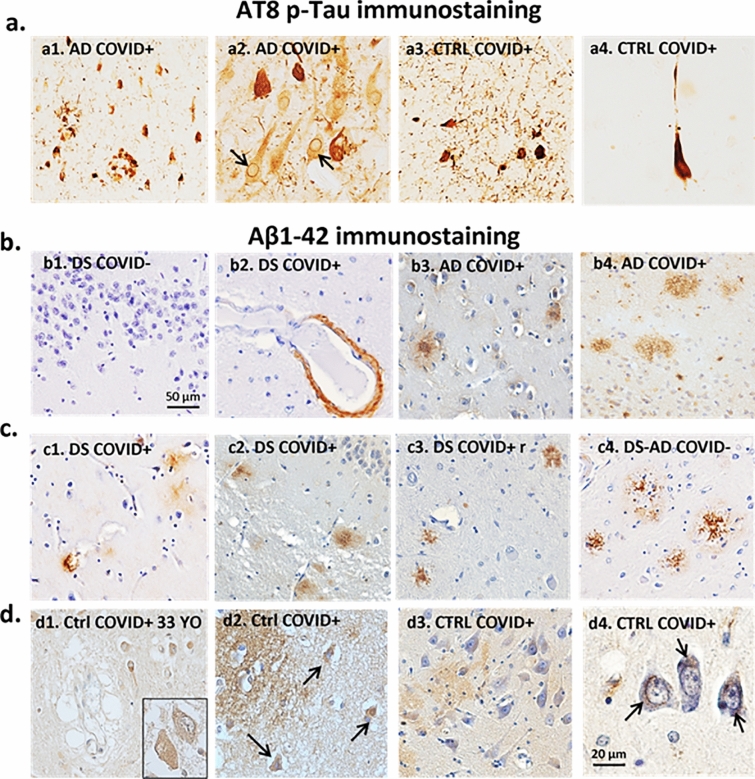
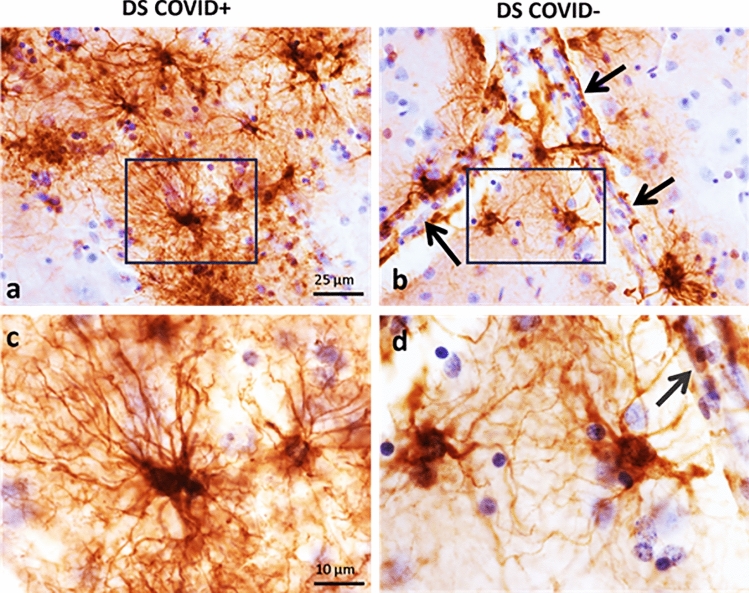
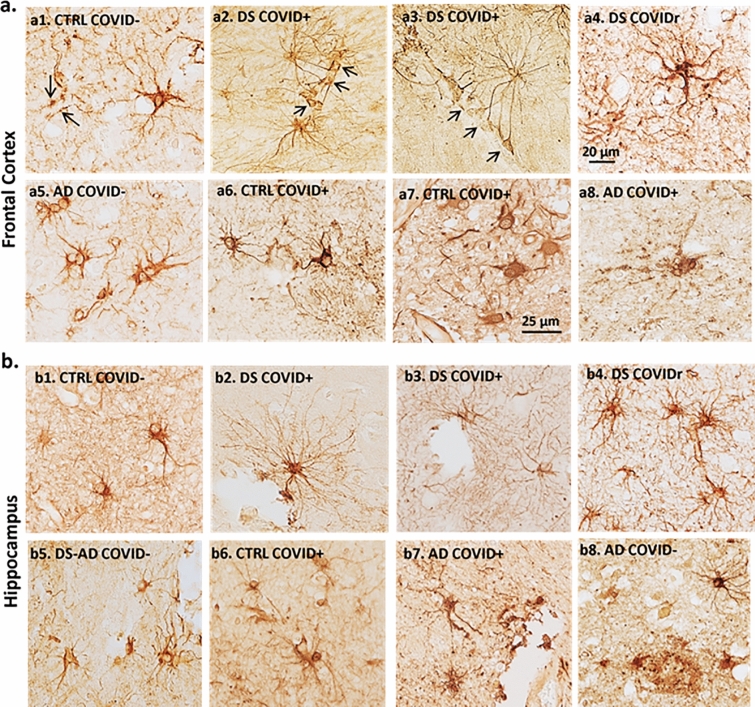
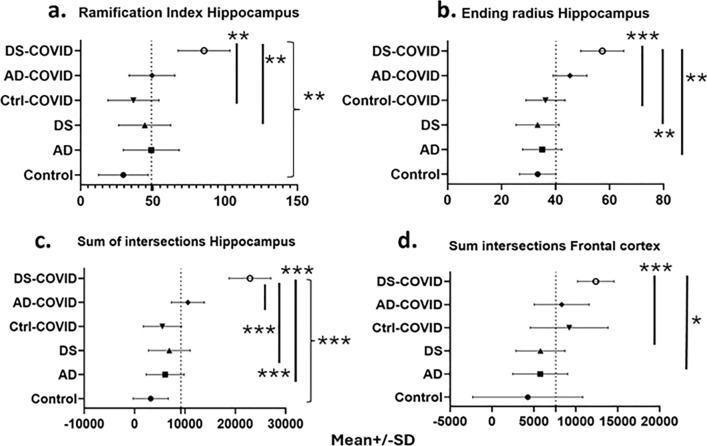
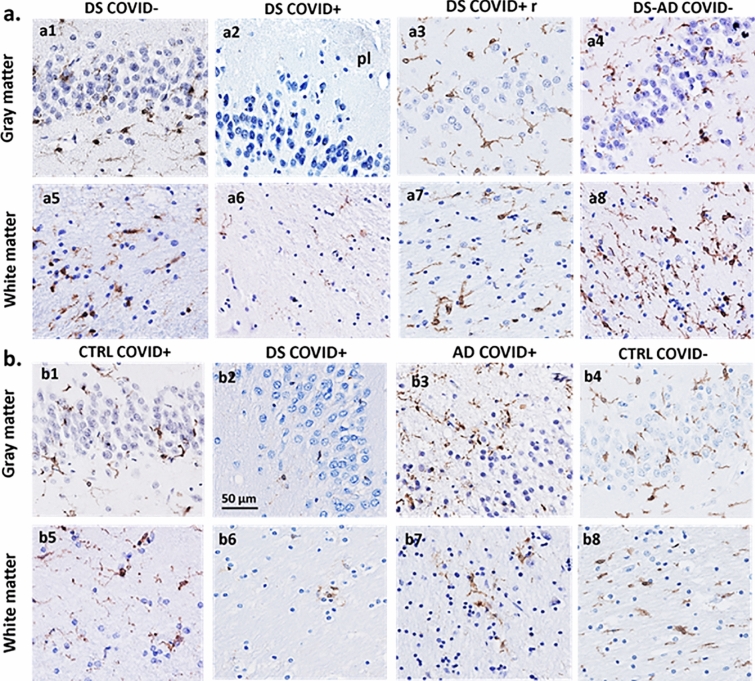
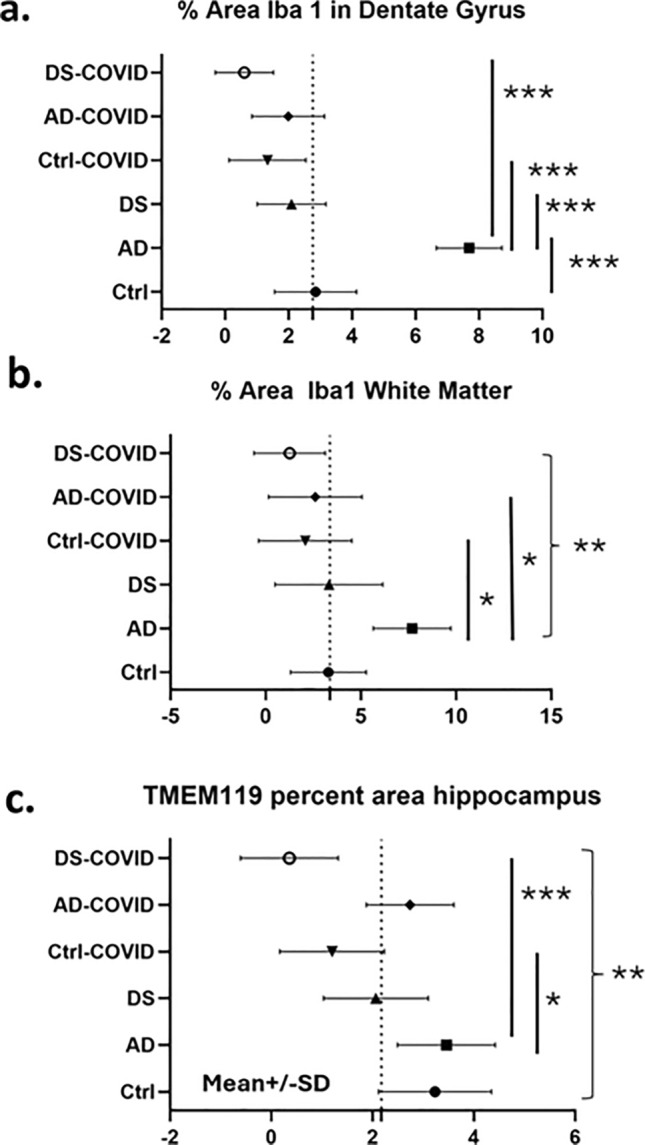
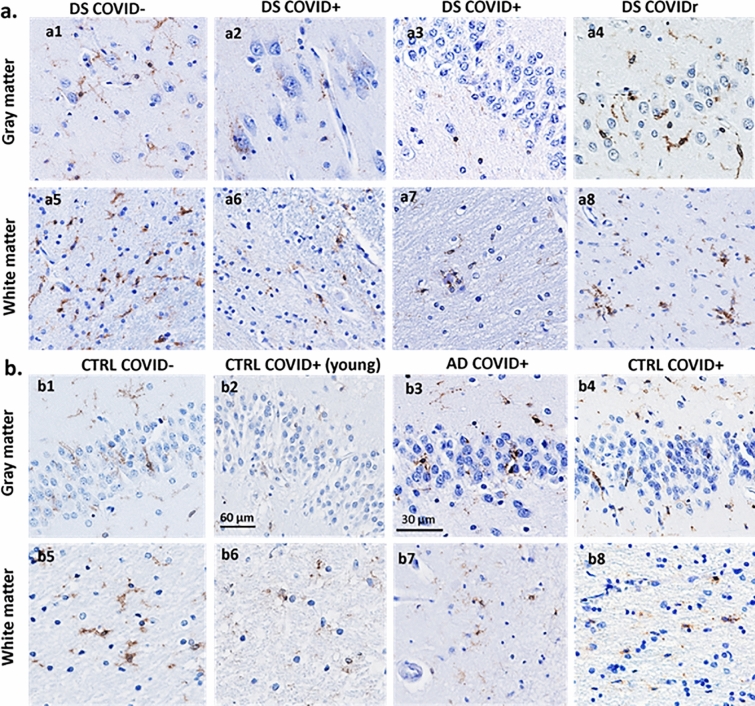
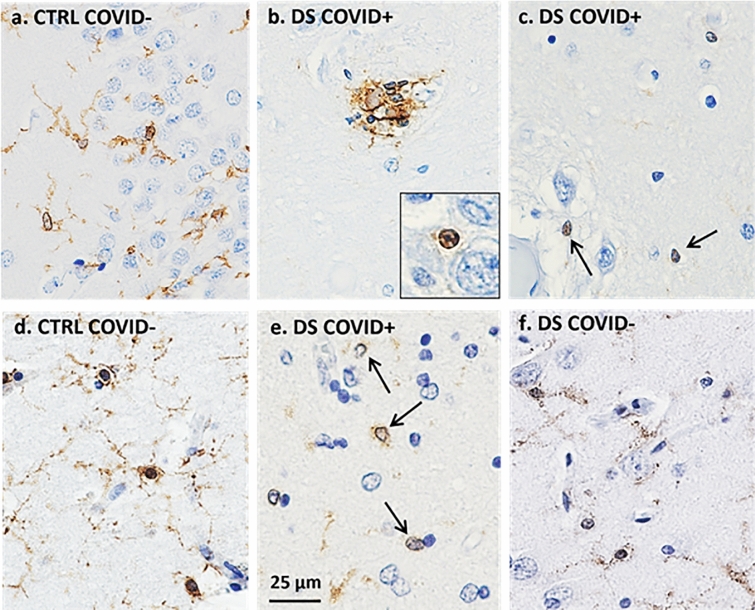
The SARS-CoV-2 virus that led to COVID-19 is associated with significant and long-lasting neurologic symptoms in many patients, with an increased mortality risk for people with Alzheimer's disease (AD) and/or Down syndrome (DS). However, few studies have evaluated the neuropathological and inflammatory sequelae in postmortem brain tissue obtained from AD and people with DS with severe SARS-CoV-2 infections. We examined tau, beta-amyloid (Aβ), inflammatory markers and SARS-CoV-2 nucleoprotein in DS, AD, and healthy non-demented controls with COVID-19 and compared with non-infected brain tissue from each disease group (total n = 24). A nested ANOVA was used to determine regional effects of the COVID-19 infection on arborization of astrocytes (Sholl analysis) and percent-stained area of Iba-1 and TMEM 119. SARS-CoV-2 antibodies labeled neurons and glial cells in the frontal cortex of all subjects with COVID-19, and in the hippocampus of two of the three DS COVID-19 cases. SARS-CoV-2-related alterations were observed in peri-vascular astrocytes and microglial cells in the gray matter of the frontal cortex, hippocampus, and para-hippocampal gyrus. Bright field microscopy revealed scattered intracellular and diffuse extracellular Aβ deposits in the hippocampus of controls with confirmed SARS-CoV-2 infections. Overall, the present preliminary findings suggest that SARS-CoV-2 infections induce abnormal inflammatory responses in Down syndrome.

Keywords: Alzheimer’s disease; Brain; COVID-19; Corona viruses; Down syndrome; Glial cells; Neurologic symptoms; SARS-CoV-2.


Conflict of interest statement

The authors declare that they have no competing interests.

Figures

Fig. 1
Fig. 1
SARS-CoV-2 nucleoprotein immunostaining and H&E histochemistry. ac SARS-CoV-2 nucleoprotein immunostaining (red stain) in positive (a1) and negative (b1) controls, AD and DS cases. a1 is a positive control (human placenta) and b1 is a negative control (human placenta). a2 is a micrograph from the dentate gyrus of a 37-year-old negative DS control (case #18 in Table 1). a3 and a4: SARS-CoV-2 immunoreactivity in neurons and glia cells (arrows in a3 and a4) in the frontal cortex in a 31-year-old DS COVID + case. The a3 inset shows a glial cell displaying punctate SARS-CoV-2 nucleoprotein cytoplasmic staining in a DS COVID + case. a4 displays SARS-Cov-2-positive neurons and microglia in layers II-III of frontal cortex from 50-year-old male with confirmed COVID infection a year before death but negative at death (DS COVID + r). a2–4 shows SARS-CoV-2 nucleoprotein immunostaining in the hippocampus of a 35-year-old who died from acute COVID (b2), the 31-year-old DS COVID + case (b3), and the 50-year-old who recovered before death (DS COVID + r, b4). Note the lack of nucleoprotein immunoreactivity in the dentate gyrus granule cell layer (DGL) of the hippocampus in the 35-year-old case (b2) compared to the strong positive staining observed in the 31-year-old acute DS COVID case (b3) and the recovered case (b4), suggesting a temporal spread of the virus from frontal cortex to the hippocampus. The inset in b3 shows strong punctate SARS-CoV-2 labeling in a CA1 neuron in the hippocampus. Arrows in b3 and b4 mark glial cells labeled with the nucleoprotein antibodies. c1–c3: SARS-CoV-2 nucleoprotein labeling in cortex of AD COVID + cases from autopsy at Lund University. Note a strongly positive microglial cell in c1, and arrows pointing to positive glial cells in c2 and c3. C2 depicts positive cells (red labeling) in Layer I of the frontal cortex. Since this layer is devoid of neurons, positive cells in this layer represent glial cells only. d and e H&E hippocampal staining showing vascular abnormalities including microbleeds (d1, arrows) and extravasation of erythrocytes (d2 and d3) and vacuolization (arrow d2) as well as inflammatory infiltrates (d3) and neurodegenerative changes including dying and pyknotic neuronal cell bodies (d4) in all three DS COVID + and the DS COVID + r (d4) cases. e1–e3: H&E staining shows vascular abnormalities including focal congestion-like vein dilatation (e1, e3) and mild rupture of the vein wall with limited perifocal bleeding (e2) in the frontal cortex of a control COVID + and an AD COVID + case, respectively. Sections shown in panels a–c were counterstained with hematoxylin. Scale bar in a3 represents 25 microns in a1-3; scale bar in a4 represents 15 microns; scale bar in b4 represents 15 microns for b1-4; scale bar in c3 represents 15 microns for c1–3; scale bar in d3 represents 50 microns for d1–3; scale bar in d4 represents 20 microns and scale bar in e3 represents 200 microns for e1-3
Fig. 2
Fig. 2
AT8 and Aβ1-42 immunostaining. a Images showing AT8 positive NFTs in the frontal cortex (a1) and hippocampus (a2-a4). a1-a2. AD COVID + cases contained frequent NFTs (dark brown staining) and lightly labeled neurons with an intact morphology (i.e., pre-tangles) in frontal cortex and hippocampus (arrows), respectively, compared to a few scattered NFTs in control COVID + cases (a3, a4). Note numerous AT8 positive neuropil threads in the hippocampus of a 71-year-old control COVID + case (Fig. 2a3) compared to a rare NFT observed in the CA1 of a 65-year-old patient with COVID (Fig. 2a4). b and c Aβ1-42 (brown) immunostaining in AD, DS, and control cases. b1. Aβ immunostaining was not observed in DG of the hippocampus of a young person with DS (37-year-old) without COVID-19. b2–b4. Images showing an occasional Aβ positive blood vessel in the frontal cortex (b2) of a DS COVID + case, and numerous fibrillar and diffuse amyloid plaques in the AD COVID + cases (b3 and 4). c. Frontal cortex diffuse Aβ (c1-c2) in DS COVID + cases compared to neuritic plaques in the DS COVID + r case (c3) and a DS-AD COVID- case (c4). The DS-AD case depicted in c4 was a 66-year-old male with DS, while the DS COVID + cases in c1 and c2 were 31 and 35 years old, respectively, and the DS COVID + r case in c3 was 50 years old. d Weak to moderate deposits of diffuse (d2, age 37 and d3, age 71 years) and intracellular (d1, age 33, d2 age 37 (arrows) and d4, age 65 (arrows) Aβ1-42 immunostaining were seen in the CA1 and dentate gyrus of the hippocampus in 5 out of 5 control COVID + cases (d1-4). All sections in panels b-d were counterstained with Hematoxylin. The scale bar in b1 represents 50 microns for a1, a3, b1, b3, c1-c4, and scale bar in b4 = 20 microns in b4, a2, and a4
Fig. 3
Fig. 3
GFAP immunostaining in the frontal cortex. Low (a and b) and high (c and d) magnification photomicrographs showing GFAP positive astrocytes in the frontal cortex gray matter of a 31-year-old DS COVID + (a, c) compared to a 37-year-old DS COVID- (b, d) case. Panels c and d show a higher magnification image of the boxed area in a and b displaying an increase in the length and number of GFAP positive processes in a DS COVID + (C) compared to a COVID- (d) DS case. Black arrows in b and d indicate the close apposition of GFAP processes with the vascular wall. All sections were counterstained with H&E. The scale bar in a = 25 µm applies to b, and bar in c = 10 µm, which applies to d
Fig. 4
Fig. 4
GFAP immunostaining in the frontal cortex (a) and hippocampus (b) across cases. Frontal cortex (a1-8) and hippocampal (b1-8) images showing differences in morphology between GFAP labeled peri-vascular astrocytes (brown) in DS COVID + compared to other cases. GFAP positive glia exhibited long processes with prominent end-feet in close apposition to the vascular wall (arrows) in DS COVID + cases (a2,3 and b2,3) compared to smaller cell bodies and fewer slender branched processes in the frontal cortex (a1, arrows) and hippocampus (b1) in control non-COVID cases. AD (a5, b8) and DS-AD (b5) COVID- cases displayed GFAP positive astrocytes with thicker but shorter processes. Control COVID + (a6, a7, b6) and AD COVID + (a8, b7) cases exhibit reduced GFAP astrocytic activation and occasionally displayed an apoptotic or necrotic cell (a8, b7). The scale bar in a5 represents 20 microns for all panels except for a8, where the scale bar represents 10 microns
Fig. 5
Fig. 5
Sholl analysis of differences in astrocytic morphology across groups. a Analysis revealed a significantly higher ramification index for peri-vascular astrocytes in the gray matter in DS COVID + group compared to DS COVID- (Tukey test, p = 0.04, n = 24) and control non-COVID (Tukey test, p = 0.004) and COVID + (Tukey test, p = 0.01) groups. b Ending radius measurements of peri-vascular astrocytic processes were significantly greater in DS COVID + compared to control COVID + (Tukey test, p = 0.0007), AD COVID- (Tukey test, p = 0.002), and DS COVID- (Tukey test, p = 0.001) groups. c. Analysis of the sum of intersections in the hippocampal gray matter revealed significant differences between groups (Nested ANOVA, p =  < 0.0001) with greater numbers of astrocytic intersections in the DS COVID + group. The Tukey post-hoc test revealed significant differences between control COVID- vs. DS COVID + (p < 0.0001), AD COVID- vs. DS COVID + (p < 0.0001), DS COVID- vs. DS COVID + (p < 0.0001), control COVID + vs. DS COVID + (p < 0.0001), and AD COVID + vs. DS COVID + (p = 0.0006). d Nested ANOVA analysis revealed significant differences in the sum of intersections only for frontal cortex gray matter between groups; Tukey post hoc test revealed a greater sum of intersections in DS COVID + compared AD COVID-, p = 0.02) and DS COVID- (p = 0.01) groups
Fig. 6
Fig. 6
Hippocampal Iba-1 immunostaining in the dentate granule cell layer (DGL) and white matter between COVID + and COVID- cases. a. Images showing a reduction in Iba-1-ir cells in DGL (a1-a4) and white matter (a5-a8) in DS COVID + (a2, a6) compared to DS COVID- (a1, a5) and DS-AD COVID- (a4, a8) cases, while intermediate Iba-1 cell immunostaining was seen in the DS COVID + r (a3, a7) case. b. Images showing reduced Iba-1 positive cells in the DGL (b1-b4) and white matter (b5-b8) in a DS COVID + (b2) compared to control COVID + (b1), AD COVID + (b3) and control COVID- (b4) case. The DS COVID + case depicted in a2 and a6 was 31 years old, and the DS COVID + case depicted in B2 and B6 was 35 years old, respectively, while the DS COVID- case in A1 and A5 was 37 years old, and the DS COVID + r case depicted in a3 and a7 was 50 years old. The DS COVID- case shown in a1 and a5 was 37-years old. All sections were counterstained with Hematoxylin. Scale bar in b2 = 50 µm applies to all panels
Fig. 7
Fig. 7
Analysis of Iba-1 and TMEM119 immunostaining density in hippocampal dentate gyrus and white matter. a Percent area of Iba-1 immunostaining was significantly lower in DS COVID + , DS COVID-, control COVID-, and control COVID + in hippocampal gray matter compared to AD COVID- cases (Tukey test, p < 0.0001 for all groups in comparison to the AD COVID- group, n = 20). b Measurements of the percent area of Iba-1 staining in the white matter was significantly greater in AD COVID- compared to DS COVID-, control COVID + , AD COVID + , DS COVID + groups (Tukey–Kramer test, p < 0.0001 for all groups). c Percent immunostaining in hippocampal white matter as examined using a nested ANOVA analysis. Nested one-way ANOVA, p value 0.0003 p value summary***, F, DFd, Dfd 6.2, 5, 40. Significance: DS COVID vs. AD COVID p = 0.0076, DS COVID vs. AD p = 0.0006, DS COVID vs. Ctrl, p = 0.0041, Ctrl-COVID vs. AD: p = 0.0279
Fig. 8
Fig. 8
Microglial TMEM119 immunoreactivity in gray and white matter of the hippocampus. a Images showing a reduction in TMEM119-ir cells in the CA1 region (a2) and the DGL (a3) and white matter (a6, a7) in DS COVID + (a2, a3, a6, a7) compared to a DS COVID- (a1, a5) and DS COVID + r (a4, a8) case. b Images showing less TMEM119 immunoreactivity in the DGL (b2) and white matter (b6) of the hippocampus in a young control COVID + (33-year-old) compared to control COVID- (59-year-old) (b1, b5), AD COVID + (71-year-old) (b3, b7) and an older control COVID + (71-year-old) (b4, b8) case. All sections were counterstained with Hematoxylin. The scale bar in b3 represent 30 microns in a2, a3, a4, and b3, and the scale bar in b2 represents 60 microns for the rest of the panels
Fig. 9
Fig. 9
Morphologic features of Iba-1 (a–c) and TMEM119 (df) positive hippocampal microglia in control COVID- and DS COVID + cases. Microglial cells stained for Iba-1(b, c) and TMEM119 (e) displayed a rounded appearance with few processes (arrows in c and e, and inset in b), resembling the morphology observed in phagocytic microglial cells, in DS COVID + (b, c, e) compared to more elongated cell bodies and extensive processes seen in control COVID- (a, d) and DS COVID- (f) cases. Clusters of Iba-1 immunostained microglial cells were occasionally observed in white matter (b) in DS COVID + cases. All sections were counterstained with Hematoxylin. The scale bar in d represents 25 microns for all images

Similar articles

Cited by

References

    1. Aarts E, Verhage M, Veenvliet JV, Dolan CV, van der Sluis S. A solution to dependency: using multilevel analysis to accommodate nested data. Nat Neurosci. 2014;17:491–496. doi: 10.1038/nn.3648. - DOI - PubMed
    1. Ahmed S, Paramasivam P, Kamath M, Sharma A, Rome S, Murugesan R. Genetic exchange of lung-derived exosome to brain causing neuronal changes on COVID-19 infection. Mol Neurobiol. 2021;58:5356–5368. doi: 10.1007/s12035-021-02485-9. - DOI - PMC - PubMed
    1. Aldecoa I, Barroeta I, Carroll SL, Fortea J, Gilmore A, Ginsberg SD, Guzman SJ, Hamlett ED, Head E, Perez SE, et al. Down syndrome biobank consortium: a perspective. Alzheimers Dement. 2024;20:2262–2272. doi: 10.1002/alz.13692. - DOI - PMC - PubMed
    1. Alldred MJ, Lee SH, Petkova E, Ginsberg SD. Expression profile analysis of hippocampal CA1 pyramidal neurons in aged Ts65Dn mice, a model of Down syndrome (DS) and Alzheimer's disease (AD) Brain Struct Funct. 2015;220:2983–2996. doi: 10.1007/s00429-014-0839-0. - DOI - PMC - PubMed
    1. Bennett ML, Bennett FC, Liddelow SA, Ajami B, Zamanian JL, Fernhoff NB, Mulinyawe SB, Bohlen CJ, Adil A, Tucker A, et al. New tools for studying microglia in the mouse and human CNS. Proc Natl Acad Sci U S A. 2016;113:E1738–1746. doi: 10.1073/pnas.1525528113. - DOI - PMC - PubMed

Publication types

MeSH terms