. 2024 Jun 11;18(23):14893-14906.
doi: 10.1021/acsnano.3c10632. Epub 2024 May 27.

Multimodal Imaging-Guided Stem Cell Ocular Treatment

Affiliations

Multimodal Imaging-Guided Stem Cell Ocular Treatment

Van Phuc Nguyen et al. ACS Nano. .

Abstract

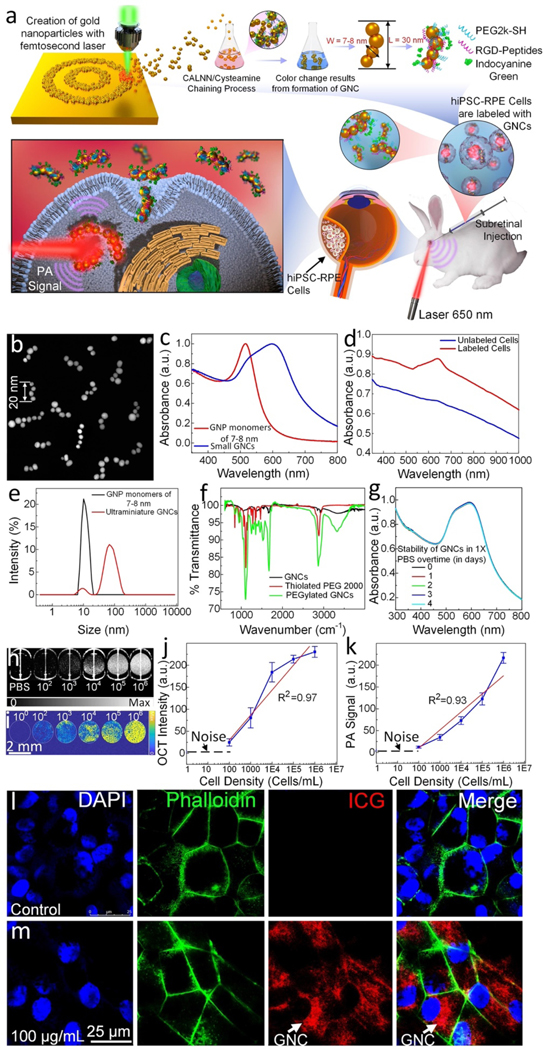
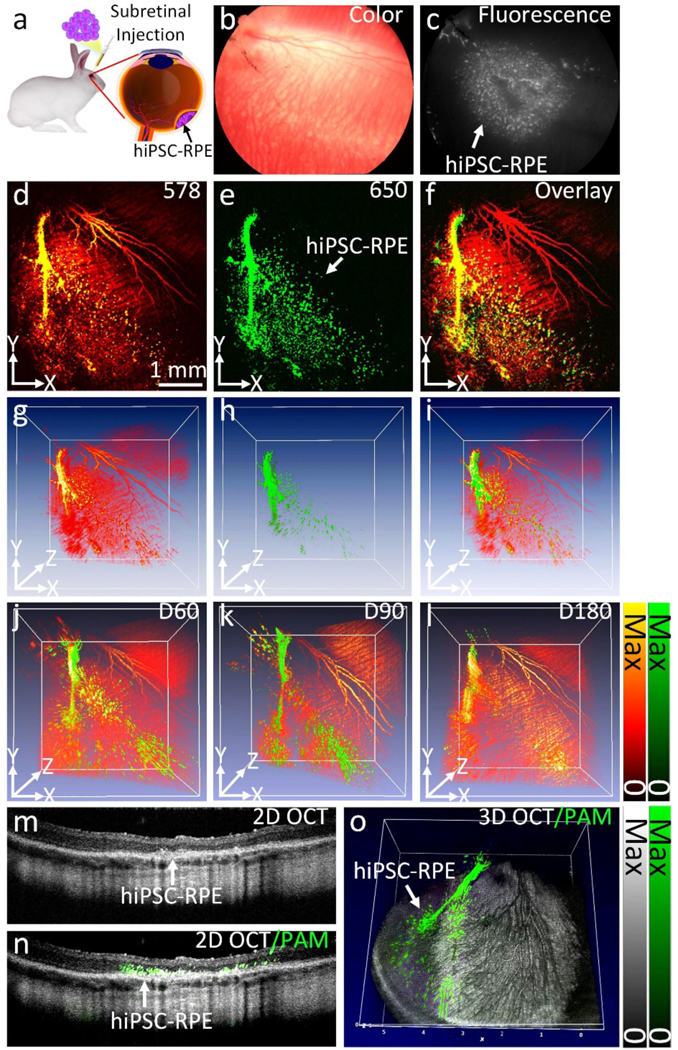
Stem cell therapies are gaining traction as promising treatments for a variety of degenerative conditions. Both clinical and preclinical studies of regenerative medicine are hampered by the lack of technologies that can evaluate the migration and behavior of stem cells post-transplantation. This study proposes an innovative method to longitudinally image in vivo human-induced pluripotent stem cells differentiated to retinal pigment epithelium (hiPSC-RPE) cells by multimodal photoacoustic microscopy, optical coherence tomography, and fluorescence imaging powered by ultraminiature chain-like gold nanoparticle cluster (GNC) nanosensors. The GNC exhibits an optical absorption peak in the near-infrared regime, and the 7-8 nm size in diameter after disassembly enables renal excretion and improved safety as well as biocompatibility. In a clinically relevant rabbit model, GNC-labeled hiPSC-RPE cells migrated to RPE degeneration areas and regenerated damaged tissues. The hiPSC-RPE cells' distribution and migration were noninvasively, longitudinally monitored for 6 months with exceptional sensitivity and spatial resolution. This advanced platform for cellular imaging has the potential to enhance regenerative cell-based therapies.

Keywords: contrast agents; gold nanochains; human-induced pluripotent stem cells differentiated to retinal pigment epithelium; optical coherence tomography; photoacoustic microscopy; regenerative medicine; stem cell therapy.


Conflict of interest statement

Competing interests

The authors declare no competing financial interests.

Figures

Figure 1.
Figure 1.. Physiochemical characterization of the ultraminiature gold nanochains (GNC):
(a) Schematic of ultraminiature gold nanoparticle monomer fabrication using femtosecond pulsed laser ablation and clustering process. (b) Transmission electron microscopy (TEM) images depicting the synthesized GNCs. (c) UV-Vis absorption spectrum of original 5–8 nm gold nanoparticles (GNPs) and the ultraminiature GNC. (d) UV-Vis absorption spectrum of the GNCs internalized within the hiPSC-RPE cells vs cells without being labeled by GNCs. (e) Comparison of hydrodynamic sizes of 7–8 nm GNPs and GNCs. (f) Fourier transformed infrared spectroscopy (FTIR) of different compounds and nanoparticles including Thiolated PEG 2000, PEGylated ultraminiature GNCs and ultraminiature GNCs. (g) Colloidal stability of ultraminiature GNC suspended in physiological conditions over time measured by UV-Vis spectrometer. There is no significant red-shift observed on the absorption spectrum of the sample up to 4 days. (h–i) 2D OCT and PAM images of PBS (control) and hiPSC-RPE cells labeled with GNCs at different cell densities (i.e.,102, 103, 104, 105, 106). (j–k) OCT signal intensity and PA signal amplitudes as functions of cell densities, respectively (n=3, p<0.001). (l–m) Confocal laser microscope images of hiPSC-RPE cells with and without being labeled by the ultraminiature GNCs, respectively. The red fluorescent color indicated the localization of the internalized GNCs within the cells.
Figure 2.
Figure 2.. hiPSC-RPE cell function evaluation after treatment with GNC and laser sequentially:
(a) Morphology and key marker expression of hiPSC-RPE without treatment with ultraminiature GNCs: zonula occludens protein-1 (ZO-1), CD147, EZRIN, and KIR7 by immunostaining. (b) Morphology and key marker expression of hiPSC-RPE after treatment with ultraminiature GNCs. (c) RPE markers expressed in cells treated with laser only. (d) RPE markers expressed in cells exposed to GNCs at a concentration of 100 μg/mL and then subjected to laser irradiation at 20 nJ. (e) Relative protein levels were determined by western blot for 20 nJ laser-treated hiPSC-RPE cells labeled with GNCs compared to untreated controls. Bands were quantified by densitometry and normalized to GAPDH, and values are shown relative to the control group for each protein. N=3, bars show mean ± SEM. Student t tests showed no difference between groups for each protein. Full western blots are shown in Supplementary Fig. S5. (f) Western blot for hiPSC-RPE cells with (GNCs) and without (WT) treatment with ultraminiature GNCs. (g) RPE marker transcript levels. N=3, mean±SEM, analyzed by multiple unpaired t tests, *p<0.05, **p<0.01. (h) TEER with and without treatment with ultraminiature GNC. Weeks= weeks post-passage. N=24, mean±SEM, 2-way ANOVA showed no effect of treatment. (i) Comparison of RPE phagocytosis for cells after different treatments: 7–8 nm GNCs, 20 nm GNCs, GNRs, 7–8 nm GNCs followed by laser irradiation at 80 nJ (laser 4x) and 160 nJ (laser 8x). (j) VEGF secretion, (k) PEDF secretion, (l) APOE secretion, and (m) TIMP3 secretion by cells after different treatments. For (j-l), N=3, bars show mean±SEM. 2-way ANOVA tests showed a significant effect of polarity for all factors, while all except TIMP-3 had a significant effect of treatment as well. Significant results of multiple comparisons are shown with *p<0.05, **p<0.01, ***p<0.001, and ****p<0.0001.
Figure 3.
Figure 3.. hiPSC-RPE cell migration, and RPE replacement assessment:
(a) Color fundus photography obtained in vivo before and after cell transplantation. White dotted circles indicate the regions of RPE injury caused by laser photocoagulation. The black area on the fundus images exhibits the distribution of hiPSC-RPE cells after transplantation. (b) Fluorescent images of hiPSC-RPE cells labeled with ICG-GNC-RGD. (c–d) Location and migration pattern of the transplanted hiPSC-RPE cells were observed by capturing PAM images at 578 nm, enabling visualization of both the morphology of native retinal vessels and the transplanted stem-cell differentiated to RPE (c), and at 650 nm to distinguish the transplanted stem-cell differentiated to RPE from the vasculature (d). Pseudo-green color depicts the migration pattern of the transplanted hiPSC-RPE cells. (e) Combined 3D PAM images at 578 nm and 650 nm. (f) Quantitative normalized PA signal amplitudes were obtained at multiple time points for three different treatment groups: hiPSC-RPE cells labeled with GNCs, unlabeled hiPSC-RPE cells, and dead hiPSC-RPE cells. (g) Quantitative normalized fluorescent intensities were obtained at multiple time points for two different treatment groups: hiPSC-RPE cells labeled with GNCs, and dead hiPSC-RPE cells. Data shows as mean ± SD (n=3).
Figure 4.
Figure 4.. Additional in vivo longitudinal images of stem cells after transplantation:
(a) Color fundus photographs. (b) Fluorescence images. (c) PAM images obtained at 578 nm. (d) PAM images acquired at 650 nm. Pseudo-green color demonstrates the distribution of hiPSC-RPE cells.
Figure 5.
Figure 5.. In vivo multimodal imaging of unlabeled hiPSC-RPE cells:
(a) Color fundus photographs. (b) Fluorescent images. (c) PAM images obtained at 578 nm. (d) PAM images acquired at 650 nm. White arrow demonstrates the distribution of hiPSC-RPE cells.
Figure 6.
Figure 6.. The 3D, 2D cross-sectional OCT, and combined PAM and OCT images of the hiPSC-RPE cells after transplantation:
(a) 2D OCT image of the RPE removal model obtained before stem cell transplantation. The yellow arrow shows the location of the RPE-damaged area. Retinal vessels (RVs), choroidal vessels (CVs), sclera, and RPE were visualized in the untreated areas. (b) 2D OCT image of the retina after stem cell transplantation. Localized subretinal fluid and the distribution of labeled hiPSC-RPE cells (red arrow) were visualized. (c–g) 2D OCT images were acquired at different time points: day 14 (c), day 28 (d), day 60 (e), day 120 (f), and day 180 (g), post-transplantation. Yellow dotted lines indicate the margin of the transplanted hiPSC-RPE cells. Red arrows depict the replacement of hiPSC-RPE cells at the location of the RPE-damaged areas. (h–n) Combined 2D PAM image obtained at 650 nm and 2D OCT image. Pseudo-green color indicates the detected hiPSC-RPE cells located at the subretinal space. (o–q) Combined 3D PAM and OCT images at day 14 (o), day 28 (p), and day 180 (q) post-transplantation. (r) Quantitative measurement of cell migration areas. Data are represented as mean ± SD (n=3)
Figure 7.
Figure 7.. In vivo multimodal imaging of the transplanted hiPSC-RPE cells:
(a) Schematic of subretinal transplantation. (b) Color fundus photo showing major retinal vessels. (c) Fluorescent image of the transplanted hiPSC-RPE cells labeled with ICG-GNC-RGD. The white color indicates the distribution of the transplanted hiPSC-RPE cells. (d–e) 2D PAM images obtained at 578 nm (d) and 650 nm (e), respectively. (f) Combined 2D PAM and OCT image. (g–i) 3D volumetric PAM images. (j–l) Combined 3D PAM and OCT images obtained at different time points: day 60 (j), day 90 (k), and day 180 (l), post-transplantation. The green color shows the migration pattern of the transplanted hiPSC-RPE cells. (m) Selected 2D OCT image. (n) Combined 2D OCT and PAM image. (o) Combined 3D OCT and PAM image.
Figure 8.
Figure 8.. Spectroscopy PAM images obtained at different excitation wavelengths ranging from 500 nm to 710 nm:
(a) Minimal PA signal was observed at 500 nm. Strong absorption of hemoglobin (Hb) occurred from 563 nm to 578 nm (Figure b-d). The morphology of retinal, choroidal vessels, and the transplanted hiPSC-RPE cells were clearly observed. In contrast, the transplanted hiPSC-RPE cells were clearly differentiate from the surrounding microvascular from 610 nm to 710 nm (Figure e-j) where Hb has very low optical absorption in this spectral window. (k) Quantitative PA signal amplitudes of transplanted hiPSC-RPE cells as a function of wavelength.
Figure 9.
Figure 9.. In vivo multimodal imaging of transplanted dead hiPSC-RPE cells:
(a–j) Color fundus photography, fluorescence, PAM images obtained at 578 and 650 nm, 2D OCT and 3D OCT images acquired before and after transplantation at different time points: 1, 3, 7, 14, 21, 28, 60, 90, and 180 days.
Figure 10.
Figure 10.. Histological and immunofluorescent analysis:
(a) H&E staining image of the control group (without cell transplantation). This image shows different layers of the posterior pole of the eye, including the internal limiting membrane (ILM), ganglion cell layer (GCL), inner plexiform layer (IPL), inner nuclear layer (INL), outer plexiform layer (OPL), outer nuclear layer (ONL), photoreceptor layer (PL), choroid layer (CL), RPE, and sclera. (b) H&E image obtained from the tissue received subretinal injection of hiPSC-RPE cells without laser-induced RPE removal model. The transplanted hiPSC-RPE cells formed a single layer post-injection at day 180 (white arrows). (c) H&E image of the ribbit retina post-transplantation of hiPSC-RPE cells and with laser-induced RPE damage. The architecture of the retina was significantly changed at the position of laser injury sites. The transplanted hiPSC-RPE cells replaced damaged RPE (white arrows). (d) Magnification of 2D OCT image showing the margin of hiPSC-RPE cells. (e) 2D PAM image obtained at 650 nm. (f) Registered PAM and H&E images. Green color shows the location of hiPSC-RPE cells which was co-registered with pigmented RPE cells showing on the H&E image. (g–h) Immunofluorescence images were acquired from two different groups: without the laser-induced RPE damage (g) and with the laser-induced RPE damage (h). DAPI-stained nuclei (blue color), NuMA-stained hiPSC-RPE cells (green), and RPE65-stained RPE and hiPSC-RPE cells.

References

    1. Jonas JB; Cheung CMG; Panda-Jonas S, Updates on the epidemiology of age-related macular degeneration. The Asia-Pacific Journal of Ophthalmology 2017, 6 (6), 493–497; - PubMed
    2. Ding X; Patel M; Chan C-C, Molecular pathology of age-related macular degeneration. Prog. Retin. Eye Res. 2009, 28 (1), 1–18. - PMC - PubMed
    1. Gehrs KM; Anderson DH; Johnson LV; Hageman GS, Age-related macular degeneration—emerging pathogenetic and therapeutic concepts. Ann. Med. 2006, 38 (7), 450–471. - PMC - PubMed
    1. DeWan A; Liu M; Hartman S; Zhang SS-M; Liu DT; Zhao C; Tam PO; Chan WM; Lam DS; Snyder M, HTRA1 promoter polymorphism in wet age-related macular degeneration. Science 2006, 314 (5801), 989–992; - PubMed
    2. Stewart MW, Clinical and differential utility of VEGF inhibitors in wet age-related macular degeneration: focus on aflibercept. Clinical ophthalmology 2012, 1175–1186. - PMC - PubMed
    1. Rickman CB; Farsiu S; Toth CA; Klingeborn M, Dry age-related macular degeneration: mechanisms, therapeutic targets, and imaging. Invest. Ophthalmol. Vis. Sci. 2013, 54 (14), ORSF68-ORSF80; - PMC - PubMed
    2. de Guimaraes TAC; Varela MD; Georgiou M; Michaelides M, Treatments for dry age-related macular degeneration: therapeutic avenues, clinical trials and future directions. Br. J. Ophthalmol. 2022, 106 (3), 297–304. - PMC - PubMed
    1. Holz FG; Strauss EC; Schmitz-Valckenberg S; van Lookeren Campagne M, Geographic atrophy: clinical features and potential therapeutic approaches. Ophthalmology 2014, 121 (5), 1079–1091. - PubMed

Publication types

LinkOut - more resources