. 2024 Sep 3;36(9):3362-3377.
doi: 10.1093/plcell/koae159.

Multiomic analyses reveal key sectors of jasmonate-mediated defense responses in rice

Affiliations

Multiomic analyses reveal key sectors of jasmonate-mediated defense responses in rice

Yumeng Chen et al. Plant Cell. .

Abstract

The phytohormone jasmonate (JA) plays a central role in plant defenses against biotic stressors. However, our knowledge of the JA signaling pathway in rice (Oryza sativa) remains incomplete. Here, we integrated multiomic data from three tissues to characterize the functional modules involved in organizing JA-responsive genes. In the core regulatory sector, MYC2 transcription factor transcriptional cascades are conserved in different species but with distinct regulators (e.g. bHLH6 in rice), in which genes are early expressed across all tissues. In the feedback sector, MYC2 also regulates the expression of JA repressor and catabolic genes, providing negative feedback that truncates the duration of JA responses. For example, the MYC2-regulated NAC (NAM, ATAF1/2, and CUC2) transcription factor genes NAC1, NAC3, and NAC4 encode proteins that repress JA signaling and herbivore resistance. In the tissue-specific sector, many late-expressed genes are associated with the biosynthesis of specialized metabolites that mediate particular defensive functions. For example, the terpene synthase gene TPS35 is specifically induced in the leaf sheath and TPS35 functions in defense against oviposition by brown planthoppers and the attraction of this herbivore's natural enemies. Thus, by characterizing core, tissue-specific, and feedback sectors of JA-elicited defense responses, this work provides a valuable resource for future discoveries of key JA components in this important crop.


Conflict of interest statement

Conflict of interest statement. None declared.

Figures

Figure 1.
Figure 1.
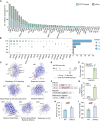
The spatial and temporal expression of JA-responsive genes. A) Schematic diagram of the sample preparation and sampling. Rice seedlings were MeJA-treated by transferring plants to the hydroponic solution containing 100 μm MeJA and harvested at five time points (0.5, 1, 3, 8, and 24 h). Treatments with the solvent solution treatments at each of these time points served as controls. Three biological replicates at each time point were used for RNA-seq analysis. L, leaf; LS, leaf sheath; R, root. B) PCA of RNA-seq data on control and MeJA-treated samples. C to E) The DEGs in MeJA-treated plants compared with control plants, with absolute |FC| > 2 and FDR value < 0.05 as cutoffs. The y-axis bar charts depict the total numbers of up- and downregulated DEGs at each time point. Heatmaps show the number of DEGs’ overlap, based on time points and directions of differential regulation. The order of rows and columns in heatmaps are the same. The gradients reflect the number of DEGs’ overlap, with actual values provided in the heatmaps. ×1,000, multiplied by 1,000. F) An UpSet diagram showing the number of upregulated DEGs in different tissues (bottom left) and the seven (bottom right) interactions by size (top). Gene with FC > 2, FDR value < 0.05 at least at one time point and FC > −2 across all five time points was defined as upregulated DEG. G to J) GO analysis of the four largest gene sets in Fig. 1F by ClueGO. GO terms (P < 0.05) with similar biological functions were grouped and the most significant term in each group was shown. The percentage of each functional group corresponds with the number of terms included in the group.
Figure 2.
Figure 2.
MYC2 targeted genes. A) Volcano plot showing MYC2 high-confidence binding sites. The cutoff was set with FC > 1 and FDR ≤ 0.05. B) The top-ranked motif in MYC2 ChIP-seq data. Motifs were determined by STREME. C) Integrative Genomics Viewer (IGV) screenshot visualizing the binding of MYC2 to three JAZ genes. The red and pink triangles represent G-box and G-box-like motifs, respectively. D) UpSet diagram showing the composition of MYC2 target genes. Bottom left, the number of MYC2 target genes in different tissues; right, the 15 interactions by size. These interactions were divided into three categories: MeJA upregulated genes, MeJA downregulated genes, and MeJA not induced genes (NI). L, leaf; LS, leaf sheath; R, root. Arrows indicate the trend of gene expression. E to G) GO analysis of three categories in (D) by ClueGO. GO terms (P < 0.05) with similar biological functions were grouped and the most significant term in each group was shown. The percentage of each functional group corresponds with the number of terms included in the group.
Figure 3.
Figure 3.
The core sector of JA-mediated defense responses. A) The proportion of TFs upregulated by MeJA that are targeted by MYC2. B) The spatial expression pattern of core TFs (targeted by MYC2 and upregulated by MeJA treatment in all three tissues) in the leaf sheath. The bar plot on the right shows the total number of expressed core TFs at each time point. C) Defense-related modules from the co-expression network. Edges connecting two genes represent the weight (transformed MR score) for the association. Only edges with weight > 0.5 were remained. The yellow nodes represent core TFs; the gray nodes represent other genes in the module. The cutoff of the module is P < 0.15. Enriched GO terms of genes in each module are shown below the network. D) Schematics of the bHLH6 promoter. The triangles represent G-box or G-box-like motifs and the numbers above represent putative types (see details in Supplementary Data Set 7). The zones below indicate fragments amplified in ChIP assays. E) Mean enrichment (±Se, n = 3) of bHLH6 chromatin fragments in Flag-MYC2 precipitated samples compared to Flag-GFP precipitated ones. The enrichment of fragment P1 was normalized with the rice ubiquitin gene. The relative enrichment of P1 in Flag-GFP precipitated sample was set as “1”. F) Constructs of effectors and reporters used for transcriptional activation assays in rice protoplasts. LUC, firefly luciferase; REN, Renilla luciferase. Ubi, ubiquitin promoter. G) Transcriptional regulation of bHLH6 gene by MYC2. The indicated effector, reporter, and reference reporter (Ubi-REN) were co-transformed into rice protoplast cells. Mean LUC/REN ratio (±Se, n = 5) of transformed cells was measured 12 h after incubation. Asterisks indicate significant differences between different effectors (**P < 0.01; Student's t-test). H) Mean hatching rate (±Se, n = 11) of BPH eggs on bhlh6-2 mutants and WT plants. I) Mean number (±Se, n = 18 to 19) of eggs laid by a BPH female adult on bhlh6-2 mutants and WT plants. Asterisks indicate significant differences between different plants (*P < 0.05; **P < 0.01; Student's t-test).
Figure 4.
Figure 4.
Tissue-specific sectors of JA-elicited metabolites. A) PCA of metabolomics data of control and MeJA-treated plants. Rice seedlings were treated with 100 μm MeJA for 48 h in hydroponic media; the solvent solution treatment was used as a control. Eight biological replicates were used for untargeted metabolomics analysis. L, leaf; LS, leaf sheath; R, root. B) UpSet diagram showing the number of upregulated metabolites in different tissues (bottom left) and the seven interactions (bottom right) by size (top). The cutoff of DAMs was FC > 2 and FDR value < 0.05. C) Heatmap represents the transcript levels of TPS genes in MeJA-treated samples compared with control samples. The gradient represents the relative sequence abundance; numbers in the key indicate log2FC. Genes were divided into three classes by different labeling. Asterisks indicate significant differences between treatments (*, FDR < 0.05; Student's t-test). D) Feeding and ovipositing preference of BPH female adults on tps35 mutants and WT plants. Mean number of female BPH adults per plant (±Se, n = 15) on pairs of tps35 mutant and WT plant. Insert: mean percentage (±Se, n = 15) of BPH eggs per plant on pairs of tps35 mutant and WT plant 48 h after the release of BPH. Asterisks indicate significant differences between mutants and WT plants (*P < 0.05; Student's t-test). E) The preference of egg-parasitoid wasps (A. nilaparvatae) to tps35 mutants and WT plants using a Y-tube olfactometer. Plants were exposed to 15 gravid BPH female adults for 24 h before the choice assays. Each odor source contained five BPH-treated plants. A total of 60 female wasps were used for the choice assay. A likelihood ratio chi-square test was used for data analysis.
Figure 5.
Figure 5.
The negative feedback sector of JA-mediated defense responses. A) Schematic of the NAC1, NAC3, and NAC4 promoters. The triangles represent G-box or G-box-like motifs and the numbers above represent putative types (see details in Supplementary Data Set 7). The zones below indicate fragments amplified in ChIP assays. B) Mean enrichment (±Se, n = 4) of NAC1, NAC3, and NAC4 chromatin fragments in Flag-MYC2 precipitated samples compared to Flag-GFP precipitated ones. A ubiquitin fragment was amplified as the negative control. The enrichment of each fragment was normalized with the rice Actin gene. The relative enrichment of each fragment in Flag-GFP precipitated sample was set as “1”. C) Transcriptional regulation of NAC1, NAC3, and NAC4 genes by MYC2. The indicated effector, reporter and reference reporter (Ubi-REN) were co-transformed into rice protoplast cells. Mean LUC/REN ratio (±Se, n = 5) of transformed cells was measured 12 h after incubation. Asterisks indicate significant differences between different effectors (**P < 0.01; Student's t-test). D) Mean transcript abundance (±Se, n = 6) of JAZ8, JAZ11, and NOMT in nac1,3,4 mutants and WT plants. Asterisks indicate significant differences between different plants (**P < 0.01; Student's t-test). E) Mean hatching rate and hatching duration (±Se, n = 15) of BPH eggs on nac1,3,4 mutants and WT plants. Asterisks indicate significant differences between different plants (*P < 0.05; **P < 0.01; Student's t-test). F) Heatmap represents the transcript levels of JA repressors and JA catabolic genes in MeJA-treated samples compared with control samples. The gradient represents the relative sequence abundance; numbers in the key indicate log2FC. Genes were divided into three classes by different labeling. JOX, jasmonate-induced oxygenase; AH, amidohydrolase.

Similar articles

Cited by

References

    1. Bai Y, Yang C, Halitschke R, Paetz C, Kessler D, Burkard K, Gaquerel E, Baldwin IT, Li D. Natural history-guided omics reveals plant defensive chemistry against leafhopper pests. Science. 2022:375(6580):eabm2948. 10.1126/science.abm2948 - DOI - PubMed
    1. Bindea G, Mlecnik B, Hackl H, Charoentong P, Tosolini M, Kirilovsky A, Fridman WH, Pagès F, Trajanoski Z, Galon J. ClueGO: a cytoscape plug-in to decipher functionally grouped gene ontology and pathway annotation networks. Bioinformatics. 2009:25(8):1091–1093. 10.1093/bioinformatics/btp101 - DOI - PMC - PubMed
    1. Boter M, Ruíz-Rivero O, Abdeen A, Prat S. Conserved MYC transcription factors play a key role in jasmonate signaling both in tomato and Arabidopsis. Gene Dev. 2004:18(13):1577–1591. 10.1101/gad.297704 - DOI - PMC - PubMed
    1. Cao W, Chu R, Zhang Y, Luo J, Su Y, Xie L, Zhang H, Wang J, Bao Y. OsJAMyb, a R2R3-type MYB transcription factor, enhanced blast resistance in transgenic rice. Physiol Mol Plant Pathol. 2015:92:154–160. 10.1016/j.pmpp.2015.04.008 - DOI
    1. Chambers MC, Maclean B, Burke R, Amodei D, Ruderman DL, Neumann S, Gatto L, Fischer B, Pratt B, Egertson J, et al. . A cross-platform toolkit for mass spectrometry and proteomics. Nat Biotechnol. 2012:30(10):918–920. 10.1038/nbt.2377 - DOI - PMC - PubMed

MeSH terms

LinkOut - more resources