. 2024 May 27;15(1):4503.
doi: 10.1038/s41467-024-48757-5.

Glioblastoma disrupts cortical network activity at multiple spatial and temporal scales

Affiliations

Glioblastoma disrupts cortical network activity at multiple spatial and temporal scales

Jochen Meyer et al. Nat Commun. .

Abstract

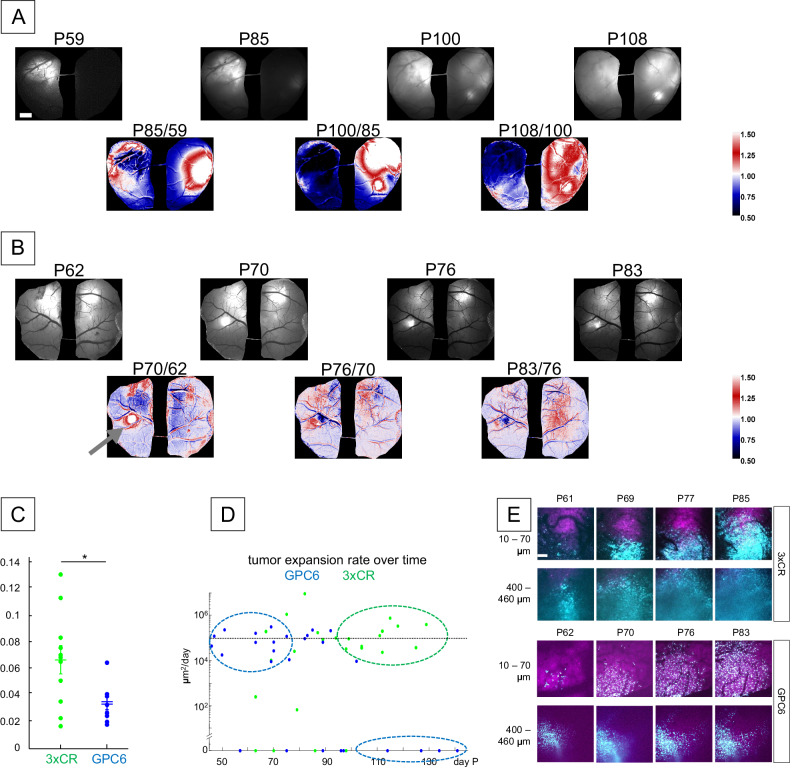
The emergence of glioblastoma in cortical tissue initiates early and persistent neural hyperexcitability with signs ranging from mild cognitive impairment to convulsive seizures. The influence of peritumoral synaptic density, expansion dynamics, and spatial contours of excess glutamate upon higher order neuronal network modularity is unknown. We combined cellular and widefield imaging of calcium and glutamate fluorescent reporters in two glioblastoma mouse models with distinct synaptic microenvironments and infiltration profiles. Functional metrics of neural ensembles are dysregulated during tumor invasion depending on the stage of malignant progression and tumor cell proximity. Neural activity is differentially modulated during periods of accelerated and inhibited tumor expansion. Abnormal glutamate accumulation precedes and outpaces the spatial extent of baseline neuronal calcium signaling, indicating these processes are uncoupled in tumor cortex. Distinctive excitability homeostasis patterns and functional connectivity of local and remote neuronal populations support the promise of precision genetic diagnosis and management of this devastating brain disease.


Conflict of interest statement

The authors declare no competing interests.

Figures

Fig. 1
Fig. 1. Integration of an IUE murine GBM model with multimodal recordings of cellular, widefield fluorescence, and behavioral parameters.
A Schematic illustration of experimental design. IUEs are performed on E14.5 mouse embryos. At 1 month of age, AAV viruses are injected intracortically. After 2 weeks, a bilateral ~7 × 5 mm cranial window and two-channel EEG electrodes were installed on the mouse’s cranium. B Schematic illustration of multimodal monitoring of the animal’s behavioral state: Running wheel velocity, pupil and eye movements, and whisking/frontal body movements were recorded. An LCD monitor was used to display visual stimuli. C Time series raster plot of representative two-photon imaging recording showing baseline (red dotted box), seizure, and postictal activity (black dotted box). Traces show ΔF/F calcium activity, EEG voltage, and mouse behavior illustrated in (B). Scale = 10 s. Violin plots display distributions of deconvolved activity metrics extracted from 150 s of the baseline (red dashed rectangle), and 150 s of postictal (purple dashed rectangle) periods. White triangles = median. Statistical significance between pre- and postictal periods was computed using the Wilcoxon rank-sum test, n = 432 neurons. Not significant for mean DF. Preictal and postictal clusters shown to the right were computed from the same recordings. Neurons belonging to the same cluster share the same color. Scale = 0.1 mm. D Long-term optical stability of cranial windows: widefield (top) and 2p (bottom) images from the same animal at P62 and P127. Scale (top) = 1 mm, scale (bottom) = 0.1 mm. E Examples of dual-indicator widefield images of different tumor fluorescence and activity indicators over time. Top row: thy1-GCaMP6s line and tumor pseudocolored in magenta and cyan, respectively. Bottom row: iGluSnfr and tumor pseudocolored in yellow and cyan, respectively. Scale = 1 mm.
Fig. 2
Fig. 2. GPC6 is enriched in human and murine GBM.
A GPC6 expression based on transcript count per million (TPM, log scale) from human datasets comparing low-grade glioma (LGG), glioblastoma (GBM), to normal non-tumor brain. Source data from Gepia (PMID: 28407145) using TCGA normal and GTEx data for LGG and GBM datasets. Asterisk signifies p values <0.01 (one-way ANOVA). B Kaplan–Meier survival analysis of human patient cohorts of LGG and GBM patients. Low and high TPM cutoff were set at below and above the 50th percentile, respectively. HR hazard ratio. C Immunohistological staining for GPC6 on human GBM tissue (below) along with normal brain control (above). Scale bar = 100 µm. Representative image of six different human GBM samples. D Kaplan–Meier survival analysis comparing 3xCR (black) and GPC6 (red) tumor-bearing mice. p value calculated through Wilcoxon signed-rank test. E Representative immunohistofluorescence of BrdU incorporation (red) in tumor sections (green). Quantification of BrdU+ cells per field (100,000 µm2) p values calculated by one-tail student t-test, p = 3.7e-6. *** <0.001. N(biological) = 4 brains. N(technical) = 6 images per brain. F. Heatmap of differentially expressed genes between 3xCR and GPC6 tumors brains. Each column represents a single brain. The first three columns are 3xCR tumors. The last four columns are GPC6 tumors. Yellow—high expression. Blue—low expression. G Representative images from immunohistofluorescence images of PSD95 (green) and vGlut1 (red) staining around tumor margins (cyan). Quantifications of colocalization of Psd95 and vGlut1. p value calculated by one-tail student t-test, p = 0.0045. ** <0.01. White scale bar = 300 µm; yellow scale bar = 20 µm; gray scale bar = 5 µm. N(biological) ≥ 3 brains. N(technical) = 6 images per brain. H Representative images from immunohistofluorescence images of Gephyrin (green) and Vgat (red) staining around tumor margins (cyan). Quantifications of colocalization of Gephyrin and Vgat. p value calculated by one-tail student t-test. No significant difference. White scale bar = 300 µm; yellow scale bar = 20 µm; gray scale bar = 5 µm. N(biological) = 3 brains. N(technical) = 4 images per brain. Source data are provided as a Source Data file for E, FG, H. All box-whisker plots (A, E, G, H) center on the median; the bounds of the boxes mark the upper and lower quartile; the whiskers extend to the upper and lower extremes (1.5x interquartile range from the upper and lower quartiles).
Fig. 3
Fig. 3. GPC6 favors less rapid infiltration and earlier cortical tumor expansion.
A Top row: representative mesoscopic images of tumor labeled fluorescence over time of a 3xCR tumor brain. Mouse age in postnatal days listed above image. Bottom row: colored panels, generated from above monochrome intensity, colored based on changes to signal strength at a location between two time points. B Analogous analysis to (A) for a GPC6 tumor animal. C Quantification of tumor images from 11 3xCR and 8 GPC6 comparing 90th percentile data point of CV/day. Mean 3xCR = 0.065 ± 0.011 sem. Mean GPC6 = 0.031 ± 0.005 sem, p = 0.033, two-tailed Wilcoxon rank-sum test. Asterisk denotes P < 0.05. D Mapping local tumor expansion rate by age in days. Expansion rates were calculated by changes in tumor fluorescence area over time (µm2/day). Blue and green dotted circles are designated to highlight relatively early expansion burst of GPC6 tumors, while 3xCR tumor expansion persists later in survival. E Representative images from two-photon imaging at different depths of tumor cells (cyan) and neurons (magenta). Visualized depth labeled on the left. Age at visualization labeled above images. Source data are provided as a Source Data file.
Fig. 4
Fig. 4. Abnormal glutamate accumulation outpaces spatial extent and temporal increase in baseline neuronal calcium activity in 3xCR tumor cortex.
GPC6 baseline calcium signal is elevated at early time points (A Top: Black/white panels show calcium fluorescence of the widefield FOV in a 3xCR tumor cortex at seven time points between P56 and P98; equal brightness scale in each image. Bottom: Colored panels show the rate of change in tumor fluorescence at weekly intervals, generated by dividing two B/W images from consecutive time points, normalizing by the number of days between those sessions and by the mean of the resulting image, applying a color map (imageJ, “union jack”) and setting the scale limits to [0.5 1.5]. B Analogous to (A), B/W panels show the evolution of baseline glutamate fluorescence intensity in a different 3xCR tumor animal between P59 and P93 with equal brightness scaling. Note the distinct nonlinear, progressive changes in signal intensity not seen in the calcium-reporter mouse (A). Colored panels were constructed and scaled as in (A). C Analogous to (A), B/W panels show calcium baseline signal snapshots from a GPC6 tumor animal between P47 and P88, as well as the CV/day fluorescence change between time points. D To capture the dynamical changes in fluorescence between time points, we computed the coefficient of variation (CV = SD/mean), normalized by the number of days between recordings. To account for potential sampling bias/undersampling, we extrapolated a 90th percentile data point for each animal. Data were shown from ten 3xCR calcium-reporter mice and five 3xCR glutamate-reporter mice. Glutamate CV/day reached 64% higher values than calcium across all time points (mean 0.134 ± 0.046 sem vs. 0.048 ± 0.0055 sem, p = 0.008, two-tailed Wilcoxon rank-sum test). E Comparison of calcium baseline fluorescence between <P70 and >P70 time periods in 3xCR (data from ten animals) vs. GPC6 (data from five animals) tumors: GPC6 calcium baseline (<P70) was higher than 3xCR (<P70), and both GPC6 and 3xCR at P > 70: mean GPC6 calcium <P70/ > P70: 0.1 ± 0.008 sem/0.047 ± 0.006 sem, mean 3xCR calcium <P70/>P70: 0.038 ± 0.007 sem/0.045 ± 0.013 sem; comparison <P70 3xCR vs GPC6: p = 0.0064; comparison GPC6 < P70 vs >P70: p = 0.04, KW/mc test). Source data are provided as a Source Data file. In D, E, single asterisk denotes P < 0.05 and double asterisk denotes P < 0.01.
Fig. 5
Fig. 5. Mesoscopic neural activity patterns are significantly lower with GPC6 overexpression when the local tumor expansion rate is below 105 µm2/day; Neural activity patterns drop off faster with distance from 3xCR tumors when proliferation rates are high than when they are low; GPC6 tumors generally do not induce this effect.
A Left: Example of 3xCR whole-FOVs values for two time points corresponding to slow (3.3 × 104 µm2/day, left) and fast (2 × 105 µm2/day) tumor expansion rate (right). Top panels: tumor (cyan) and calcium (magenta) FOV of the same animal at different time points. Horizontal scale = 1 mm. Bottom: representative filtered and denoised ongoing calcium traces, one row per pixel (after spatial downsampling, 520 pixels total, color scale: 0 to 3 × 10−3 ΔF/F).). Scale = 50 s. Right: As in A (left), the top panels show tumor (cyan) and calcium (magenta) fluorescence, and the bottom panels spontaneous ΔF/F calcium activity of a GPC6 tumor animal from representative recordings at a slow tumor expansion stage (left), and a fast expansion stage (right). B Comparative bar plots for four activity metrics (ΔF/min, events/sec, amplitude, duration), including pooled data from five 3xCR animals (24 recordings during slow expansion, 18 recordings during fast expansion) and five GPC6 animals (20 recordings during slow tumor growth, 13 recordings during fast expansion); blue bars = slow expansion recordings, red bars = fast expansion recordings. Error bars = standard error of the mean. Star denotes a significant difference between fast and slow expansion conditions, n.s. not significant. C Left: Example of a 3xCR tumor recording analyzed by distance from the tumor edge over time. Top left panel: The distance from the tumor edge was computed. Distance bands are color-coded in 0.75 mm increments. Bottom left: Mean ΔF/F traces: 30-s period of mean quiet spontaneous activity corresponding to the adjacent distance-band color scale. Scatter plots to the right: ratios between distance bands <0.75 mm from the tumor edge versus >3 mm, averaged over all pixels inside the respective distance bands, as a function of expansion rate. One distinct recording per data point. Y-axes are at a logarithmic scale to visualize ratios symmetrically around the 100 point (ratio of 1, dashed gray line). Right: data from a GPC6 tumor animal, analogous to the 3xCR example. D Results from five 3xCR (27 recordings during slow tumor expansion, 14 recordings during fast expansion) and five GPC6 animals (24 recordings during slow expansion, seven recordings during fast expansion). As in C, values above the 100 line represent instances of metrics higher near the tumor edge than far away, and below vice versa. Error bars = standard error of the mean. Significantly different comparisons are only shown between periods of fast and slow expansion within tumor genotypes and within fast or slow conditions across genotypes. Source data are provided as a Source Data file. In B, D, the single asterisk denotes P < 0.05 and the double asterisk denotes P < 0.01.
Fig. 6
Fig. 6. 3xCR and GPC6 alter neuronal activity inside and outside the tumor margins in distinct ways.
A Comparison of calcium activity inside tumor margins (top two panels) vs outside (bottom two panels), for 3xCR tumors (left) and GPC6 tumors (right). Each panel consists of a raster plot of deconvolved calcium activity (one row per neuron), 2-ch EEG (vertical scale = 200 µV), and an insert showing the FOV with clustered neurons in matching colors and line connecting pairs of neurons within the clusters (line width proportional to connection strength). The “3xCR inside” and “GPC6 outside” recordings were acquired in spiral scan mode, whereas the “3xCR outside” and “GPC6 inside” FOV’s were imaged under resonant scan. Horizontal scale = 1 s. B Schematic visualization of meaningful comparisons highlighted in this figure between 3xCR intramarginal vs extramarginal FOVs, between GPC6 intra- and extramarginal FOVs, and across genotypes within intra- or extramarginal locations. Significant differences between these groups are marked with horizontal bars in (C). The brain section pictograms indicate tumor type (3xCR=green, GPC6 = blue), time bins, and imaging locations. Created with BioRender.com C Comparison of activity metrics between neurons inside and outside the tumor margin derived from five 3xCR and six GPC6 tumor animals. Only significant changes for mean deconvolved ΔF/F, mean events/sec, mean event amplitude, and mean clustering coefficients are highlighted by horizontal lines above the bar (mean and individual data points, 150 data points per group, each point corresponding to one neuron) graphs. We do not show the duration metric as this information is contained in, and can be inferred from, the combination of dΔF/F, event rate, and amplitude. The clustering coefficient and dΔF/F data points are plotted on a logarithmic y-axis to account for the high variability in measured values. Single asterisk denotes P < 0.05, double asterisk denotes P < 0.01. D Example of GPC6 FOV’s inside and outside the tumor margin (top), analogous for Cr86 tumors (bottom). Tumor cells = cyan, neurons = magenta. Scale bar = 100 µm. Source data are provided as a Source Data file.
Fig. 7
Fig. 7. Distinct temporal dynamics of 3xCR and GPC6-induced changes in neuronal activity patterns located 1–2 mm beyond the tumor margin.
A Example plots of dΔF/F, EEG, and clustering for early (P41–49, mid (P49–56 and late (P68–129) time bins, analogous to Fig. 6A: dΔF/F, EEG’s (vertical scale = 200 μV, horizontal scale = 1 s), and FOV insert with neuronal clusters (white scale bar = 100 μm. “3xCR early”, “GPC6 mid”, and “GPC6 late” examples were acquired in spiral scan mode, the rest in resonant scan mode. B Left: schematic of comparisons between the two tumor genotypes and three time periods presented in this figure, analogous to Fig. 6B. Created with BioRender.com Right: Comparison of activity metrics across three time bins for both tumor genotypes: Analogous to Fig. 6, bar plots show mean neuronal deconvolved dΔF/F activity, mean event rates, mean calcium transient amplitudes, and clustering coefficients across time points and tumor genotypes. Individual data points correspond to single neurons (200 per group). Data were derived from seven 3xCR and six GPC6 tumor animals. Single asterisk denotes P < 0.05, double asterisk denotes P < 0.01. Source data are provided as a Source Data file.

Similar articles

Cited by

References

    1. Cucchiara F, Pasqualetti F, Giorgi FS, Danesi R, Bocci G. Epileptogenesis and oncogenesis: an antineoplastic role for antiepileptic drugs in brain tumours? Pharmacol. Res. 2020;156:104786. doi: 10.1016/j.phrs.2020.104786. - DOI - PubMed
    1. Samudra N, Zacharias T, Plitt A, Lega B, Pan E. Seizures in glioma patients: an overview of incidence, etiology, and therapies. J. Neurol. Sci. 2019;404:80–85. doi: 10.1016/j.jns.2019.07.026. - DOI - PubMed
    1. Vecht CJ, Kerkhof M, Duran-Pena A. Seizure prognosis in brain tumors: new insights and evidence-based management. Oncologist. 2014;19:751–759. doi: 10.1634/theoncologist.2014-0060. - DOI - PMC - PubMed
    1. Lin C-CJ, et al. Identification of diverse astrocyte populations and their malignant analogs. Nat. Neurosci. 2017;20:396–405. doi: 10.1038/nn.4493. - DOI - PMC - PubMed
    1. Bikfalvi A, et al. Challenges in glioblastoma research: focus on the tumor microenvironment. Trends Cancer. 2023;9:9–27. doi: 10.1016/j.trecan.2022.09.005. - DOI - PubMed

MeSH terms