

A novel combinatorial approach using sulforaphane- and withaferin A-rich extracts for prevention of estrogen receptor-negative breast cancer through epigenetic and gut microbial mechanisms
- PMID: 38802425
- PMCID: PMC11130158
- DOI: 10.1038/s41598-024-62084-1
A novel combinatorial approach using sulforaphane- and withaferin A-rich extracts for prevention of estrogen receptor-negative breast cancer through epigenetic and gut microbial mechanisms
Abstract
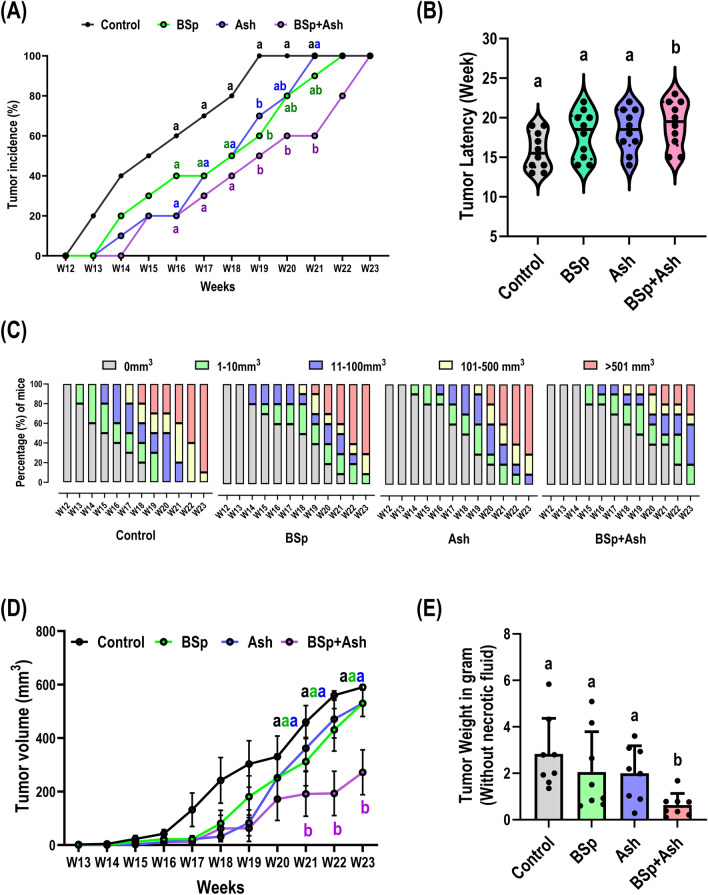
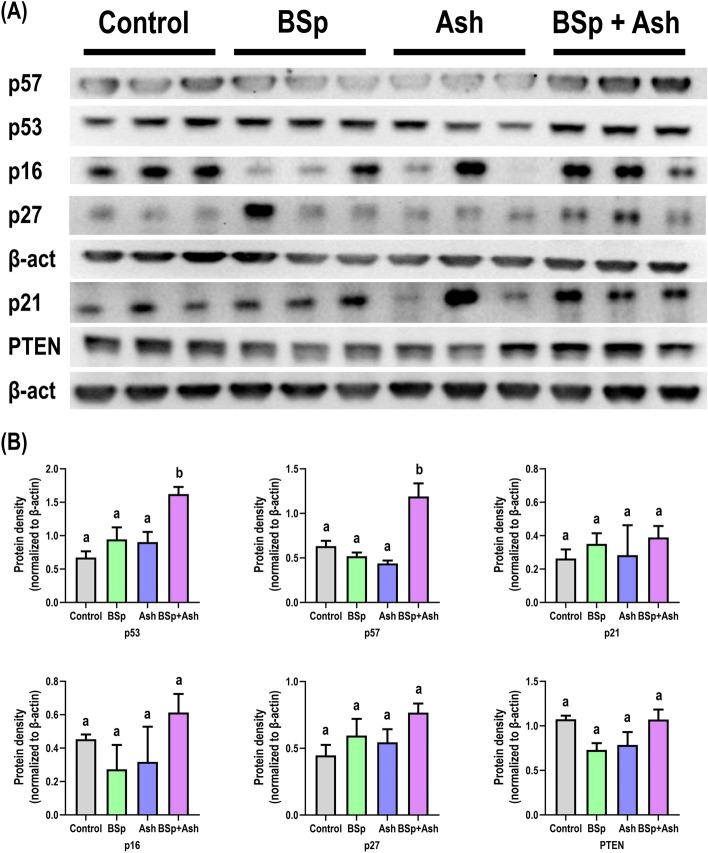
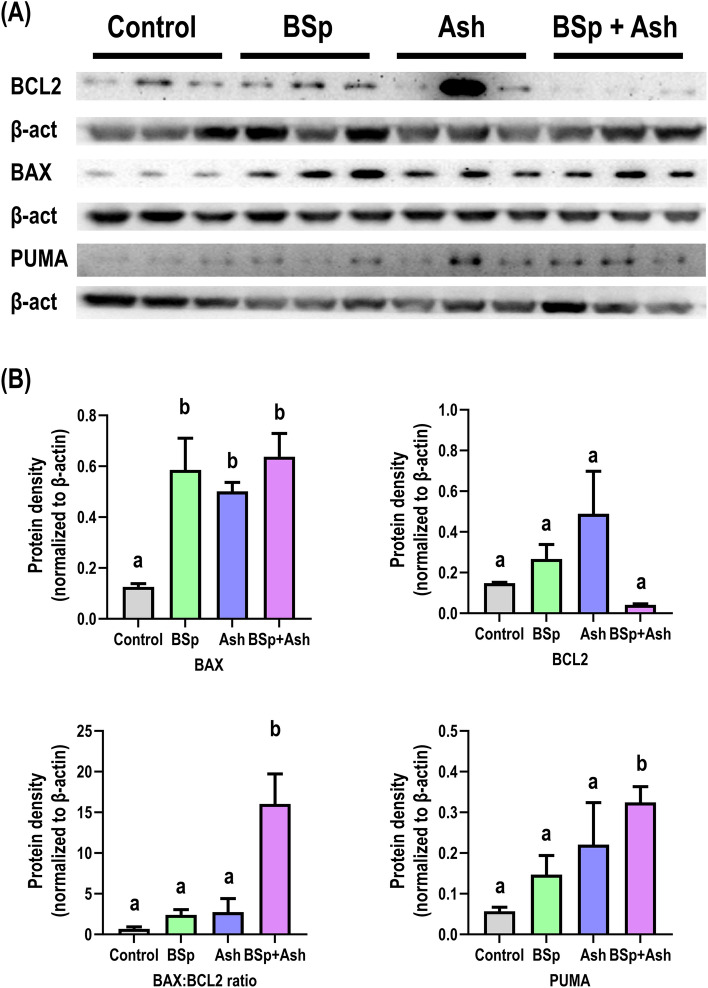
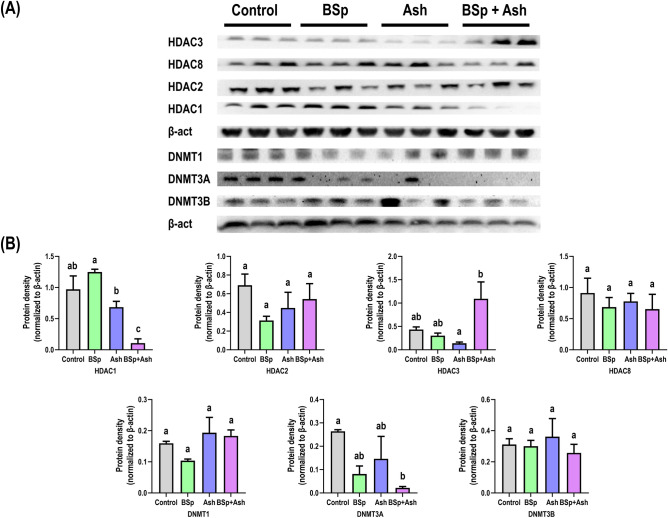
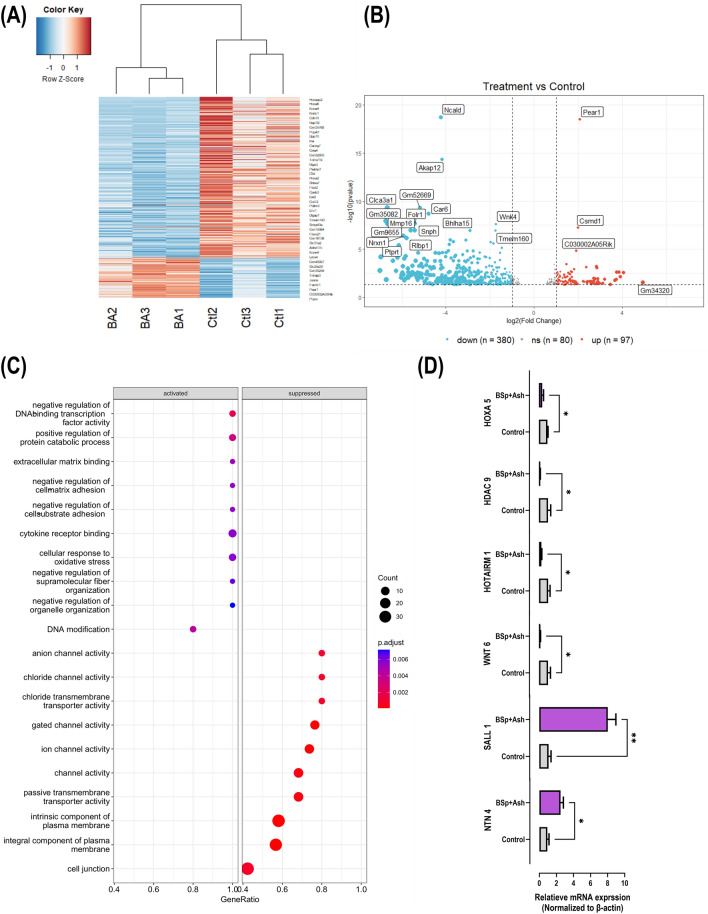
Estrogen receptor-negative [ER(-)] mammary cancer is the most aggressive type of breast cancer (BC) with higher rate of metastasis and recurrence. In recent years, dietary prevention of BC with epigenetically active phytochemicals has received increased attention due to its feasibility, effectiveness, and ease of implementation. In this regard, combinatorial phytochemical intervention enables more efficacious BC inhibition by simultaneously targeting multiple tumorigenic pathways. We, therefore, focused on investigation of the effect of sulforaphane (SFN)-rich broccoli sprouts (BSp) and withaferin A (WA)-rich Ashwagandha (Ash) combination on BC prevention in estrogen receptor-negative [ER(-)] mammary cancer using transgenic mice. Our results indicated that combinatorial BSp + Ash treatment significantly reduced tumor incidence and tumor growth (~ 75%) as well as delayed (~ 21%) tumor latency when compared to the control treatment and combinatorial BSp + Ash treatment was statistically more effective in suppressing BC compared to single BSp or Ash intervention. At the molecular level, the BSp and Ash combination upregulated tumor suppressors (p53, p57) along with apoptosis associated proteins (BAX, PUMA) and BAX:BCL-2 ratio. Furthermore, our result indicated an expressional decline of epigenetic machinery HDAC1 and DNMT3A in mammary tumor tissue because of combinatorial treatment. Interestingly, we have reported multiple synergistic interactions between BSp and Ash that have impacted both tumor phenotype and molecular expression due to combinatorial BSp and Ash treatment. Our RNA-seq analysis results also demonstrated a transcriptome-wide expressional reshuffling of genes associated with multiple cell-signaling pathways, transcription factor activity and epigenetic regulations due to combined BSp and Ash administration. In addition, we discovered an alteration of gut microbial composition change because of combinatorial treatment. Overall, combinatorial BSp and Ash supplementation can prevent ER(-) BC through enhanced tumor suppression, apoptosis induction and transcriptome-wide reshuffling of gene expression possibly influencing multiple cell signaling pathways, epigenetic regulation and reshaping gut microbiota.
© 2024. The Author(s).
Conflict of interest statement
The authors declare no competing interests.
Figures

Similar articles
-
Combined Phytochemical Sulforaphane and Dietary Fiber Inulin Contribute to the Prevention of ER-Negative Breast Cancer via PI3K/AKT/MTOR Pathway and Modulating Gut Microbial Composition.Nutrients. 2025 Jun 17;17(12):2023. doi: 10.3390/nu17122023. Nutrients. 2025. PMID: 40573134 Free PMC article.
-
Maternal Epigenetic Regulation Contributes to Prevention of Estrogen Receptor-negative Mammary Cancer with Broccoli Sprout Consumption.Cancer Prev Res (Phila). 2020 May;13(5):449-462. doi: 10.1158/1940-6207.CAPR-19-0491. Epub 2020 Mar 17. Cancer Prev Res (Phila). 2020. PMID: 32184225 Free PMC article.
-
Paternal Combined Botanicals Contribute to the Prevention of Estrogen Receptor-Negative Mammary Cancer in Transgenic Mice.J Nutr. 2023 Jul;153(7):1959-1973. doi: 10.1016/j.tjnut.2023.05.001. Epub 2023 May 3. J Nutr. 2023. PMID: 37146973 Free PMC article. Clinical Trial.
-
Epigenetic impact of dietary isothiocyanates in cancer chemoprevention.Curr Opin Clin Nutr Metab Care. 2013 Jul;16(4):405-10. doi: 10.1097/MCO.0b013e328362014e. Curr Opin Clin Nutr Metab Care. 2013. PMID: 23657153 Review.
-
Epigenetic regulation of estrogen signaling in breast cancer.Epigenetics. 2013 Mar;8(3):237-45. doi: 10.4161/epi.23790. Epub 2013 Jan 30. Epigenetics. 2013. PMID: 23364277 Free PMC article. Review.
Cited by
-
The interaction network between intestinal flora and cell death in microecosystem of pan-cancers.Int J Med Sci. 2025 May 16;22(11):2596-2608. doi: 10.7150/ijms.111723. eCollection 2025. Int J Med Sci. 2025. PMID: 40520902 Free PMC article. Review.
-
Intermediate Filaments in Breast Cancer Progression, and Potential Biomarker for Cancer Therapy: A Narrative Review.Breast Cancer (Dove Med Press). 2024 Oct 14;16:689-704. doi: 10.2147/BCTT.S489953. eCollection 2024. Breast Cancer (Dove Med Press). 2024. PMID: 39430570 Free PMC article. Review.
-
Ashwagandha-Induced Programmed Cell Death in the Treatment of Breast Cancer.Curr Issues Mol Biol. 2024 Jul 18;46(7):7668-7685. doi: 10.3390/cimb46070454. Curr Issues Mol Biol. 2024. PMID: 39057095 Free PMC article. Review.
-
Modulating the p53-MDM2 pathway: the therapeutic potential of natural compounds in cancer treatment.EXCLI J. 2024 Nov 22;23:1397-1439. doi: 10.17179/excli2024-7791. eCollection 2024. EXCLI J. 2024. PMID: 39764218 Free PMC article. Review.
-
Polyphenols as Immunomodulators and Epigenetic Modulators: An Analysis of Their Role in the Treatment and Prevention of Breast Cancer.Nutrients. 2024 Nov 29;16(23):4143. doi: 10.3390/nu16234143. Nutrients. 2024. PMID: 39683540 Free PMC article. Review.
References
MeSH terms
Substances
Grants and funding
LinkOut - more resources
Full Text Sources
Medical
Molecular Biology Databases
Research Materials
Miscellaneous
