. 2024 May 27;14(1):12118.
doi: 10.1038/s41598-024-62903-5.

Ebselen analogues delay disease onset and its course in fALS by on-target SOD-1 engagement

Affiliations

Ebselen analogues delay disease onset and its course in fALS by on-target SOD-1 engagement

Seiji Watanabe et al. Sci Rep. .

Abstract

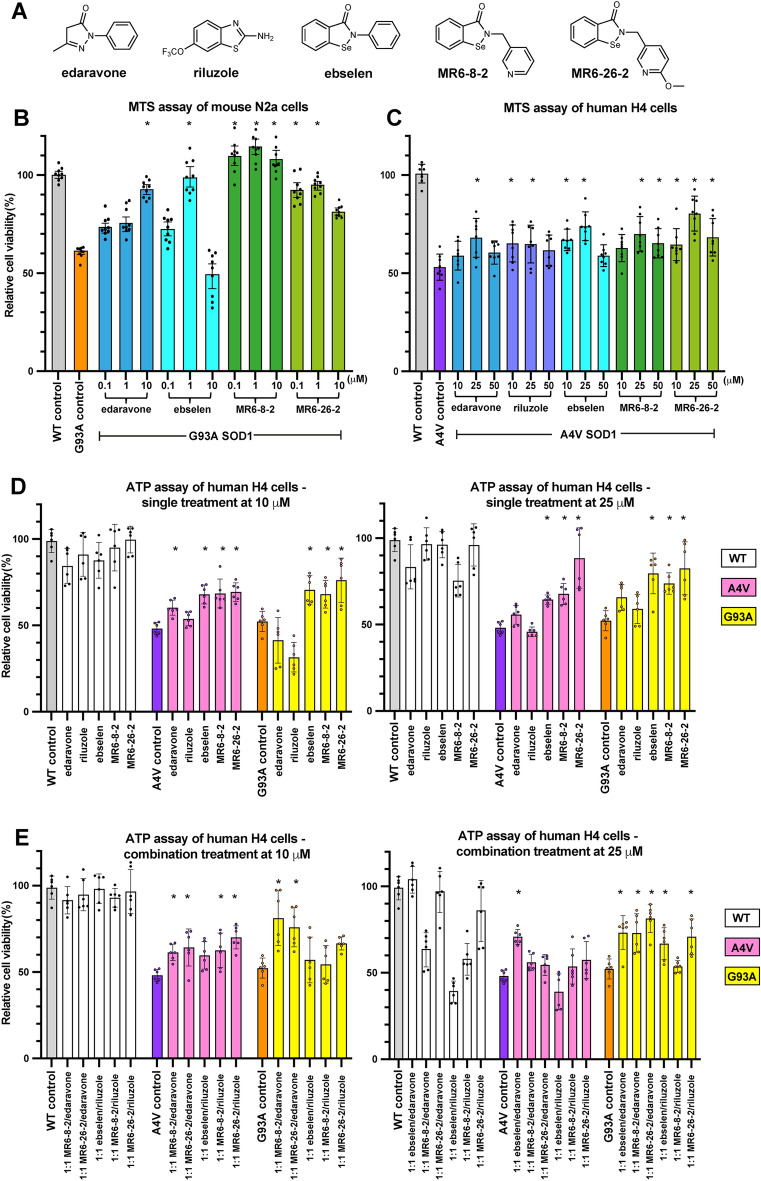
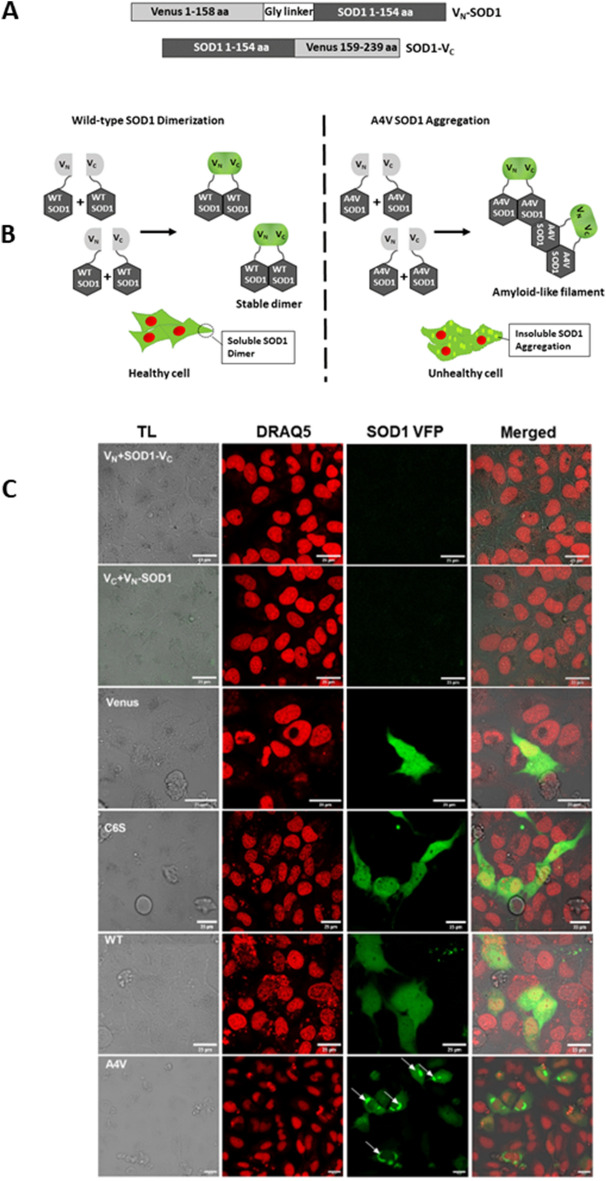
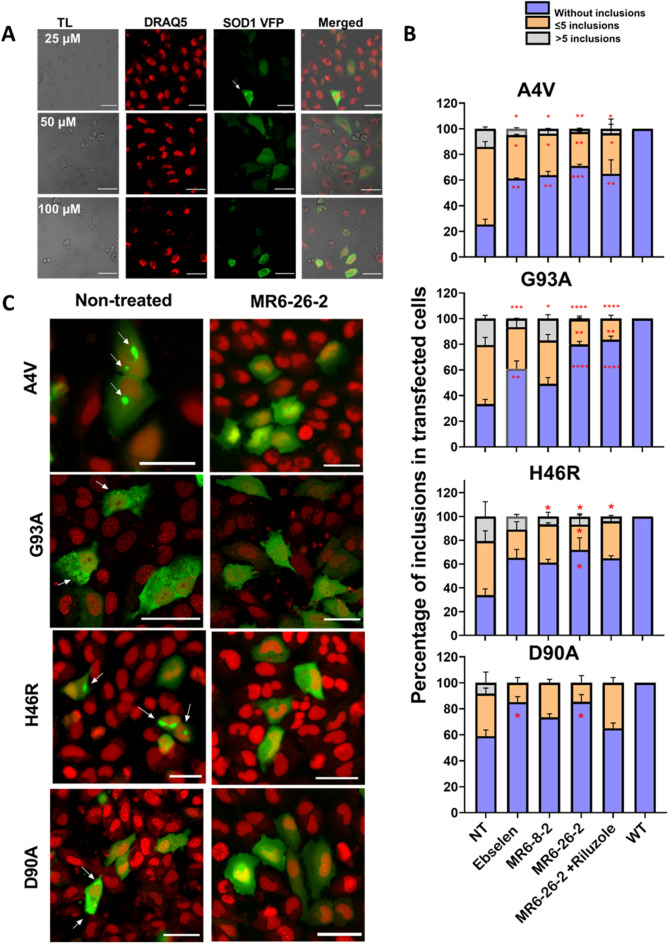
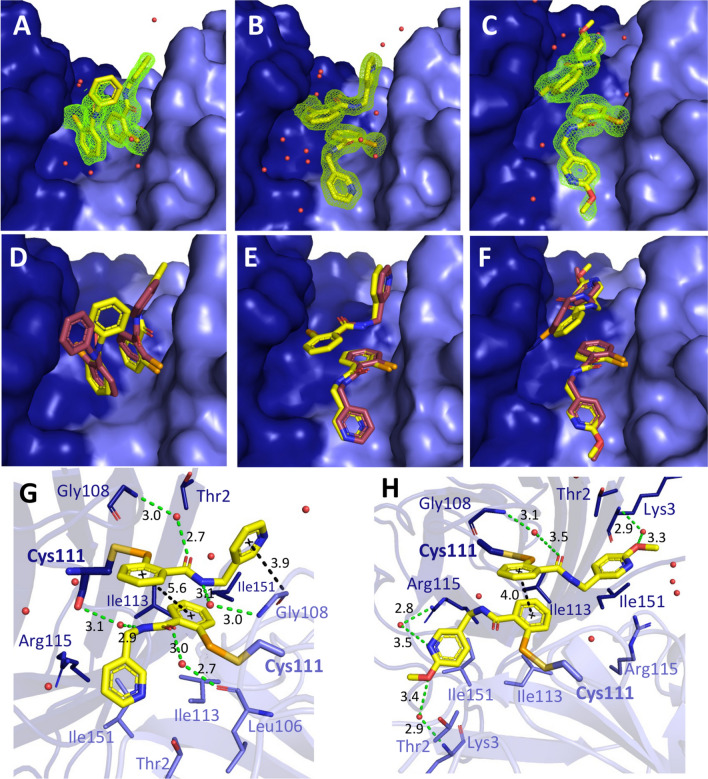
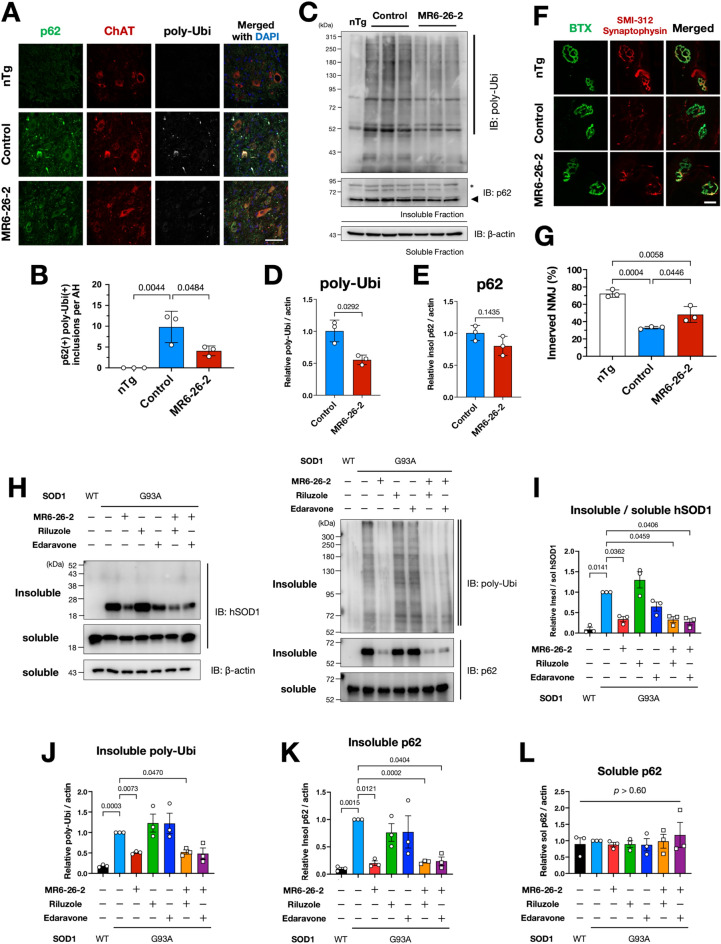
Amyotrophic lateral sclerosis (ALS) selectively affects motor neurons. SOD1 is the first causative gene to be identified for ALS and accounts for at least 20% of the familial (fALS) and up to 4% of sporadic (sALS) cases globally with some geographical variability. The destabilisation of the SOD1 dimer is a key driving force in fALS and sALS. Protein aggregation resulting from the destabilised SOD1 is arrested by the clinical drug ebselen and its analogues (MR6-8-2 and MR6-26-2) by redeeming the stability of the SOD1 dimer. The in vitro target engagement of these compounds is demonstrated using the bimolecular fluorescence complementation assay with protein-ligand binding directly visualised by co-crystallography in G93A SOD1. MR6-26-2 offers neuroprotection slowing disease onset of SOD1G93A mice by approximately 15 days. It also protected neuromuscular junction from muscle denervation in SOD1G93A mice clearly indicating functional improvement.

Keywords: Amyotrophic lateral sclerosis; Drug development; Ebselen; Motor neuron disease; Riluzole; Superoxide dismutase; Target engagement.


Conflict of interest statement

The authors declare no competing interests.

Figures

Figure 1
Figure 1
Cell viability of human and mouse neuronal cells expressing wild-type SOD1 and ALS-associated mutants of A4V and G93A under treatments of ebselen-based compounds and ALS-approved drugs. (A) Chemical structures of approved ALS drugs, ebselen and derivatives. (B) MTS assay of mouse N2a neuroblastoma cells transfected with G93A SOD1. (C) human H4 neuroglioma cells transfected with A4V SOD1, and (D,E) ATP bioluminescent assay for single compound and in combination with approved drugs using human H4 neuroglioma cells transfected with wild-type, A4V and G93A SOD1. Cell viability levels are shown in bar chart with data points and error bars representing standard deviation of the mean from at least 6 separate measurements. Asterisks above bar charts indicate statistically significant improvements (p < 0.05) against untreated control groups.
Figure 2
Figure 2
The BiFC assay reliably captures the differences between wild-type and mutant SOD1. (A) Schematic illustration of the DNA constructs of the human SOD1 fused to truncated Venus fluorescent protein segments using a larger N-terminal fragment of Venus (VN), corresponding to amino acids 1–158, and a smaller C-terminal fragment (VC), corresponding to amino acids 159–239. (B) Schematic presentation of BiFC assay. Dimerization of WT SOD1 fused to Venus fragments generates fluorescence from the fusion of VN and VC fragments. (C) In the A4V SOD1 mutant, Venus fluorescence complementation allows to detect amyloid-like filament formation (aggregates/inclusion) due to non-native (unstable) A4V SOD1 dimerization. Representative images showing the different negative and positive controls to demonstrate the ability of BiFC assay to differentiate between stable, unstable or no SOD1 dimerization. Reciprocal negative controls of SOD1 VC with empty VN (VN + SOD1 VC or VN SOD1 with empty VC (VC + VN SOD1) vectors showing no fluorescence due to lack of dimerization in the absence of complimentary SOD1. Venus is pVenus N1 empty plasmid that does not contain SOD1 and only expresses VFP; C6S, a positive control, is an internal non-specific mutation and interaction of VN C6S SOD1 and C6S SOD1 VC presents uniform fluorescence WT represents the interaction of VN WT SOD1 and WT SOD1 VC displayingeven fluorescence A4V, aSOD1 mutant and represents the interaction of VN A4V SOD1 and A4V SOD1 VC leading to the aggregates/inclusion formation (shown by white arrows), scale bar: 25 μm. Left to right panel for each control shows transmitted light (TL), DRAQ5 stained nuclei, SOD1 VFP (after complementation of SOD1 Vc or SOD1 VN) and merged images respectively.
Figure 3
Figure 3
Ebselen and its derivatives reduce aggregating species in human cell model. (A) Effects of drug (MR6-26-2) doses 25, 50 and 100 µM on SOD1 dimerization following transfection and drug treatment of H4 cells with A4V (VN + VC), scale bar: 25 µm. Left to right panel for each dose shows transmitted light (TL), DRAQ5 stained nuclei, SOD1 VFP (after complementation of SOD1 VC or SOD1 VN) and merged images respectively. (B) Quantification of the number of inclusions per cell. 50–200 cells were counted per condition and per experiment and classified into three groups: blue, orange, and grey bars represent the percentage of cells without inclusions, with 5 or less inclusions and cells with more than 5 inclusions respectively. Data are expressed as mean ± SD of at least three independent experiments. One-way ANOVA, with Dunnet’s multiple comparison, was used for statistical analysis with significance level of * p < 0.05 ***p < 0.001 or ****p < 0.0001, which represents statistically different results between mutant SOD1 with and without compound treatment. (C) Representative images showing reduction in the aggregation propensity of H4 cells expressingA4V, G93A, H46R and D90A following treatment with most effective MR6-26-2 compound versus non-treated cells (scale bar: 50 µm). White arrows indicate the mutant SOD1 aggregation. The scaling of the images has been kept different to make the aggregates/inclusion bodies clearly visible in non-treated conditions, and to show the maximum possible number of cells within a single field as proof of drug efficacy in stable SOD1 dimerization and uniform fluorescence following treatment with MR6-26-2.
Figure 4
Figure 4
Co-crystalised structures of G93A SOD1 with ebselen, MR6-8-2 and MR6-26-2. Electron density (2Fo–Fc) maps of (A) ebselen, (B) MR6-8-2, and (C) MR6-26-2 are contoured at 1σ in green mesh. Ligands and waters are illustrated as yellow sticks and red sphere, respectively. Individual SOD1 monomers are coloured in dark and light blue surface. Overlaid ligand poses in co-crystalised G93A (yellow sticks) and A4V SOD1 (pink sticks) structures of (D) ebselen, (E) MR6-8-2, and (F) MR6-26-2. Structures of A4V SOD1 with corresponding compounds are obtained from PDBs: 6Z4G, 6Z4L and 6Z4M respectively. Binding modes of (G MR6-8-2 and (H) MR6-26-2 are shown among amino acid residues (dark and light blue sticks) and water molecules in SOD1 dimer interface. Hydrogen bonds and distances between molecules are shown as green and black dashes, respectively. Numbers represent distances in Ångstroms.
Figure 5
Figure 5
MR6-26-2 decreased misfolded SOD1 species and delayed the disease onset of SOD1G93A mice. (A,B) Onset (A) and survival (B) curves of the control or MR6-26-2 treated female SOD1G93A mice plotted over time (n = 20, each). The mean ages for onset or survival are shown with SD. (C) Changes in clasping score of the control or MR6-26-2 treated SOD1G93A mice plotted over time (n = 20, each). The data were analyzed by two-way ANOVA following posthoc multiple comparisons with Šidák correction. (D,E) Decrease of insoluble SOD1 species in the spinal cords of MR6-26-2 treated SOD1G93A mice at 120 days old. A representative immunoblotting image is shown (D), and the relative expressions of insoluble SOD1 per soluble SOD1 were quantified and plotted as mean ± SEM (E). (F,G) SOD1 oligomers produced by aberrant disulfide bonds (hSOD1 S-S oligomers) were decreased in the spinal cords of MR6-26-2 treated SOD1G93A mice at 120 days old. A representative immunoblotting image indicates the hSOD1 S-S oligomers (a bold line) (F). Relative expressions of hSOD1 S-S oligomers were quantified and plotted as mean ± SEM (G). (HJ) Immunofluorescent analyses of lumbar spinal cord sections of early symptomatic SOD1G93A mice showed the decrease of misfolded SOD1 species, detected using a C4F6 antibody that specifically recognizes misfolded SOD1, by the MR6-26-2 treatment. Motor neurons were identified using an anti-choline acetyltransferase (ChAT) antibody. Representative immunofluorescent image is shown (H), and the relative fluorescence intensity of C4F6 (I) or the number of ChAT-positive motor neurons (J) in the ventral horn averaged per mouse was quantified and plotted as mean ± SD. Each dot represents the section used for the quantification (I,J). Scale bar: 50 µm.
Figure 6
Figure 6
MR6-26-2 ameliorated a neuromuscular junction pathology of SOD1G93A mice and improved proteostasis in vitro and in vivo. (A,B) The MR6-26-2 treatment reduced poly-ubiquitin- (poly-Ubi) and p62/SQSTM1-positive inclusions in the 120-days-old SOD1G93A lumbar spinal cord. Representative immunofluorescent images are shown (A). The number of the inclusions per anterior horn (AH) quantified from three mice are plotted as mean ± SEM (n = 3) (B). Scale bar: 75 µm. (CE) Immunoblot analyses of poly-Ubi and p62 expressions in insoluble fractions of spinal cords from the control or MR6-26 treated SOD1G93A mice at 120 days old. Representative immunoblotting images are shown (C), and the quantification results of insoluble poly-Ubi (bold line in C) and insoluble p62 (black rectangle) are expressed as mean ± SEM in (D) and (E), respectively. An asterisk indicates non-specific bands. (F,G) MR6-26-2 reduced denervation at neuromuscular junctions (NMJs) of 120-days-old SOD1G93A mice. Representative immunofluorescent images of tibialis anterior muscles are shown (F). Bungarotoxin (BTX) and synaptophysin indicate postsynaptic acetylcholine receptors on muscles and motor nerve terminal ends, respectively. Innerved NMJ ratio was quantified as a co-localization ratio of BTX and synaptophysin and plotted as mean ± SD (n = 3) (G). (HL) MR6-26-2 improved proteostasis in cultured Neuro2a cells. Representative immunoblotting images are shown (H), and the quantification results of insoluble SOD1 ratio against soluble SOD1 (I), insoluble poly-Ubi (indicated by a double line in H) (J), and insoluble (K) or soluble (L) p62 are expressed as mean ± SEM (n = 3, each), respectively. Three independent experiments were performed, and the amount of each protein was quantified as relative to the DMSO-treated controls with SOD1G93A expression. Scale bar: 10 µm.
Figure 7
Figure 7
Mean plasma concentration–time profiles and Pharmacokinetic parameters of MR6-26-2. Mean plasma concentration–time profiles of MR6-26-2 after single IV and PO dose administrations in female CD1 mice. Pharmacokinetic parameters of MR6-26-2 after an oral dose of 30 mg/kg (top table) and an IV dose at 1 mg/kg (lower table) in female CD1 mice. F = (AUCINF-PO/mean AUCINF-IV)/(DosePO/DoseIV) × 100%, AUClast was alternatively used for F calculation when AUCINF was not available or beyond 120% of AUClast. The compound were formulated in 5%DMAC + 95% (20% HP-beta-CD in saline) at 0.2 mg/mL for IV dosing and CMC (0.5%), benzyl alcohol (0.5%), Tween 80 (0.4%) and NaCl (0.9%) at 3 mg/mL for PO dosing, respectively. PK parameters were estimated by non-compartmental model using WinNonlin 8.2.

References

    1. Robberecht W, Philips T. The changing scene of amyotrophic lateral sclerosis. Nat. Rev. Neurosci. 2013;14:248–264. doi: 10.1038/nrn3430. - DOI - PubMed
    1. Rosen DR, Siddiquet T, Pattersont D, Figlewicz DA, Sapp P, Hentati A, et al. Mutations in Cu/Zn superoxide dismutase gene are associated with familial amyotrophic lateral sclerosis. Nature. 1993;362:59–62. doi: 10.1038/362059a0. - DOI - PubMed
    1. Mejzini R, Flynn LL, Pitout IL, Fletcher S, Wilton SD, Akkari PA. ALS genetics, mechanisms, and therapeutics: Where are we now? Front. Neurosci. 2019;13:1–27. doi: 10.3389/fnins.2019.01310. - DOI - PMC - PubMed
    1. Bäumer D, Talbot K, Turner MR. Advances in motor neurone disease. J. R. Soc. Med. 2014;107:14–21. doi: 10.1177/0141076813511451. - DOI - PMC - PubMed
    1. Liu ZJ, Lin HX, Wei Q, Zhang QJ, Chen CX, Tao QQ, et al. Genetic spectrum and variability in Chinese patients with amyotrophic lateral sclerosis. Aging Dis. 2019;10:1199–1206. doi: 10.14336/AD.2019.0215. - DOI - PMC - PubMed

MeSH terms

Grants and funding