. 2024 Aug;27(8):1489-1504.
doi: 10.1038/s41593-024-01664-w. Epub 2024 May 27.

Regulation of cell distancing in peri-plaque glial nets by Plexin-B1 affects glial activation and amyloid compaction in Alzheimer's disease

Affiliations

Regulation of cell distancing in peri-plaque glial nets by Plexin-B1 affects glial activation and amyloid compaction in Alzheimer's disease

Yong Huang et al. Nat Neurosci. 2024 Aug.

Abstract

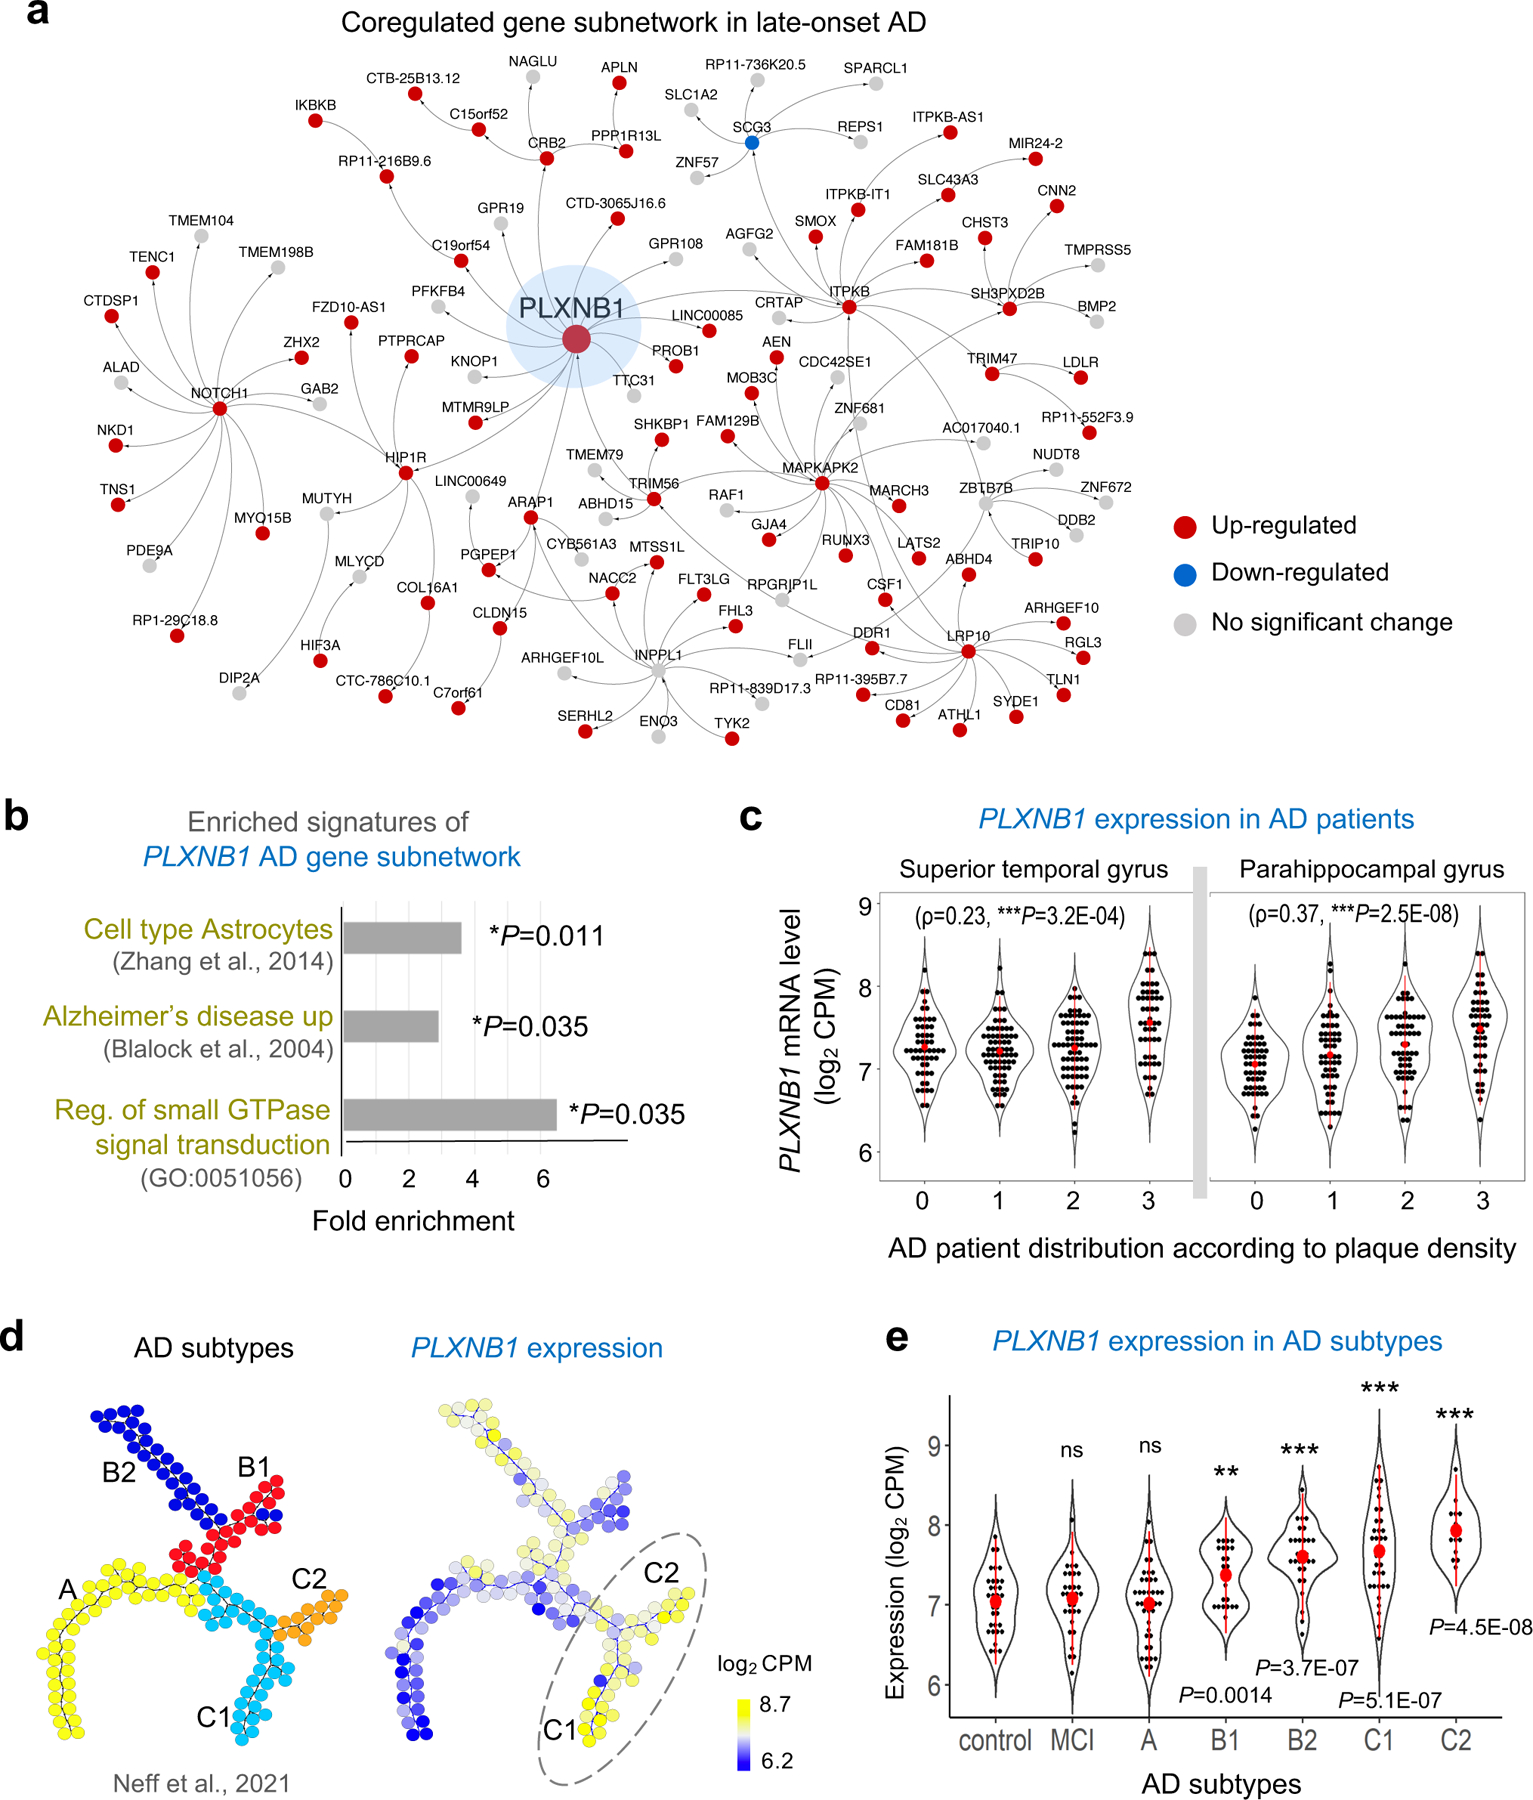
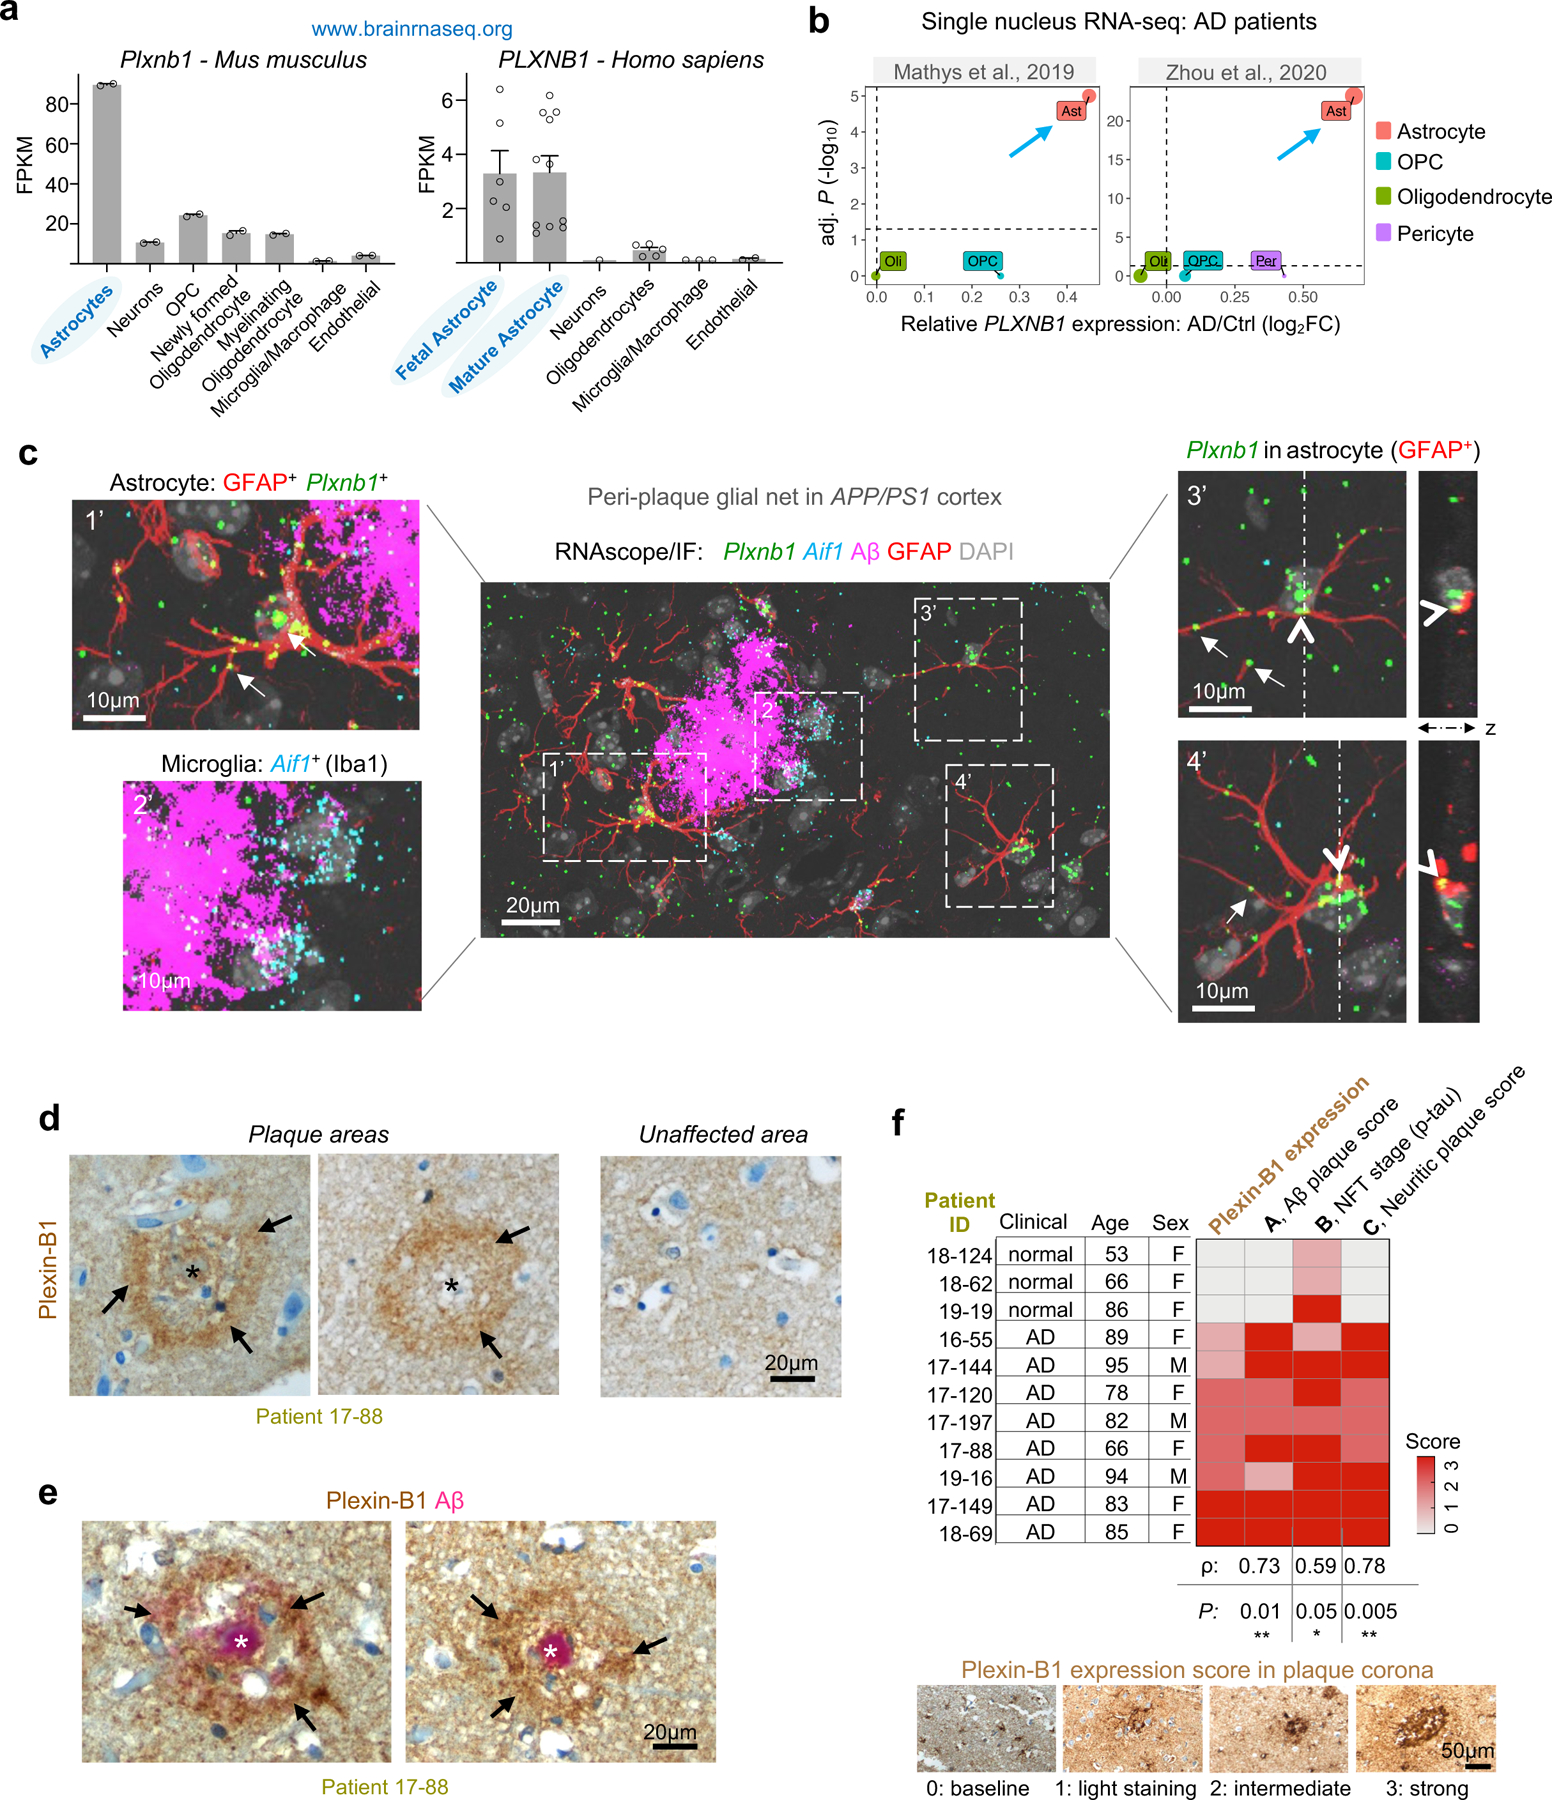
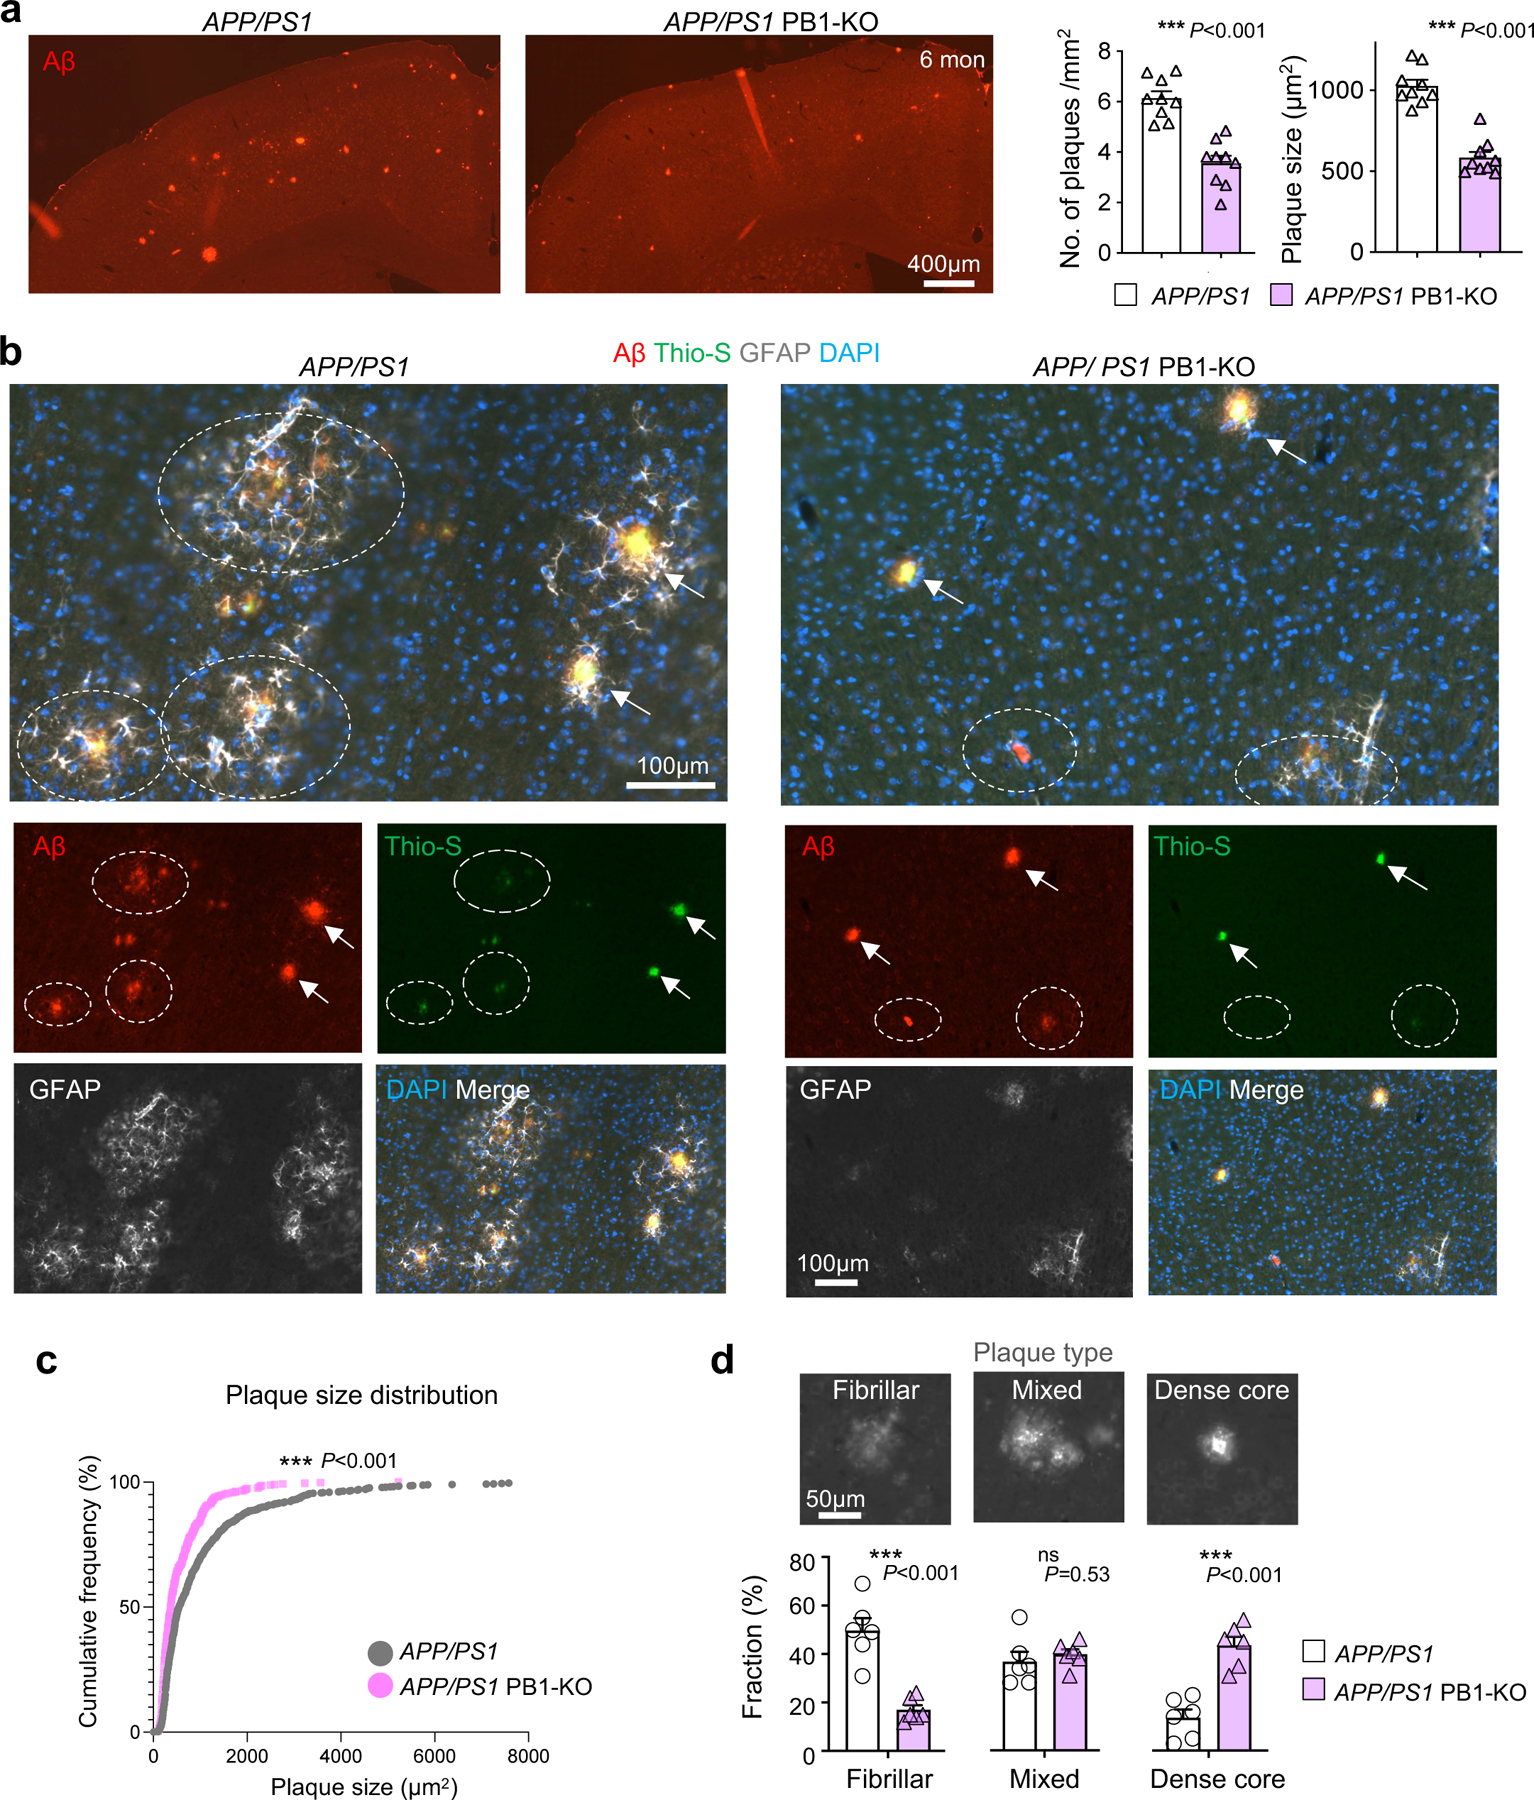
Communication between glial cells has a profound impact on the pathophysiology of Alzheimer's disease (AD). We reveal here that reactive astrocytes control cell distancing in peri-plaque glial nets, which restricts microglial access to amyloid deposits. This process is governed by guidance receptor Plexin-B1 (PLXNB1), a network hub gene in individuals with late-onset AD that is upregulated in plaque-associated astrocytes. Plexin-B1 deletion in a mouse AD model led to reduced number of reactive astrocytes and microglia in peri-plaque glial nets, but higher coverage of plaques by glial processes, along with transcriptional changes signifying reduced neuroinflammation. Additionally, a reduced footprint of glial nets was associated with overall lower plaque burden, a shift toward dense-core-type plaques and reduced neuritic dystrophy. Altogether, our study demonstrates that Plexin-B1 regulates peri-plaque glial net activation in AD. Relaxing glial spacing by targeting guidance receptors may present an alternative strategy to increase plaque compaction and reduce neuroinflammation in AD.


Conflict of interest statement

Competing Interests

The authors declare no competing interests.

Figures

Figure 1.
Figure 1.. Plexin-B1 is a hub gene of AD gene subnetwork with expression correlating with AD pathology.
A) Multiscale gene network analysis of multi-omics AD patient data (Mount Sinai Brain Bank cohort) identified PLXNB1 as a hub in a coregulated gene subnetwork underlying late-onset AD. B) Significantly enriched gene sets in the PLXNB1 subnetwork. C) PLXNB1 mRNA levels positively correlated with plaque density in the brain regions affected by AD (Spearman’s Rho (ρ) rank correlation analyses; data from Mount Sinai Brain Bank cohort). Each dot represents one patient sample. AD patients were classified according to mean plaque density as described in ref. D) PLXNB1 mRNA is up-regulated in AD patient samples, especially those with greater Aβ-associated alterations (i.e., AD subtypes C1 and C2), as defined in ref.. Each circle represents one patient from Mount Sinai Brain Bank cohort (n=151 patients). E) PLXNB1 expression in parahippocampal gyrus of health controls, patients with mild cognitive impairment (MCI), or different AD subtypes (as defined in ref.). Each dot represents one patient. One-tailed t-test.
Figure 2.
Figure 2.. Upregulation of Plexin-B1 in peri-plaque astrocytes in AD.
A) Transcriptomic data show a predominant expression of Plexin-B1 in astrocytes in both mouse and human brain. Graphs compiled from brainrnaseq.org database (refs., ). B) Analysis of snRNA-seq data of human AD patients from two independent studies (refs., ) revealed significant upregulation of PLXNB1 in astrocytes (arrows), but not other cell types. Horizontal dashed lines denote significance threshold of P=0.05 (Bonferroni corrected). Node sizes are proportional to PLXNB1 mean expression levels in different cell types. C) RNAscope ISH for Plxnb1 and Aif1 (encoding Iba1) mRNAs combined with IF for GFAP and Aβ (antibody 6E10) of cortex of 6 months old APP/PS1 mouse. DAPI for nuclear staining. Note the presence of Plxnb1 mRNA puncta (examples denoted by arrows) in peri-plaque astrocytes (GFAP+) (enlarged images 1’, 3’, and 4’), but not microglia (enlarged image 2’). Orthogonal slices of z-stacks of areas 3’ and 4’ confirmed localization of Plxnb1 mRNA puncta inside soma and branches of astrocytes (arrowheads). D, E) IHC images of post-mortem AD patient brain probed for Plexin-B1 alone (D) or co-stained for β-amyloid (antibody 4G8) (E). Hematoxylin for nuclear counterstain. Note elevated Plexin-B1 protein expression in a corona-like pattern (arrows) surrounding amyloid plaques. F) Heatmap of Plexin-B1 protein expression score near plaques and corresponding neuropathology scores for 11 AD patients (Mount Sinai Brain Bank cohort). Neuropathology scoring according to “ABC” system, . Pearson correlation coefficient (ρ) and associated P values are indicated. Representative examples of Plexin-B1 expression score scheme shown below.
Figure 3.
Figure 3.. Plexin-B1 KO reduced the footprint of peri-plaque glial nets in mouse AD model.
A) Representative IF images of cortical areas stained for Aβ (antibody 6E10), reactive astrocytes (GFAP), and nuclear counterstaining (DAPI). Note smaller glial nets around amyloid plaques (dashed boxes) in APP/PS1 PB1-KO mice as compared to the larger ones (dashed ovals) in APP/PS1 mice. A small gray oval in APP/PS1 image covers a dust artifact. B) Confocal IF images of glial nets surrounding plaques in APP/PS1 and APP/PS1 PB1-KO mice. Dashed lines outline the perimeter of glial net territory defined by GFAP+ cells. Quantifications show reduced glial net sizes in PB1-KO mice, with reduced distances of GFAP+ cells to plaque. Unpaired t-test. n=9 sections per genotype, from 3 independent mice each; for glial net size, each data point represents the mean of 11 randomly selected peri-plaque glia nets from one section; for cell distance to plaque, violin plots from n=104 and 55 cells for genotypes, showing median, quartiles, and minimum and maximum values. C) Quantifications show lower number and reduced cell areas of GFAP+ astrocytes in glial nets in APP/PS1 PB1-KO mice. In contrast, density of GFAP+ cells was higher in PB1-KO condition, as was plaque coverage by GFAP+ astrocytic processes. Unpaired t-test. n=9 sections per genotype from 3 independent mice (each data point represents the mean of randomly selected glia nets from one section). D) Quantifications of IBA1high microglia indicate lower number, but higher density, cell area, and plaque coverage in APP/PS1 PB1-KO mice. Unpaired t-test. n=9 sections from 3 independent mice of each genotype (each data point represents the mean of randomly selected glia nets from one section). E) Schematic depiction of phenotypic differences of glial nets with Plexin-B1 KO in AD: smaller but more compact peri-plaque glial nets, with fewer reactive astrocytes and activated microglia, reduced cellular spacing, and increased plaque coverage by glial processes.
Figure 4.
Figure 4.. scRNA-seq reveals the impact of Plexin-B1 KO on activation profiles of reactive astrocytes in AD.
A) UMAP embedding of combined scRNA-seq data from prefrontal cortices of 6-month-old mice with genotypes WT, PB1-KO, APP/PS1, and APP/PS1 PB1-KO. Ten major cell type clusters were detected. SMC, smooth muscle cells. B, C) Feature and violin plots show a predominant expression of Plxnb1 in astrocytes, and effective ablation in PB1-KO mice. D) UMAP shows 9 astrocyte subclusters based on scRNA-seq data. E) Expression of Plxnb1 and marker genes in astrocyte subclusters in APP/PS1 mice. Note higher expression of Gfap and Vim in sc-8. F) Upregulation of Plxnb1 mRNA in astrocyte subcluster sc-8 in APP/PS1 mice as compared to WT. G) Signature score profiling shows sc-8 with highest expression for gene signatures of disease associated astrocytes identified in AD (DAA), reactive astrocytes, and astrocytes in experimental autoimmune encephalomyelitis (EAE). H) Volcano plot showing DEGs of sc-8 astrocytes, comparing APP/PS1 PB1-KO vs. APP/PS1 condition. I) Gene ontology enrichment analysis by Enrichr of up- and downregulated DEGs in sc-8 astrocytes (APP/PS1 PB1-KO vs. APP/PS1). BP, Biological process; MF, molecular function; CC, cellular component.
Figure 5.
Figure 5.. Increased microglial activation in APP/PS1 PB1-KO mice.
A) UMAP embedding shows microglia subclusters, with sc-9 representing disease-associated microglia (DAM) as defined in ref.. B) Violin plots show higher expression of DAM marker genes in microglia sc-9. C) Violin plots show lower expression of homeostatic microglia genes Cx3cr1, P2ry12, and Tmem119 in microglia sc-9. D) Proportions of microglia subclusters in different genotype conditions. Microglia sc-9 (DAM-like) was expanded in APP/PS1 mice, but this expansion was lowered in APP/PS1 PB1-KO. E) Volcano plot shows DEGs in DAM microglia sc-9 (APP/PS1 PB1-KO vs. APP/PS1). F) Gene ontology enrichment analysis by Enrichr of upregulated DEGs in microglia sc-9 (APP/PS1 PB1-KO vs. APP/PS1) indicated increased microglial activation in Plexin-B1 deletion condition.
Figure 6.
Figure 6.. Plexin-B1 governs cell spacing/aggregation pattern and cytokine expression in primary astrocytes.
A) Primary astrocytes from control or PB1-KO mice were cultured for two days and stained for astrocyte nuclear marker Sox9 and F-actin (phalloidin). PB1-KO astrocytes displayed more clustering (arrows), defined as an inter-connected groups of cells with nuclei less than 35 μm apart. Aggregation rate defined as 1-(connected components/total nuclei). n=10 randomly selected areas from 4 independent experiments; unpaired t-test. B) Images of control or PB1-KO astrocytes in hanging drop aggregation assay. PB1-KO astrocytes formed larger aggregates, resulting in lower total number of aggregates. n=8 drops for each condition from 3 independent experiments; two-way ANOVA with Sidak’s multiple comparison test. C) Cytokine ELISA profiling (Proteome Profiler Mouse XL Cytokine Array, R&D Systems) revealed reduced cytokine/chemokine expression in PB1-KO astrocytes. n=4 four data points for each condition, from 2 independent assays. D) IF images of 2 day co-culture of primary astrocytes with microglia, treated with TNFα (100 ng/ml) for 24 hr. In co-culture with WT astrocytes, microglia clustered together, a pattern absent in co-culture with PB1-KO astrocytes. Quantifications below show distribution of immunofluorescence (IF) profiles of GFAP and IBA1, averaged over 6 regions of interest (ROI).
Figure 7.
Figure 7.. Reduced plaque burden and shift to dense-core type in AD mice with Plexin-B1 KO.
A) Representative IF images for amyloid plaques (antibody 6E10) in forebrain sections from 6-month-old APP/PS1 mice with or without Plexin-B1 KO. Quantifications show reduced plaque burden (smaller number and size of plaques) with PB1-KO. Unpaired t-test. n=9 sections per genotype, from 3 independent mice each. For plaque size, each data point represents the mean of all plaques from one section. B) IF images of forebrain sections show amyloid plaques in APP/PS1 mice with and without PB1-KO. Dashed ovals denote diffuse plaques stained only weakly by the amyloid-binding Thio-S; arrows point to dense core plaques with strong staining by Thio-S. Note the reduced size of peri-plaque glial nets (demarcated by GFAP+ cells) in PB1-KO. C) Cumulative frequency plot shows more compact plaque areas (6E10 antibody staining) in Plexin-B1 KO mice. Two-way ANOVA with Sidak’s multicomparison test. n=741 (APP/PS1) and 428 (APP/PS1 PB1-KO) plaques from 9 sections of three independent mice per genotype. D) Quantification of plaque types shows that in APP/PS1 mice, Plexin-B1 KO led to a shift of plaques from fibrillar to dense core type. Scoring scheme of plaques is illustrated above. n=6 brain sections per genotype. Unpaired t-test. ns, not significant.
Figure 8.
Figure 8.. Decreased neuritic dystrophy in Plexin-B1 KO AD mice.
A) Representative IF images co-stained for amyloid plaque, neuritic dystrophy lysosomal marker LAMP1, and autophagosome marker ATG9A in forebrains of 6 months old APP/PS1 and APP/PS1 PB1-KO mice. Quantifications reveal reduced overall number and size of LAMP1 or ATG9A signals. Unpaired t-test. For number quantification, n=10–23 section areas from three independent mice per genotype. For LAMP+ plaque size quantification, n= 623 (APP/PS1) or 364 (APP/PS1 PB1-KO); for ATG9A+ plaque size quantification, n= 715 (APP/PS1) or 540 (APP/PS1 PB1-KO); three independent mice per genotype. B) IF images of amyloid plaques surrounded by myeloid cells (stained for phagocytosis marker CD68). Quantifications show reduced CD68+ signals around plaques, corresponding to smaller size of plaques in PB1-KO (note that the ratio of CD68+ area in relation to plaque area was comparable between APP/PS1 and APP/PS1 PB1-KO). n=41 (APP/PS1) or 33 (APP/PS1 PB1-KO) plaques, from 3 independent mice per genotype. For bar graph: Unpaired t-test. For dot plot: Simple linear regression test; ns, not significant. C) Summary of protective effects of Plexin-B1 deletion in AD: smaller footprints of plaque-associated glial nets, shift towards more compact amyloid plaques, and attenuated neurotoxicity.

References

    1. Long JM & Holtzman DM Alzheimer Disease: An Update on Pathobiology and Treatment Strategies. Cell 179, 312–339 (2019). - PMC - PubMed
    1. Gandy S & DeKosky ST Toward the treatment and prevention of Alzheimer’s disease: rational strategies and recent progress. Annu Rev Med 64, 367–383 (2013). - PMC - PubMed
    1. Gandy S & Ehrlich ME Alzheimer mutant speeds APP transport. J Exp Med 218 (2021). - PMC - PubMed
    1. Matejuk A & Ransohoff RM Crosstalk Between Astrocytes and Microglia: An Overview. Front Immunol 11, 1416 (2020). - PMC - PubMed
    1. Leng F & Edison P Neuroinflammation and microglial activation in Alzheimer disease: where do we go from here? Nat Rev Neurol 17, 157–172 (2021). - PubMed

Figure Legends References

    1. Haroutunian V, Katsel P & Schmeidler J Transcriptional vulnerability of brain regions in Alzheimer's disease and dementia. Neurobiol Aging 30, 561–573 (2009). - PMC - PubMed
    1. Neff RA, et al. Molecular subtyping of Alzheimer's disease using RNA sequencing data reveals novel mechanisms and targets. Sci Adv 7 (2021). - PMC - PubMed
    1. Zhang Y, et al. An RNA-sequencing transcriptome and splicing database of glia, neurons, and vascular cells of the cerebral cortex. J Neurosci 34, 11929–11947 (2014). - PMC - PubMed
    1. Zhang Y, et al. Purification and Characterization of Progenitor and Mature Human Astrocytes Reveals Transcriptional and Functional Differences with Mouse. Neuron 89, 37–53 (2016). - PMC - PubMed
    1. Mathys H, et al. Single-cell transcriptomic analysis of Alzheimer's disease. Nature 570, 332–337 (2019). - PMC - PubMed