. 2024 Aug;27(8):1534-1544.
doi: 10.1038/s41593-024-01663-x. Epub 2024 May 27.

NG2 glia protect against prion neurotoxicity by inhibiting microglia-to-neuron prostaglandin E2 signaling

Affiliations

NG2 glia protect against prion neurotoxicity by inhibiting microglia-to-neuron prostaglandin E2 signaling

Yingjun Liu et al. Nat Neurosci. 2024 Aug.

Abstract

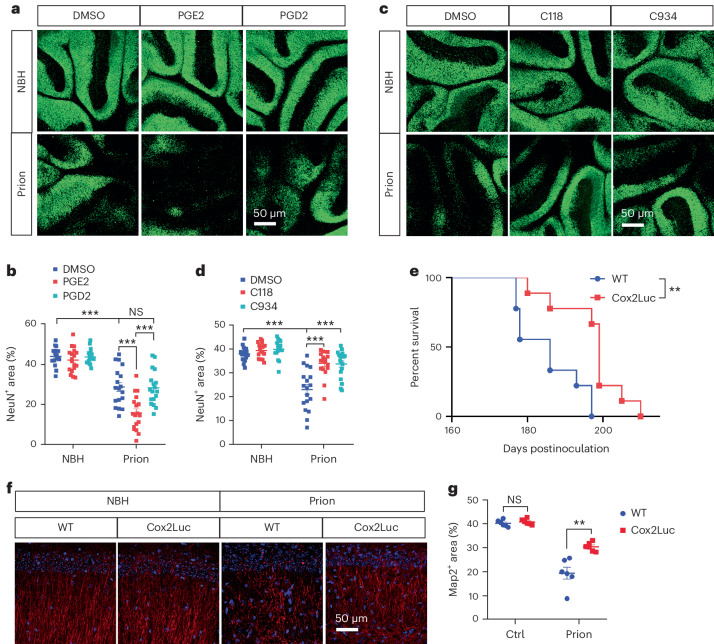
Oligodendrocyte-lineage cells, including NG2 glia, undergo prominent changes in various neurodegenerative disorders. Here, we identify a neuroprotective role for NG2 glia against prion toxicity. NG2 glia were activated after prion infection in cerebellar organotypic cultured slices (COCS) and in brains of prion-inoculated mice. In both model systems, depletion of NG2 glia exacerbated prion-induced neurodegeneration and accelerated prion pathology. Loss of NG2 glia enhanced the biosynthesis of prostaglandin E2 (PGE2) by microglia, which augmented prion neurotoxicity through binding to the EP4 receptor. Pharmacological or genetic inhibition of PGE2 biosynthesis attenuated prion-induced neurodegeneration in COCS and mice, reduced the enhanced neurodegeneration in NG2-glia-depleted COCS after prion infection, and dampened the acceleration of prion disease in NG2-glia-depleted mice. These data unveil a non-cell-autonomous interaction between NG2 glia and microglia in prion disease and suggest that PGE2 signaling may represent an actionable target against prion diseases.


Conflict of interest statement

The authors declare no competing interests.

Figures

Fig. 1
Fig. 1. NG2 glia activation in prion disease models.
a,b, Western blots (a) and quantification (b) of NG2 and NeuN in Tga20 COCS exposed to prions or NBH; n = 6 samples per condition. Data are presented as mean ± s.e.m. Unpaired t-test (two-sided): P < 0.0001 for NeuN; P = 0.0021 for NG2. c,d, Western blots (c) and quantification (d) of NG2 and Pdgfrα in brain tissues of mice inoculated with prions or NBH; n = 6 mice per condition. Data are presented as mean ± s.e.m. Unpaired t-test (two-sided): P = 0.0202 for Pdgfrα; P < 0.0001 for NG2. e, NG2 immunofluorescence showing NG2 glia activation in prion-infected Tga20 COCS versus Tga20 COCS exposed to NBH. Nuclei were stained with 4,6-diamidino-2-phenylindole (DAPI) (blue). f, Quantification of NG2 immunointensity shown in e; n = 12 slices for NBH; n = 14 slices for prion. Data are presented as mean ± s.e.m. Unpaired t-test (two-sided): P < 0.0001. g, NG2 glia activation in the cerebral cortex (Ctx), hippocampus (Hipp) and thalamus (Thal) of prion-inoculated mice versus mice inoculated with NBH. h, Quantification of NG2 immunointensity shown in g; n = 6 mice per group. Data are presented as mean ± s.e.m. Unpaired t-test (two-sided): P < 0.0001 for Ctx; P = 0.0001 for Hipp; P = 0.0005 for Thal. Source data
Fig. 2
Fig. 2. NG2 glia depletion enhances prion neurotoxicity and accelerates prion disease.
a, NeuN and NG2 immunofluorescence showing prion-induced neurodegeneration in NG2-glia-depleted (CP673451) and NG2-glia-intact (DMSO) Tga20 COCS. b, Quantification of NG2 immunointensity and NeuN positive area shown in a. NeuN: n = 18 slices per condition. NG2: n = 19 slices for NBH + DMSO, NBH + CP673451 and prion + CP673451; n = 17 slices for prion + DMSO. Data are presented as mean ± s.e.m. One-way ANOVA with Benjamini–Hochberg FDR adjustment for multiple comparisons. NG2: P = 0.0002 (NBH + DMSO versus NBH + CP673451), P < 0.0001 (NBH + DMSO versus prion + DMSO), P < 0.0001 (prion + DMSO versus prion + CP673451); NeuN: P = 0.5603 (NBH + DMSO versus NBH + CP673451), P < 0.0001 (NBH + DMSO versus prion + DMSO), P < 0.0001 (prion + DMSO versus prion + CP673451). c, Survival curves showing accelerated prion disease in NG2-glia-depleted (PdgfrαiDTR) mice after prion inoculation. Median survival: 191 days for male PdgfrαiDTR mice; 205.5 days for male control mice; 174.5 days for female PdgfrαiDTR mice; 183 days for female control mice. Male: n = 10 for Ctrl; n = 7 for PdgfrαiDTR. Female: n = 11 for Ctrl; n = 6 for PdgfrαiDTR. Log-rank test: P = 0.0026 for male; P < 0.0001 for female. d, NG2 and Map2 immunofluorescence showing enhanced dendritic pathology in hippocampi of NG2-glia-depleted (PdgfrαiDTR) mice after prion inoculation. Arrowheads, pathologic dendrites with varicosities and fragmentation. NG2 glia depletion was induced at 16 wpi; brain samples were collected at 21 wpi. e, Quantification of NG2 immunointensity and Map2-positive area shown in d; n = 6 mice per group. Data are presented as mean ± s.e.m. Unpaired t-test (two-sided): P < 0.0008 for NG2; P = 0.0079 for Map2. Source data
Fig. 3
Fig. 3. Loss of NG2 glia upregulates Cox2–Ptges expression.
a,b, NG2 immunofluorescence (a) and quantification (b) in intact (DMSO) and NG2-glia-depleted (CP673451) C57BL/6J COCS; n = 7 slices per condition. Data are presented as mean ± s.e.m. Unpaired t-test (two-sided): P < 0.0001. c, qRT-PCR results showing downregulation of NG2 and Pdgfrα and upregulation of Cox2 and Ptges in NG2-glia-depleted (CP673451) C57BL/6J COCS; n = 6 samples. Data are presented as mean ± s.e.m. Multiple unpaired t-tests with Benjamini–Hochberg FDR adjustment for multiple comparisons. NG2: P < 0.0001; Pdgfrα: P < 0.0001; Cox2: P < 0.0001; Ptges: P = 0.0067. d,e, NG2 immunofluorescence (d) and quantification (e) in control (Ctrl) and PDGFAA-treated C57BL/6J COCS; n = 7 slices per condition. Data are presented as mean ± s.e.m. Unpaired t-test (two-sided): P < 0.0001. f, qRT-PCR results showing upregulation of NG2 and Pdgfrα and downregulation of Cox2 and Ptges in C57BL/6J COCS with increased NG2 glia density (PDGFAA) compared with NG2-glia-intact (Ctrl) C57BL/6J COCS; n = 4 samples for Ctrl; n = 6 samples for PDGFAA. Data are presented as mean ± s.e.m. Multiple unpaired t-tests with Benjamini–Hochberg FDR adjustment for multiple comparisons. NG2: P = 0.0018; Pdgfrα: P < 0.0001; Cox2: P = 0.0003; Ptges: P < 0.0001. g, qRT-PCR results showing upregulation of Cox2 and Ptges in NG2-glia-depleted (CP673451) Tga20 COCS after prion exposure; n = 6 samples. Data are presented as mean ± s.e.m. Unpaired t-test (two-sided): P = 0.0078 for Cox2; P = 0.0060 for Ptges. h, Cox2, Ptges and Iba1 immunofluorescence in the hippocampus showing upregulation of Cox2 and Ptges and their colocalization with microglia in brains of terminally sick prion-inoculated mice. i, Quantification of Cox2 and Ptges immunointensity shown in h; n = 3 mice for NBH and n = 4 mice for prion. Data are presented as mean ± s.e.m. Unpaired t-test (two-sided): P = 0.0099 for Cox2; P = 0.0006 for Ptges. j, Cox2 and Ptges immunofluorescence in the hippocampus showing upregulation of Cox2 and Ptges in the brains of NG2-glia-depleted (PdgfrαiDTR) mice compared with NG2-glia-intact (Ctrl) mice after prion inoculation. NG2 glia depletion was induced at 16 wpi; brain samples were collected at 21 wpi. k, Quantification of Cox2 and Ptges immunointensity shown in j; n = 6 mice per group. Data are presented as mean ± s.e.m. Unpaired t-test (two-sided): P = 0.0048 for Cox2; P = 0.0015 for Ptges. Source data
Fig. 4
Fig. 4. NG2 glia regulate microglial Cox2–Ptges through several mechanisms.
a, UMAP of single-cell RNA-seq data showing Cox2+ and Ptges+ microglia among total microglia in the cerebral cortex of prion- or NBH-inoculated mice. b, Quantification of Cox2+ and Ptges+ microglia fractions against total microglia in the cerebral cortex of prion- or NBH-inoculated mice shown in a; n = 4 mice for NBH and n = 8 mice for Prion. Data are presented as mean ± s.e.m. Unpaired t-test (two-sided): P = 0.0006 for Cox2+ microglia; P = 0.0003 for Ptges+ microglia. c, Venn diagram showing numbers of shared and distinct DEGs of Cox2+ and Ptges+ microglia in the cerebral cortex of prion-inoculated mice. d, Heatmap showing downregulation of homeostatic microglia signature genes and upregulation of DAM and MHC-II microglia signature genes as well as inflammatory genes in Cox2+ and Ptges+ microglia in the cerebral cortex of prion-inoculated mice. e, CellChat analysis of cell–cell communications showing unaltered number of interactions (plotted as the thickness of the edges) but reduced strength of interactions (plotted as the thickness of the edges) from NG2 glia to Cox2+ microglia in the cerebral cortex of prion-inoculated mice. f, Heatmaps showing significantly weakened NG2 glia to Cox2+ microglia interaction pathways in the cerebral cortex of prion-inoculated mice. g, Immunofluorescence showing that NG2-glia-derived factors such as Tgfb2, Pleiotrophin and Midkine but not Bmp7 and Semaphorin3d suppress Ptges expression in primary microglia in the presence or absence of prions. h, Quantification of Ptges immunointensity in microglia in the absence of prions shown in g; n = 4 independent experiments. Data are presented as mean ± s.e.m. One-way ANOVA with Benjamini–Hochberg FDR adjustment for multiple comparisons: P = 0.0017 (Tgfb2 versus Ctrl), P = 0.0049 (Pleiotrophin versus Ctrl), P = 0.0017 (Midkine versus Ctrl); P = 0.1675 (Bmp7 versus Ctrl), P = 0.4397 (Semaphorin3d versus Ctrl). i, Quantification of Ptges immunointensity in microglia in the presence of prions shown in g; n = 4 independent experiments. Data are presented as mean ± s.e.m. One-way ANOVA with Benjamini–Hochberg FDR adjustment for multiple comparisons: P = 0.0005 (Tgfb2 versus Ctrl), P = 0.0005 (Pleiotrophin versus Ctrl), P = 0.0005 (Midkine versus Ctrl); P = 0.6324 (Bmp7 versus Ctrl), P = 0.2549 (Semaphorin3d versus Ctrl). Source data
Fig. 5
Fig. 5. Cox2–Ptges inhibition diminishes prion neurotoxicity and decelerates prion disease.
a,b, NeuN immunofluorescence (a) and quantification (b) showing enhanced neurodegeneration in PGE2-treated compared with DMSO-treated and PGD2-treated Tga20 COCS after prion infection; n = 18 slices per condition. Data are presented as mean ± s.e.m. One-way ANOVA with Benjamini–Hochberg FDR adjustment for multiple comparisons: P < 0.0001 (NBH + DMSO versus prion + DMSO); P < 0.0001 (prion + DMSO versus prion + PGE2); P < 0.0001 (prion + PGE2 versus prion + PGD2); P = 0.8488 (prion + DMSO versus prion + PGD2). c,d, NeuN immunofluorescence (c) and quantification (d) showing diminished neurodegeneration in Tga20 COCS treated with Ptges inhibitors C118 and C934 compared with DMSO-treated Tga20 COCS after prion infection; n = 18 slices per condition. Data are presented as mean ± s.e.m. One-way ANOVA with Benjamini–Hochberg FDR adjustment for multiple comparisons: P < 0.0001 (NBH + DMSO versus prion + DMSO); P < 0.0001 (prion + DMSO versus prion + C118); P < 0.0001 (prion + DMSO versus prion + C934). e, Survival curves showing decelerated prion disease in Cox2 knockout (Cox2Luc) mice compared with littermate WT mice. Median survival: 186 days for control mice; 199 days for Cox2Luc mice; n = 9 mice per group. Log-rank test: P = 0.0024. f,g, Map2 immunofluorescence (f) and quantification (g) showing diminished dendritic pathology in the hippocampi of Cox2Luc mice after prion inoculation compared with littermate WT mice. Brain samples were collected at 21 wpi; n = 6 mice per group. Data are presented as mean ± s.e.m. Multiple unpaired t-tests (two-sided) with Benjamini–Hochberg FDR adjustment for multiple comparisons. NBH: P = 0.4270; Prion: P = 0.0033. Source data
Fig. 6
Fig. 6. Cox2–Ptges inhibition rescues enhanced neurodegeneration and accelerated prion disease after NG2 glia depletion.
a,b, NeuN immunofluorescence (a) and quantification (b) showing that enhanced neurodegeneration in prion-infected, NG2-glia-depleted (CP673451) Tga20 COCS can be rescued by treatment with Ptges inhibitors C118 and C934; n = 17 slices per condition for NBH; prion: n = 18 slices for DMSO; n = 20 slices for CP673451; n = 21 slices for CP673451 + C118 and CP673451 + C934. Data are presented as mean ± s.e.m. One-way ANOVA with Benjamini–Hochberg FDR adjustment for multiple comparisons: P < 0.0001 (NBH + DMSO versus prion + DMSO); P < 0.0001 (prion + DMSO versus prion + CP673451); P < 0.0001 (prion + CP673451 versus prion + CP673451 + C118); P = 0.0054 (prion + CP673451 versus prion + CP673451 + C934). c, Cox2 ablation (Cox2Luc) suppresses the acceleration of prion disease in NG2-glia-depleted (PdgfrαiDTR) mice. Median survival: 177 days for PdgfrαiDTR/WT mice; 184.5 days for Ctrl/WT mice; 199 days for PdgfrαiDTR/Cox2Luc and Ctrl/Cox2Luc mice. NG2 glia depletion was induced at 16 wpi; n = 10 mice for Ctrl/WT; n = 11 for PdgfrαiDTR/WT and Ctrl/Cox2Luc; n = 9 for PdgfrαiDTR/Cox2Luc. Log-rank test: P = 0.0049 (Ctrl/WT versus PdgfrαiDTR/WT); P = 0.0045 (Ctrl/WT versus Ctrl/Cox2Luc); P < 0.0001 (PdgfrαiDTR/WT versus PdgfrαiDTR/Cox2Luc); P = 0.6832 (Ctrl/Cox2Luc versus PdgfrαiDTR/Cox2Luc). d,e, Map2 immunofluorescence (d) and quantification (e) showing enhanced dendritic pathology in NG2-glia-depleted (PdgfrαiDTR) hippocampi of prion-infected mice, and its rescue by Cox2 ablation (Cox2Luc); n = 6 mice per group. Data are presented as mean ± s.e.m. One-way ANOVA with Benjamini–Hochberg FDR adjustment for multiple comparisons: P = 0.0003 (Ctrl/WT versus PdgfrαiDTR/WT); P = 0.0192 (Ctrl/WT versus Ctrl/Cox2Luc); P < 0.0001 (PdgfrαiDTR/WT versus PdgfrαiDTR/Cox2Luc); P = 0.8472 (Ctrl/Cox2Luc versus PdgfrαiDTR/Cox2Luc). Source data
Fig. 7
Fig. 7. PGE2 enhances prion neurotoxicity mainly through the EP4 receptor (Ptger4).
a,b, Live-cell imaging (a) and quantitative analysis (b) of chronically prion-infected HovS cells expressing control (Ctrl) transgene or one of the four PGE2 receptors (Ptger1–4). Effects of PGE2 treatment on prion-induced cell toxicity were measured with the ratio of GFP signals under the PGE2 condition against the DMSO condition; n = 4 independent experiments. Data are presented as mean ± s.e.m. One-way ANOVA with Benjamini–Hochberg FDR adjustment for multiple comparisons: P < 0.0001 (Ptger1 versus Ctrl); P = 0.2246 (Ptger2 versus Ctrl); P = 0.3351 (Ptger3 versus Ctrl); P < 0.0001 (Ptger4 versus Ctrl). c, Immunofluorescence of NeuN, Map2 and Tau showing cellular damage of prion-infected primary neurons treated with different concentrations of Ptger4 agonist L902688. d, Quantification of neuronal density as well as Map2-positive and Tau positive areas shown in c; n = 6 independent experiments. Data are presented as mean ± s.e.m. One-way ANOVA with Benjamini–Hochberg FDR adjustment for multiple comparisons. NeuN: P = 0.0150 (1 μM versus 0 μM); P < 0.0001 (5 μM versus 0 μM); P < 0.0001 (10 μM versus 0 μM). Map2: P = 0.0020 (1 μM versus 0 μM); P < 0.0001 (5 μM versus 0 μM); P < 0.0001 (10 μM versus 0 μM). Tau: P = 0.0005 (1 μM versus 0 μM); P < 0.0001 (5 μM versus 0 μM); P < 0.0001 (10 μM versus 0 μM). e,f, NeuN immunofluorescence (e) and quantification (f) showing concentration-dependent enhancement of prion-induced neurodegeneration in L902688-treated Tga20 COCS; n = 12 slices per condition for NBH; prion: 15 slices for 0 μM and 1 μM; 14 slices for 5 μM. Data are presented as mean ± s.e.m. One-way ANOVA with Benjamini–Hochberg FDR adjustment for multiple comparisons: P = 0.0810 (NBH + 0 μM versus NBH + 1 μM); P < 0.0001 (NBH + 0 μM versus NBH + 5 μM); P < 0.0001 (NBH + 0 μM versus prion + 0 μM); P < 0.0001 (prion + 0 μM versus prion + 1 μM); P < 0.0001 (prion + 0 μM versus prion + 5 μM). Source data
Fig. 8
Fig. 8. Diagram summarizing the main findings.
In prion diseases, microglia become activated, and upregulate the pathway responsible for PGE2 biosynthesis, which promotes prion-induced neurodegeneration through binding to neuronal EP4 receptor. NG2 glia serve as a brake in this process, inhibiting microglial Cox2–Ptges pathway and PGE2 biosynthesis through multiple mechanisms (for example, secreted signaling, ECM-receptor interaction and cell–cell contact). Several NG2-glia-derived factors playing a role in this process, such as Tgfb2, Pleiotrophin (Ptn) and Midkine (Mdk), are highlighted in the diagram.
Extended Data Fig. 1
Extended Data Fig. 1. Enhanced prion neurotoxicity in continuously NG2-glia-depleted C57BL/6 J COCS.
a, NG2 immunofluorescence showing NG2 glia activation in prion-infected C57BL/6 J COCS vs C57BL/6 J COCS exposed to NBH. Nuclei were stained with DAPI (blue). b, Quantification of NG2 immunointensity shown in a. n = 8 slices for NBH; n = 11 slices for Prion. Data are presented as mean ± SEM. Unpaired t test (two-sided): P = 0.0007. c-d, Experimental design of continuous NG2 glia depletion in Tga20 COCS (c) and C57BL/6 J COCS (d). e, NeuN and NG2 immunofluorescence showing enhanced neurodegeneration in continuously NG2-glia-depleted (CP673451) C57BL/6 J COCS compared to NG2 glia intact (DMSO) C57BL/6 J COCS after prion infection. Nuclei were stained with DAPI (blue). f, Quantification of NG2 immunointensity and NeuN positive area shown in e. n = 14 slices/condition for NeuN; NG2: 8 slices for NBH + DMSO; 10 slices for Prion+DMSO; 15 slices for NBH + CP673451 and Prion+CP673451. Data are presented as mean ± SEM. One-way ANOVA with Benjamini-Hochberg FDR adjustment for multiple comparisons. NeuN: P = 0.2466 (NBH + DMSO vs. NBH + CP673451); P = 0.0035 (NBH + DMSO vs. Prion+DMSO); P = 0.0288 (Prion+DMSO vs. Prion+CP673451). NG2: P < 0.0001 (NBH + DMSO vs. NBH + CP673451); P < 0.0001 (NBH + DMSO vs. Prion+DMSO); P < 0.0001 (Prion+DMSO vs. Prion+CP673451). Source data
Extended Data Fig. 2
Extended Data Fig. 2. Enhanced prion neurotoxicity in transiently NG2-glia-depleted Tga20 COCS.
a, Experimental design of transient NG2 glia depletion in Tga20 COCS. b, NeuN and NG2 immunofluorescence showing enhanced neurodegeneration in transiently NG2-glia-depleted (CP673451) Tga20 COCS compared to NG2 glia intact (DMSO) Tga20 COCS after prion infection. NG2 glia density is largely recovered in prion-infected, transiently NG2-glia-depleted COCS at the end of the experiment. Nuclei were stained with DAPI (blue). c, Quantification of NG2 immunointensity and NeuN positive area shown in b. NeuN: n = 20 slices for NBH + DMSO and NBH + CP673451; n = 28 slices for Prion+DMSO; n = 31 slices for Prion+CP673451. NG2: n = 12 slices for NBH + DMSO; n = 16 slices for Prion+DMSO, NBH + CP673451 and Prion+CP673451. Data are presented as mean ± SEM. One-way ANOVA with Benjamini-Hochberg FDR adjustment for multiple comparisons. NeuN: P = 0.1057 (NBH + DMSO vs. NBH + CP673451); P < 0.0001 (NBH + DMSO vs. Prion+DMSO); P < 0.0001 (Prion+DMSO vs. Prion+CP673451). NG2: P = 0.0690 (NBH + DMSO vs. NBH + CP673451); P < 0.0001 (NBH + DMSO vs. Prion+DMSO); P = 0.6641 (Prion+DMSO vs. Prion+CP673451). Source data
Extended Data Fig. 3
Extended Data Fig. 3. Early NG2 glia depletion accelerates prion disease in male but not female mice.
a, Experimental design of NG2 glia depletion in prion inoculated PdgfrαiDTR mice. Littermate Pdgfrα-CreER and iDTR mice were pooled together as control (Ctrl) and treated with tamoxifen and DT the same way as the PdgfrαiDTR mice. b, Survival curves showing accelerated prion disease in male, but not female NG2-glia-depleted (PdgfrαiDTR) mice compared to NG2 glia intact (Ctrl) mice after prion inoculation (median survival: 180 days for male PdgfrαiDTR mice; 187.5 days for male control mice; 174 days for female PdgfrαiDTR mice; 177 days for female control mice). Male mice: n = 8 for Ctrl; n = 9 for PdgfrαiDTR. Female mice: n = 8 for Ctrl; n = 5 for PdgfrαiDTR. Log-rank test: P = 0.0123 for male: P = 0.3571 for female. Source data
Extended Data Fig. 4
Extended Data Fig. 4. NG2 glia depletion does not influence brain vacuolation in prion-inoculated mice.
HE staining of brain tissues of NG2-glia-depleted (PdgfrαiDTR) and NG2 glia intact (Ctrl) mice after prion inoculation indicating similar vacuolation in different brain regions. NG2 glia depletion was induced at 16 wpi. Same staining was repeated independently in more than 3 mice for each group with similar results.
Extended Data Fig. 5
Extended Data Fig. 5. Loss of NG2 glia does not alter PrPC expression, prion replication, and prion-induced neuroinflammation.
a-b, Western blots (a) and quantification (b) showing no changes of PrPC level in NG2-glia-depleted (CP673451) Tga20 COCS compared to NG2 glia intact (DMSO) Tga20 COCS. n = 5 samples for DMSO and n = 4 samples for CP673451. Data are presented as mean ± SEM. Unpaired t test (two-sided): P = 0.1231. c-d, Western blots (c) and quantification (d) showing no changes of PK-resistant PrPSc levels in NG2-glia-depleted (CP673451) Tga20 COCS compared to NG2 glia intact (DMSO) Tga20 COCS after prion infection. n = 5 samples for DMSO and n = 4 samples for CP673451. Data are presented as mean ± SEM. Unpaired t test (two-sided): P = 0.3190. e-f, Western blots (e) and quantification (f) showing no changes of PrPC levels in the brains of NG2-glia-depleted (PdgfrαiDTR) mice compared to NG2 glia intact (Ctrl) mice. n = 4 mice for Ctrl and n = 5 mice for PdgfrαiDTR. Data are presented as mean ± SEM. Unpaired t test (two-sided): P = 0.1274. g-h, Western blots (g) and quantification (h) showing no changes of PK-resistant PrPSc levels in the brains of NG2-glia-depleted (PdgfrαiDTR) mice compared to NG2 glia intact (Ctrl) mice after prion infection. NG2 glia depletion was induced at 16 wpi. n = 4 mice for Ctrl and n = 5 mice for PdgfrαiDTR. Data are presented as mean ± SEM. Unpaired t test (two-sided): P = 0.8643. i-j, Cd68 immunofluorescence (i) and quantification (j) showing similar levels of microglia activation in NG2-glia-depleted (CP673451) Tga20 COCS compared to NG2 glia intact (DMSO) Tga20 COCS after prion infection. Nuclei were stained with DAPI (blue). n = 20 slices for NBH + DMSO and Prion+CP673451; n = 17 slices for Prion+DMSO; n = 19 slices for NBH + CP673451. Data are presented as mean ± SEM. One-way ANOVA with Benjamini-Hochberg FDR adjustment for multiple comparisons: P = 0.9795 (NBH + DMSO vs. NBH + CP673451); P < 0.0001 (NBH + DMSO vs. Prion+DMSO); P = 0.5088 (Prion+DMSO vs. Prion+CP673451). k-l, Iba1 and Cd68 immunofluorescence (k) and quantification (l) showing similar levels of microglia activation in the hippocampi of NG2-glia-depleted (PdgfrαiDTR) mice compared to NG2 glia intact (Ctrl) mice after prion infection. NG2 glia depletion was induced at 16 wpi. Nuclei were stained with DAPI (blue). n = 6 mice/group. Data are presented as mean ± SEM. Unpaired t test (two-sided): P = 0.7170 (Iba1); P = 0.8422 (Cd68). m, qRT-PCR results showing minimal changes of proinflammatory factors TNFα, IL1β and IL12β in NG2-glia-depleted (CP673451) Tga20 COCS compared to NG2 glia intact (DMSO) Tga20 COCS after prion infection. n = 6 samples/condition. Data are presented as mean ± SEM. Unpaired t test (two-sided): P = 0.0022 (TNFα); P = 0.3561 (IL1β); P = 0.7870 (IL12β). n, qRT-PCR results showing no changes of proinflammatory factors TNFα, IL1β and IL12β in the brains of NG2-glia-depleted (PdgfrαiDTR) mice compared to NG2 glia intact (Ctrl) mice after prion inoculation. n = 5 mice/group. NG2 glia depletion was induced at 16 wpi. Data are presented as mean ± SEM. Unpaired t test (two-sided): P = 0.1904 (TNFα); P = 0.8378 (IL1β); P = 0.8608 (IL12β). Source data
Extended Data Fig. 6
Extended Data Fig. 6. NG2 glia depletion does not influence Cox1 and Ptgds expression.
qRT-PCR results showing no changes of Cox1 and Ptgds in NG2-glia-depleted (CP673451) Tga20 COCS compared to NG2 glia intact (DMSO) Tga20 COCS in the presence or absence of prions. n = 7 samples/condition. Data are presented as mean ± SEM. Multiple unpaired t tests with Benjamini-Hochberg FDR adjustment for multiple comparisons. Cox1: P = 0.1426 (NBH + DMSO vs. NBH + CP673451); P = 0.3797 (Prion+DMSO vs. Prion+CP673451). Ptgds: P = 0.6933 (NBH + DMSO vs. NBH + CP673451); P = 0.2202 (Prion+DMSO vs. Prion+CP673451). Source data
Extended Data Fig. 7
Extended Data Fig. 7. Cell-cell communications from NG2 glia to microglia in the hippocampus of prion-inoculated mice.
a, UMAP of single-cell RNA-seq data showing Cox2+ and Ptges+ microglia among total microglia in the hippocampus of prion- or NBH-inoculated mice. b, Quantification of Cox2+ and Ptges+ microglia fractions against total microglia in the hippocampus of prion- or NBH-inoculated mice shown in a. n = 2 mice for NBH and n = 7 mice for Prion. Data are presented as mean ± SEM. Unpaired t test (two-sided): P = 0.0216 (Cox2+ microglia); P = 0.0116 (Ptges+ microglia). c, Venn diagram showing numbers of shared and distinct DEGs of Cox2+ and Ptges+ microglia in the hippocampus of prion-inoculated mice. d, Heatmap showing downregulation of homeostatic microglia signature genes and upregulation of DAM and MHC-II microglia signature genes as well as inflammatory genes in Cox2+ and Ptges+ microglia in the hippocampus of prion-inoculated mice. e, CellChat analysis of cell-cell communications showing unaltered number of interactions (plotted as the thickness of the edges) but reduced strength of interactions (plotted as the thickness of the edges) from NG2 glia to Cox2+ microglia in the hippocampus of prion-inoculated mice. f, Heatmaps showing significantly weakened NG2 glia to Cox2+ microglia interaction pathways in the hippocampus of prion-inoculated mice. Source data
Extended Data Fig. 8
Extended Data Fig. 8. Purity of primary microglia cultures.
a, Iba1 immunofluorescence showing high purity of primary microglia cultures isolated by Cd11b immunopanning. Nuclei were stained with DAPI (blue). b, Quantification of Iba1+ cell percentage shown in a. n = 5 independent experiments. Data are presented as mean ± SEM. Source data
Extended Data Fig. 9
Extended Data Fig. 9. Expression of PGE2 receptors in neurons.
a, Immunofluorescence of NeuN and PGE2 receptors in the cerebral cortex showing neuronal expression of Ptger1, Ptger2, Ptger3 and Ptger4 in the adult mouse brain. Scale bar: 50 μm. Same staining was repeated independently in more than 3 mice with similar results. b, Immunofluorescence showing expression of Ptger1, Ptger2, Ptger3 and Ptger4 in primary neuronal cultures (3 weeks in vitro). Ptger2 is mainly located in the neuronal cell body; Ptger1, Ptger3 and Ptger4 are located in both the neuronal cell body and neuronal processes. Scale bar: 50 μm. Same staining was repeated independently in more than 3 batches of primary neuron preparations with similar results.
Extended Data Fig. 10
Extended Data Fig. 10. Activation of Ptger1 does not influence prion neurotoxicity in primary neuronal cultures and Tga20 COCS.
a, Immunofluorescence of NeuN, Map2 and Tau showing cellular damage of primary neurons treated with high concentration of Ptger4 agonist L902688. b, Quantification of neuronal density as well as Map2 positive and Tau positive areas shown in a. n = 6 independent experiments. Data are presented as mean ± SEM. Unpaired t test (two-sided): P = 0.0001 (NeuN); P < 0.0001 (Map2); P < 0.0001 (Tau). c, Immunofluorescence of NeuN, Map2 and Tau showing no damage of prion-infected primary neurons treated with different concentrations of Ptger1 agonist 17-pt-PGE2. d, Quantification of neuronal density as well as Map2 positive and Tau positive areas shown in c. n = 6 independent experiments. Data are presented as mean ± SEM. One-way ANOVA with Benjamini-Hochberg FDR adjustment for multiple comparisons. NeuN: P = 0.9792 for 1 μM vs. 0 μM, 5 μM vs. 0 μM, and 10 μM vs. 0 μM. Map2: P = 0.9445 for 1 μM vs. 0 μM, 5 μM vs. 0 μM, and 10 μM vs. 0 μM. Tau: P = 0.9165 for 1 μM vs. 0 μM, 5 μM vs. 0 μM, and 10 μM vs. 0 μM. e-f, NeuN immunofluorescence (e) and quantification (f) showing no change of prion-induced neurodegeneration in 17-pt-PGE2-treated Tga20 COCS. n = 10 slices/condition. Data are presented as mean ± SEM. One-way ANOVA with Benjamini-Hochberg FDR adjustment for multiple comparisons: P = 0.9799 for NBH + 0 μM vs. NBH + 1 μM, NBH + 0 μM vs. NBH + 5 μM, Prion+0 μM vs. Prion+1 μM, and Prion+0 μM vs. Prion+5 μM. P < 0.0001 for NBH + 0 μM vs. Prion+0 μM. Source data

References

    1. Wareham, L. K. et al. Solving neurodegeneration: common mechanisms and strategies for new treatments. Mol. Neurodegener.17, 23 (2022). - PMC - PubMed
    1. Liu, Y. & Aguzzi, A. Immunotherapy for neurodegeneration? Science364, 130–131 (2019). - PubMed
    1. Aguzzi, A. & Liu, Y. A role for astroglia in prion diseases. J. Exp. Med.214, 3477–3479 (2017). - PMC - PubMed
    1. Brandner, S. & Jaunmuktane, Z. Prion disease: experimental models and reality. Acta Neuropathol.133, 197–222 (2017). - PMC - PubMed
    1. Mathys, H. et al. Single-cell transcriptomic analysis of Alzheimer’s disease. Nature570, 332–337 (2019). - PMC - PubMed

LinkOut - more resources