. 2024 Jul;31(7):881-896.
doi: 10.1038/s41418-024-01310-9. Epub 2024 May 28.

HSP70-mediated mitochondrial dynamics and autophagy represent a novel vulnerability in pancreatic cancer

Affiliations

HSP70-mediated mitochondrial dynamics and autophagy represent a novel vulnerability in pancreatic cancer

Giulia D S Ferretti et al. Cell Death Differ. 2024 Jul.

Abstract

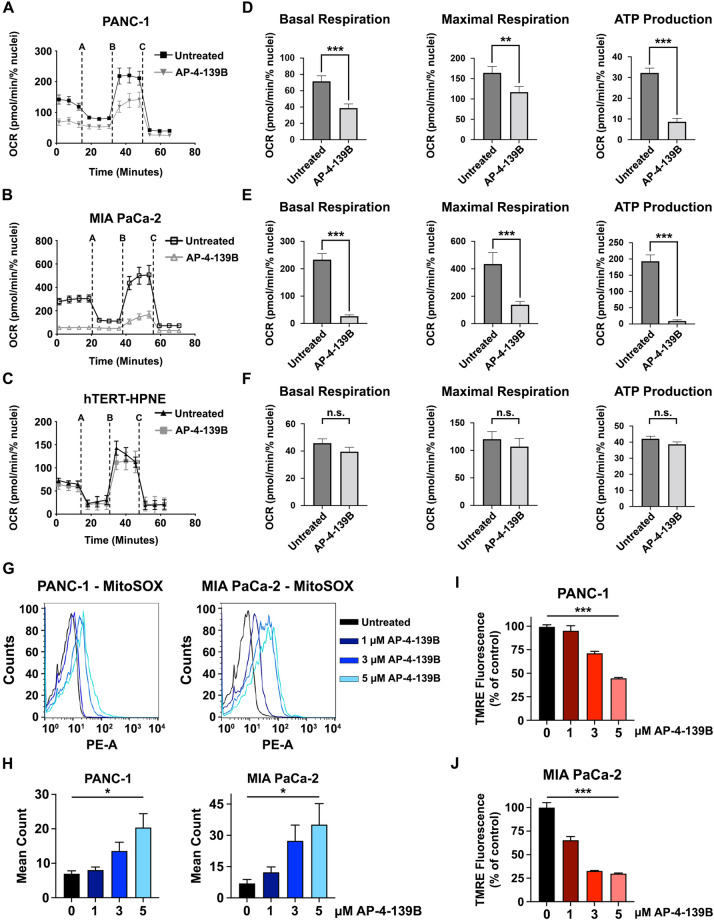
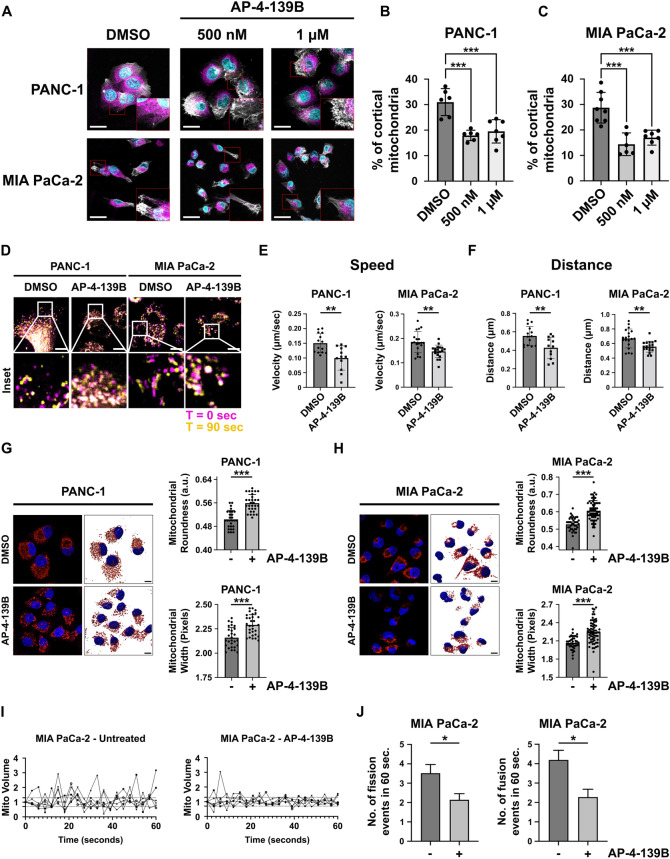
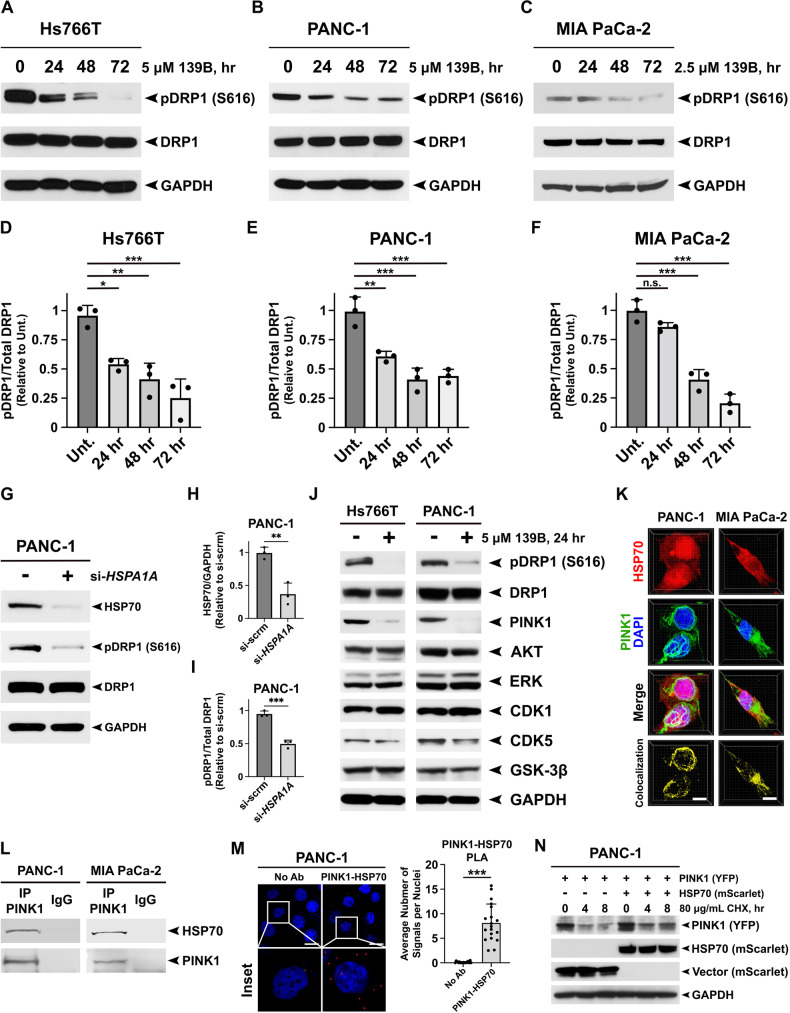
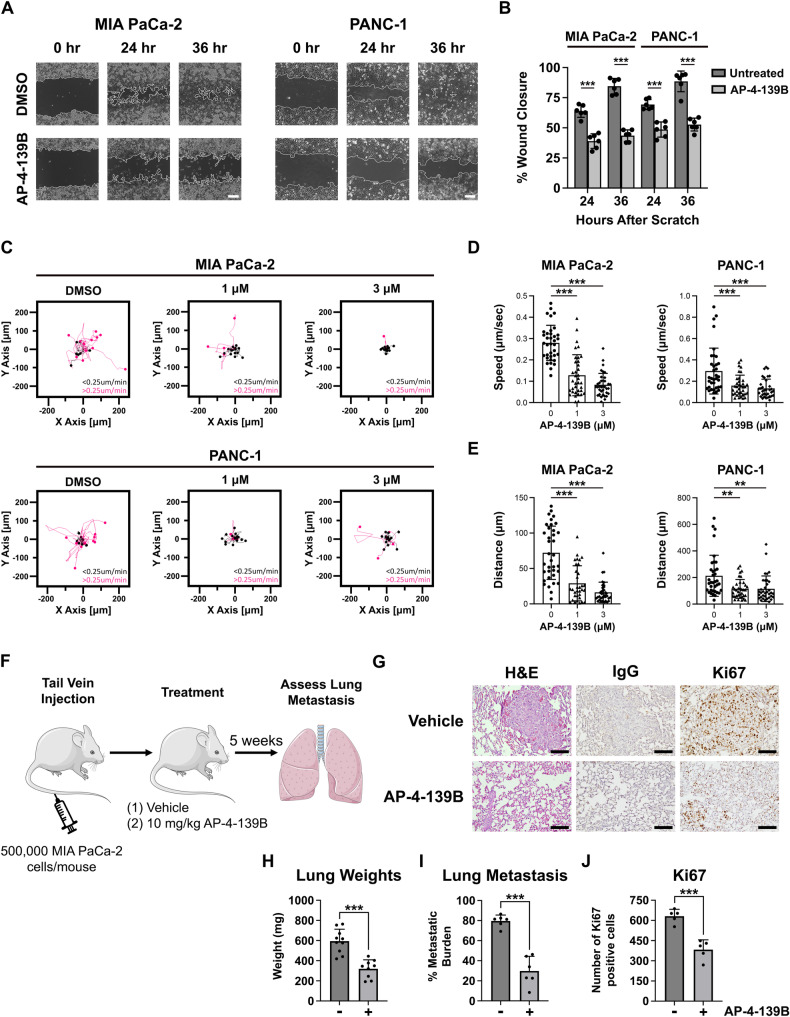
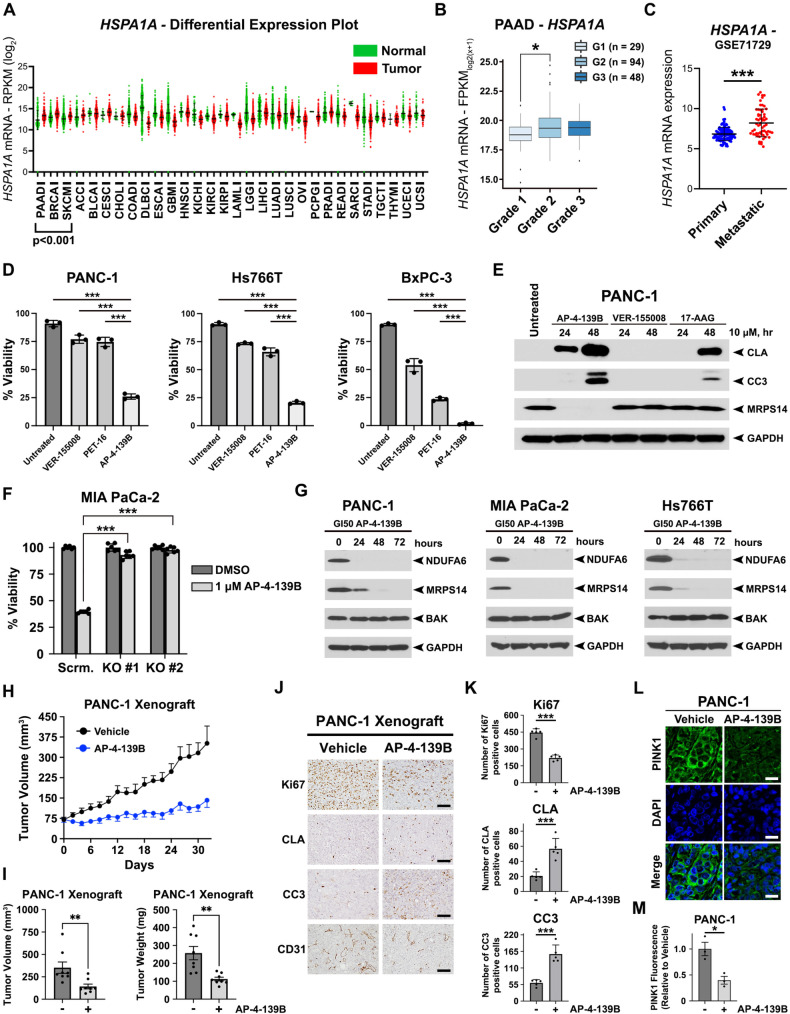
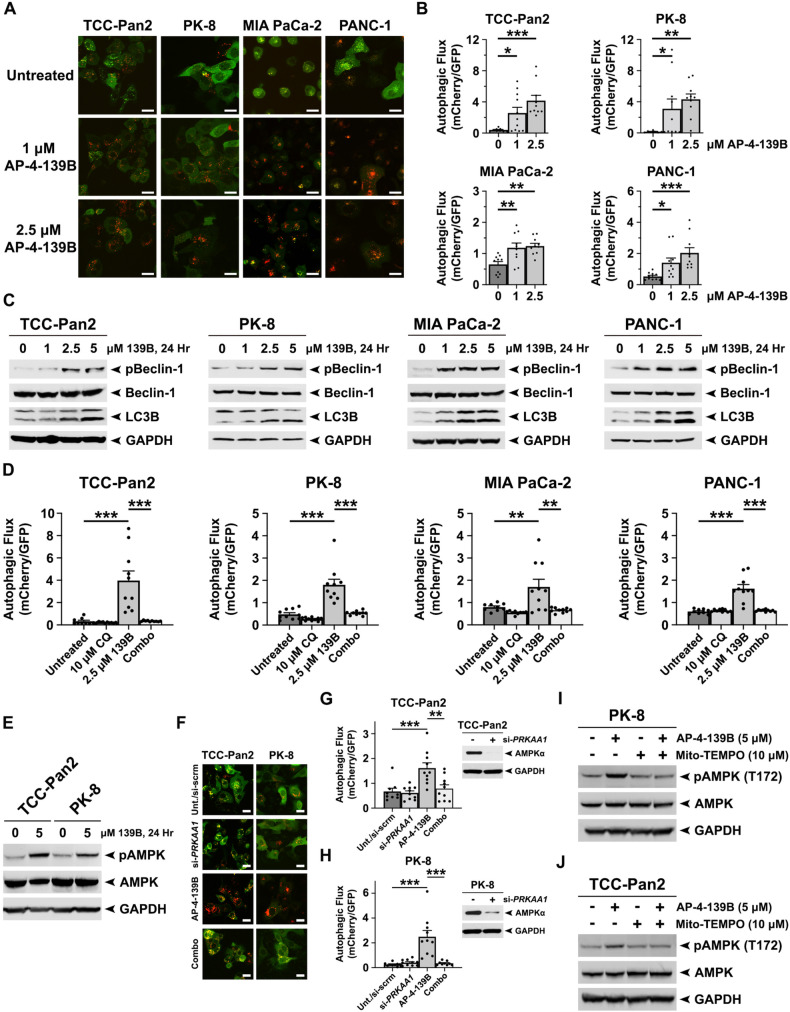
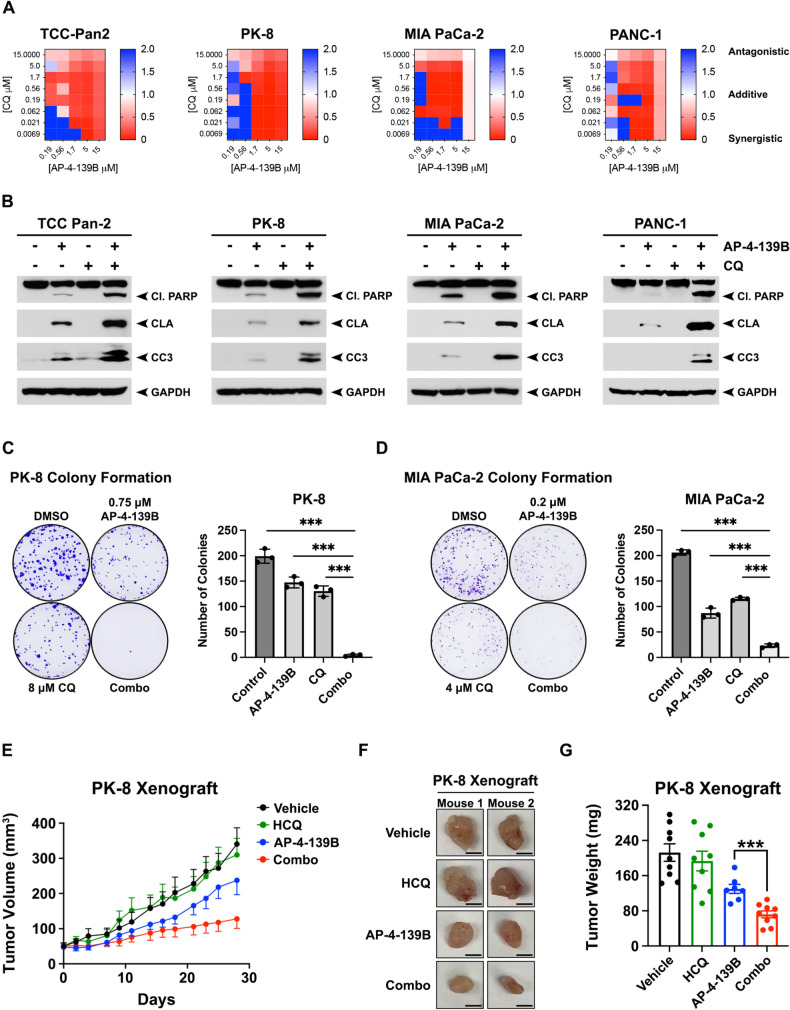
Pancreatic ductal adenocarcinoma (PDAC), the most prevalent type of pancreatic cancer, is one of the deadliest forms of cancer with limited therapy options. Overexpression of the heat shock protein 70 (HSP70) is a hallmark of cancer that is strongly associated with aggressive disease and worse clinical outcomes. However, the underlying mechanisms by which HSP70 allows tumor cells to thrive under conditions of continuous stress have not been fully described. Here, we report that PDAC has the highest expression of HSP70 relative to normal tissue across all cancers analyzed. Furthermore, HSP70 expression is associated with tumor grade and is further enhanced in metastatic PDAC. We show that genetic or therapeutic ablation of HSP70 alters mitochondrial subcellular localization, impairs mitochondrial dynamics, and promotes mitochondrial swelling to induce apoptosis. Mechanistically, we find that targeting HSP70 suppresses the PTEN-induced kinase 1 (PINK1) mediated phosphorylation of dynamin-related protein 1 (DRP1). Treatment with the HSP70 inhibitor AP-4-139B was efficacious as a single agent in primary and metastatic mouse models of PDAC. In addition, we demonstrate that HSP70 inhibition promotes the AMP-activated protein kinase (AMPK) mediated phosphorylation of Beclin-1, a key regulator of autophagic flux. Accordingly, we find that the autophagy inhibitor hydroxychloroquine (HCQ) enhances the ability of AP-4-139B to mediate anti-tumor activity in vivo. Collectively, our results suggest that HSP70 is a multi-functional driver of tumorigenesis that orchestrates mitochondrial dynamics and autophagy. Moreover, these findings support the rationale for concurrent inhibition of HSP70 and autophagy as a novel therapeutic approach for HSP70-driven PDAC.


Conflict of interest statement

JMS owns equity in Alliance Discovery, Inc., Barer Institute, Context Therapeutics, and consults for Syndeavor Therapeutics. OS is the co-founder of OncoCube Therapeutics LLC, and the founder and president of LoxiGen, Inc. All other authors have no competing interests.

Figures

Fig. 1
Fig. 1. HSP70 inhibition impairs mitochondrial function and induces ROS.
AC Mitochondrial oxygen consumption rates (OCR) were measured in pancreatic cancer cell lines (PANC-1 and MIA PaCa-2), as well as non-transformed pancreatic ductal cells (hTERT-HPNE), in the presence or absence of 500 nM of HSP70i (AP-4-139B). All experiments were performed in triplicate, with each group containing 8–10 technical replicates. DF Basal oxygen consumption rates (OCR), maximal respiration, and ATP production were analyzed and quantified in the presence or absence of 500 nM AP-4-139B. **p < 0.01, ***p < 0.001, n.s. not significant. GH PANC-1 and MIA PaCa-2 cells were treated with the indicated doses of AP-4-139B for 48 h. Cells were then incubated with MitoSOX-Green, harvested, and analyzed by flow cytometry to determine mitochondrial ROS production. Fluorescence mean was analyzed and plotted on a histogram. *p < 0.05; n = 3 independent experiments. PANC-1 (I) and MIA PaCa-2 (J) cells were treated with the indicated doses of AP-4-139B for 24 h. Cells were then stained with 50 nM of TMRE for 30 min, and fluorescence intensity was measured using a plate reader. Shown are representative data of two independent experiments, with each condition containing six technical replicates. ***p < 0.001.
Fig. 2
Fig. 2. HSP70 inhibition affects mitochondrial subcellular localization and dynamics.
A PANC-1 and MIA PaCa-2 cells were treated with 500 nM or 1 μM of AP-4-139B for 24 h and the percentage of cortical mitochondria were analyzed. Shown are representative images of mitochondria that were labeled with 100 nM MitoTracker deep red FM dye (magenta), while actin filaments were stained with phalloidin (white) and nuclei stained with Hoechst (cyan). Six to eight images were taken per experimental group via confocal microscopy at 40X magnification. Bar scale: 25 µm. B, C Quantification of (A); ***p < 0.001. D PANC-1 and MIA PaCa-2 cells were treated with 500 nM of AP-4-139B for 24 h and were analyzed for mitochondrial motility by time-lapse video-microscopy. Magenta = 0 seconds, yellow = 90 seconds, white = overlap. Bar scale: 10 µm. E, F. Quantification of (D); mitochondrial motility was measured and the speed (E) and the distance (F) of each mitochondrion were analyzed. 12-19 individual mitochondria were analyzed per treatment group for each cell line; **p < 0.01. G, H. PANC-1 (left) and MIA PaCa-2 (right) cells were treated with 2 μM AP-4-139B for 24 h, and were then stained with MitoTracker Red. Mitochondrial morphologies were 3D surfaced mapped using Imaris software. Bar scale: 10 µm; n = 2 biological replicates. To the right of each representative images are the quantification of mitochondrial roundness and width; ***p < 0.001. I MIA PaCa-2 cells were treated with 500 nM AP-4-139B for 24 h followed by staining with MitoTracker Deep Red. Time-lapse video-microscopy was performed by acquiring images every 3 s for a 1-min interval and change in mitochondrial volume over time was measured. n = 2 independent biological replicates, with six single cells imaged for each experimental condition. J Quantification of mitochondrial fission (<0.7-fold mitochondrial volume) and fusion (>1.3-fold mitochondrial volume) events in a 1-min time interval. *p < 0.05. Data are shown as mean ± SD.
Fig. 3
Fig. 3. Genetic or therapeutic ablation of HSP70 impairs the PINK1-mediated phosphorylation of DRP1 at serine 616.
AC Hs766T, PANC-1, and MIA PaCa-2 cells were treated with the indicated doses of AP-4-139B and harvested every 24 h for 72 h. Cell lysates were subjected to Western blot analysis and immunoblotted for phospho-DRP1 (S616), total DRP1, and GAPDH (loading control). DF Quantification of (AC) was performed by obtaining the density of the phospho-DRP1 bands using ImageJ software and normalizing to total DRP1 levels. *p < 0.05, **p < 0.01, ***p < 0.001, n.s. not significant. Shown are quantification of three independent experiments. G PANC-1 cells were transfected with a pool of HSPA1A siRNA and were harvested 48 h later. Cell lysates were subjected to Western blot analysis and immunoblotted for phospho-DRP1 (S616), total DRP1, HSP70 and GAPDH (loading control). H, I Quantification of (G) was performed by obtaining the density of the phospho-DRP1 bands using ImageJ software and normalizing to total DRP1 levels. Quantification of HSP70 was normalized to GAPDH. **p < 0.01, ***p < 0.001. Shown are quantification of three independent experiments. J Hs766T and PANC-1 cells were treated with 5 μM AP-4-139B for 24 h. Cell lysates were subjected to Western blot analysis and immunoblotted for phospho-DRP1 (S616), DRP1, PINK1 (mature form), AKT, ERK, CDK1, CDK5, GSK-3β, and GAPDH (loading control). n = 3 independent experiments. K Co-immunofluorescence (Co-IF) analysis of PANC-1 and MIA PaCa-2 cells immunostained with HSP70 and PINK1, followed by fluorescent secondary staining along with DAPI (blue). Three-dimensional (3D) images were generated using Imaris imaging analysis software. n = 3 independent experiments. Bar scale: 10 µm. L Lysates from PANC-1 and MIA PaCa-2 cells were immunoprecipitated with IgG or anti-PINK1 antibodies and probed for HSP70. M Proximity Ligation Assays (PLA) for HSP70-PINK1 complexes in PANC-1 cells. Individual HSP70-PINK1 interactions are visualized by fluorescent signal (red) with nuclei counterstained with DAPI. Right; quantification of the HSP70-PINK1 interactions measured as the average number of PLA signals per nuclei from over 100 cells analyzed from random fields. n = 2 independent experiments. ***p < 0.001. Bar scale: 20 µm. N PANC-1 cells were transfected with a PINK1-YFP plasmid in the presence or absence of mScarlet-HSP70 plasmid for 48 h. Cells were then treated with 80 µg/mL of cycloheximide (CHX) and lysed at the indicated times following the addition of CHX. Protein levels of PINK1 and HSP70 were measured by Western blot analysis. GAPDH was used as a loading control.
Fig. 4
Fig. 4. HSP70 inhibition limits PDAC cell migration in vitro and metastasis in vivo.
A Primary (PANC-1) and metastatic (MIA PaCa-2) PDAC cells were seeded and allowed to form a confluent monolayer. Cells were scratched with a pipet tip and treated with DMSO or AP-4-139B and then imaged at 0, 24 and 36 h. Bar scale: 250 µm. B Quantification of the percentage of wound closure in (A) had 0, 24, and 36 h in DMSO versus AP-4-139B treated cells. The data depicted represent one representative containing data from three independent wells from a single experiment. n = 3 independent experiments; ***p < 0.001. C PANC-1 and MIA PaCa-2 cells were treated with the indicated doses of AP-4-139B for 24 h and were then analyzed for single-cell motility by time-lapse video-microscopy in 2D contour plots. The cutoff velocities for slow moving (black) or fast-moving (pink) cells are indicated. Quantification of the average speed of cell movements (D) and total distance traveled by individual cells (E). The mean ± SD speed of cell motility (µm/min), distance traveled (µm), and p values are indicated (n= approximately 35 cells per condition tested). **p < 0.01, ***p < 0.001. F Schematic representation of the metastasis assay. MIA PaCa-2 cells (5 × 105) cells were injected into the tail vain of 8- to 10-week-old female NSG mice. Mice were treated with intraperitoneal (i.p.) injection of 10 mg/kg AP-4-139B every 48 h. After 5 weeks, the lungs of mice were formalin-fixed, and H&E stained and assessed for the presence of metastatic nodules. G Representative H&E and Ki67 images of lung metastases from NSG mice injected with MIA PaCa-2 cells in the tail vein, followed by treatment with vehicle or AP-4-139B. Bar scale: 100 µm. Rabbit IgG was used as a negative control for IHC analysis. Quantification of lung weights, metastatic burden, and Ki67 staining. Quantification of (H) was performed on all mice in the study, while quantification of (I, J) was performed on n = 5-6 mice per treatment group.
Fig. 5
Fig. 5. Single agent efficacy of AP-4-139B in PDAC cells and xenograft models.
A Differential plots of HSPA1A between tumor and normal tissues of TCGA patients represented as reads per kilobase million (RPKM; log2) values. P < 0.001 where indicated. B Association of HSPA1A gene expression and tumor grade of pancreatic adenocarcinoma (PAAD; n = 171). ANOVA with post hoc Tukey pairwise comparison was used to determine significance. p = 0.017. C Association of HSPA1A gene expression in metastatic pancreatic cancer as compared to primary pancreatic tumors. ***p < 0.001. D PANC-1, Hs776, and BxPC-3 cells were treated with 10 µM of VER-155008, PET-16, or AP-4-139B for 48 h. Cells were then subjected to viability assays using trypan blue exclusion. ***p < 0.001. n = 3 independent experiments. E PANC-1 cells were treated with 10 µM of the indicated compounds and lysed at the indicated time points. Cell lysates were prepared for Western blot analysis and immunoblots were probed for CLA, CC3, MRPS14 and GAPDH (control). F Control (sg-scrambled) and two independent clones of HSP70 KO MIA PaCa-2 cells were treated with 1 µM AP-4-139B for 72 h and subjected to cell viability assays using Alamar Blue. Shown is a representative graph with six technical replicates per experimental group. n = 2 independent experiments. ***p < 0.001. G PANC-1, MIA PaCa-2, and Hs766T cells were treated with the respective GI50 values of AP-4-139B for the indicated time points. Cell lysates were subjected to Western blot analysis and immunoblotted for NDUFA6, MRPS14, BAK, and GAPDH (loading control). H PANC-1 cells were injected subcutaneously into the right flank of NSG mice. Once tumors reached an approximate volume of 75 mm3, mice were separated randomly into two groups. Mice were treated with either vehicle control or 10 mg/kg AP-4-139B every other day. Tumor volumes were measured over time using digital calipers. n = 8 mice per group; ***p < 0.001. I Quantification of tumor volume (left) and tumor weight (right) at endpoint; **p < 0.01. J IHC analysis of PANC-1 xenograft tumors treated with AP-4-139B. Shown are representative images (five random fields of view per condition) of Ki67, Cleaved Lamin A, Cleaved Caspase 3, and CD31. n = 5 mice per group. Bar scale: 100 µm. K Quantification of (J); ***p < 0.001. L Immunofluorescence analysis of PINK1 (green) was performed on PANC-1 xenograft tumors, counterstained with DAPI (blue). n = 3 mice per group. Bar scale: 20 µm. M Quantification of (L). Each data point represents an individual tumor, for which an average of six random images were taken and quantified. *p < 0.05.
Fig. 6
Fig. 6. Pharmacological inhibition of HSP70 increases autophagic flux in PDAC cells.
A Four PDAC cell lines (TCC Pan-2, PK-8, MIA PaCa-2, and PANC-1) were stably infected with a lentiviral vector encoding mCherry-EGFP-LC3B and then treated with the indicated doses of AP-4-139B for 6 h followed by confocal microscopy of EGFP+ and mCherry+ punctae. Shown are representative confocal images of merged EGFP and mCherry fluorescence that were used to quantify the autophagic index. Bar scale: 20 µm. B Quantification of (A). To quantify autophagic flux, the area ratios of mCherry-positive punctae to GFP-positive punctae (autophagic index) were determined. Mean autophagic index is plotted, with each individual data point representing one field of view (10 fields were analyzed per experimental group). n = 3 independent experiments. *p < 0.05, **p < 0.01, ***p < 0.001. C PDAC cell lines were treated with the indicated doses of AP-4-139B, or “139B,” for 24 h to assess autophagic flux. Immunoblot analysis of cell lysates were done to determine the levels of LC3B, phospho-Beclin-1 (S93), total Beclin-1, and GAPDH (loading control). Data are representative of three independent experiments. D PDAC cell lines were pre-treated with 10 µM of the autophagy inhibitor Chloroquine (CQ) overnight. The next morning, cells were treated with 2.5 µM AP-4-139B for 6 h, and then mean autophagic index was determined as in (B). Data are representative of two independent experiments, with each individual data point representing one field of view (9-10 fields were analyzed per experimental group). **p < 0.01, ***p < 0.001. E. TCC-Pan2 and PK-8 were treated with 5 µM AP-4-139B for 24 h. Immunoblot analysis of cell lysates were performed to determine the levels of phospho-AMPK (T172), total AMPK, and GAPDH (loading control). n = 2 independent experiments. F TCC-Pan2 and PK-8 stably expressing mCherry-EGFP-LC3B were transfected with a pool of PRKAA1 siRNA. 48 h later, cells were treated with 2.5 µM AP-4-139B for 6 h followed by confocal microscopy of EGFP+ and mCherry+ punctae. Shown are representative confocal images of merged EGFP and mCherry fluorescence that were used to quantify the autophagic index. Bar scale: 20 µm. G, H. Quantification of (F) was performed as in (B), with each individual data point representing one field of view (9-10 fields were analyzed per experimental group). n = 2 independent experiments. **p < 0.01, ***p < 0.001. Shown to the right are Western blot analyses of AMPK and GAPDH (loading control). I, J. PK-8 and TCC-Pan2 cells were pre-treated with 10 µM of the mitochondrial ROS scavenger Mito-TEMPO for 3 h, at which point cells were subsequently treated with 5 µM AP-4-139B for 24 h. Cell lysates were subjected to Western blot analysis and probed for phospho-AMPK (T172), total AMPK, and GAPDH (loading control). Shown are representative results of two independent experiments.
Fig. 7
Fig. 7. Dual inhibition of HSP70 and autophagy synergistically impairs the progression of PDAC.
A A panel (n = 4) of PDAC cell lines were treated for 72 h with HSP70i (AP-4-139B) and the autophagy inhibitor CQ at the indicated concentrations. Cells were stained for viability with Calcein and imaged via Celigo image cytometer. Cell numbers at endpoint were normalized to vehicle-treated control (100% growth) for each cell line. Heatmaps representing BLISS independence scores corresponding using proliferation indices for each condition. Scores <1 indicate synergy (red), score = 1 indicated additivity (white), and scores >1 indicate antagonism (blue). n = 3 independent experiments. B PDAC cells (TCC Pan-2, PK-8, MIA PaCa-2) were treated with 5 µM AP-4-139B, 5 µM Chloroquine (CQ), or the combination of the two drugs for 48 h; PANC-1 cells were treated with 7.5 µM of AP-4-139B (139B) and CQ. Lysates were extracted and analyzed for Cleaved PARP (Cl. PARP), Cleaved Lamin A (CLA), and Cleaved Caspase 3 (CC3). GAPDH was used as a loading control. C, D PK-8 and MIA PaCa-2 cells were treated with the indicated doses of AP-4-139B, CQ, or the combination of AP-4-139B and CQ and subjected to colony formation assays. Seven (MIA PaCa-2) to fourteen (PK-8) days later, cells were fixed and stained with 0.1% Crystal Violet. Quantification of each assay is shown to the right of each representative figure. Values shown represent n = 3 for each treatment group ± the SD. *p < 0.05, **p < 0.01, ***p < 0.001. E 5 × 106 PK-8 cells were subcutaneously injected into the flanks of NSG mice (n = 7–9 mice per group). Once tumors reached a size of approximately 50 mm3, mice were randomly assigned to each treatment group: Vehicle, AP-4-139B, Hydroxychloroquine (HCQ), or the combination (combo). Tumor growth was measured using digital calipers. F Images of representative tumors from PK-8 xenograft treatment groups in (E). G Quantification of PK-8 xenograft tumor weights at endpoint. P value is from two-sided, unpaired t-test comparing HSP70i treated to HSP70i plus HCQ treated tumors. Data are shown as mean ± SEM; sample sizes are as in (E).

References

    1. Jaattela M, Wissing D, Kokholm K, Kallunki T, Egeblad M. Hsp70 exerts its anti-apoptotic function downstream of caspase-3-like proteases. EMBO J. 1998;17:6124–34. doi: 10.1093/emboj/17.21.6124. - DOI - PMC - PubMed
    1. Murphy ME. The HSP70 family and cancer. Carcinogenesis. 2013;34:1181–8. doi: 10.1093/carcin/bgt111. - DOI - PMC - PubMed
    1. Leu JI, Barnoud T, Zhang G, Tian T, Wei Z, Herlyn M, et al. Inhibition of stress-inducible HSP70 impairs mitochondrial proteostasis and function. Oncotarget. 2017;8:45656–69. doi: 10.18632/oncotarget.17321. - DOI - PMC - PubMed
    1. Kumar S, Stokes J, 3rd, Singh UP, Scissum Gunn K, Acharya A, Manne U, et al. Targeting Hsp70: A possible therapy for cancer. Cancer Lett. 2016;374:156–66. doi: 10.1016/j.canlet.2016.01.056. - DOI - PMC - PubMed
    1. Daugaard M, Rohde M, Jaattela M. The heat shock protein 70 family: highly homologous proteins with overlapping and distinct functions. FEBS Lett. 2007;581:3702–10. doi: 10.1016/j.febslet.2007.05.039. - DOI - PubMed

MeSH terms

Substances