. 2024 May 28;23(1):113.
doi: 10.1186/s12943-024-02030-x.

CircPIAS1 promotes hepatocellular carcinoma progression by inhibiting ferroptosis via the miR-455-3p/NUPR1/FTH1 axis

Affiliations

CircPIAS1 promotes hepatocellular carcinoma progression by inhibiting ferroptosis via the miR-455-3p/NUPR1/FTH1 axis

Xiao-Yu Zhang et al. Mol Cancer. .

Abstract

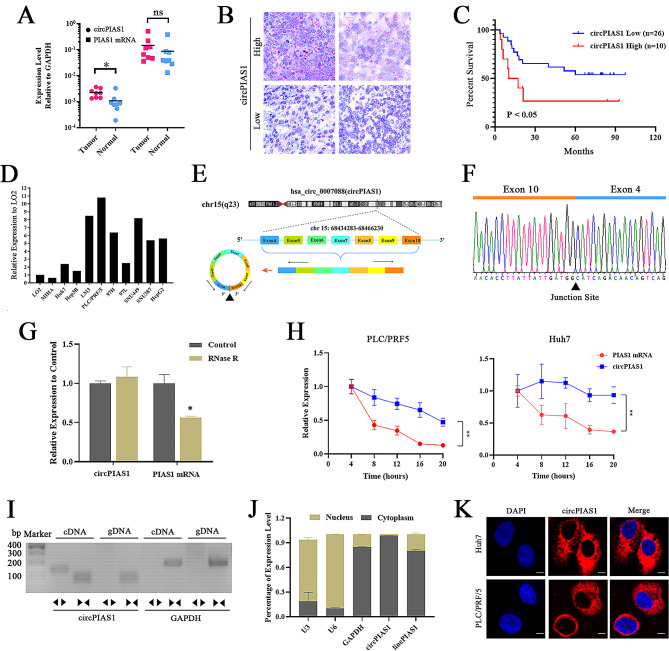
Background: The role of circRNAs in hepatocellular carcinoma (HCC) progression remains unclear. CircPIAS1 (circBase ID: hsa_circ_0007088) was identified as overexpressed in HCC cases through bioinformatics analysis. This study aimed to investigate the oncogenic properties and mechanisms of circPIAS1 in HCC development.

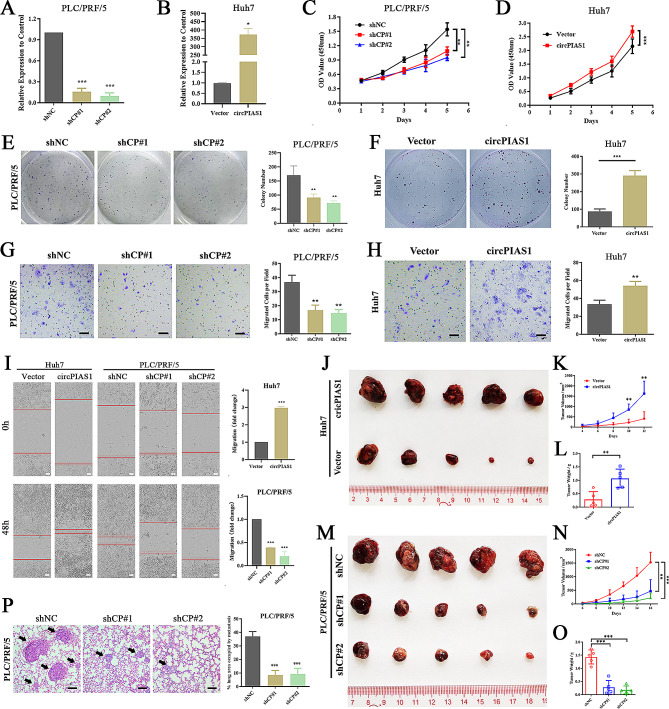
Methods: Functional analyses were conducted to assess circPIAS1's impact on HCC cell proliferation, migration, and ferroptosis. Xenograft mouse models were employed to evaluate circPIAS1's effects on tumor growth and pulmonary metastasis in vivo. Bioinformatics analysis, RNA immunoprecipitation, and luciferase reporter assays were utilized to elucidate the molecular pathways influenced by circPIAS1. Additional techniques, including RNA pulldown, fluorescence in situ hybridization (FISH), chromatin immunoprecipitation (ChIP), qPCR, and western blotting, were used to further explore the underlying mechanisms.

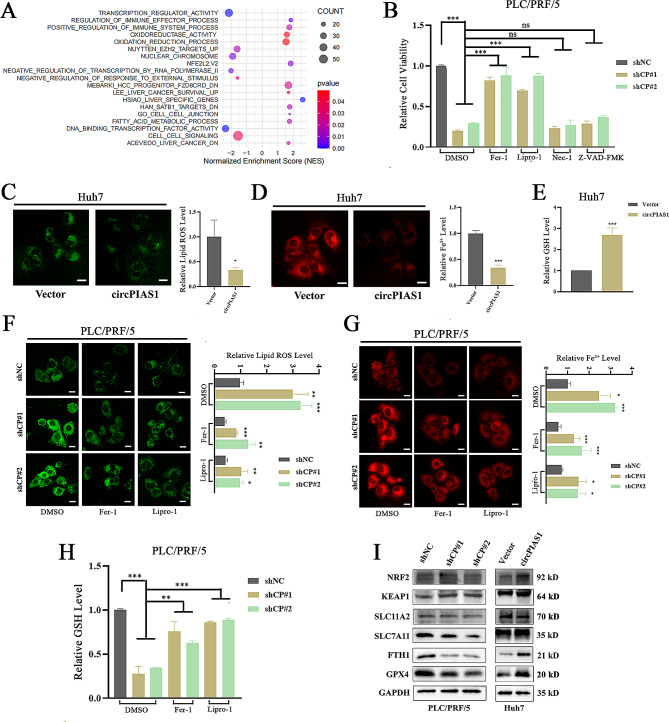
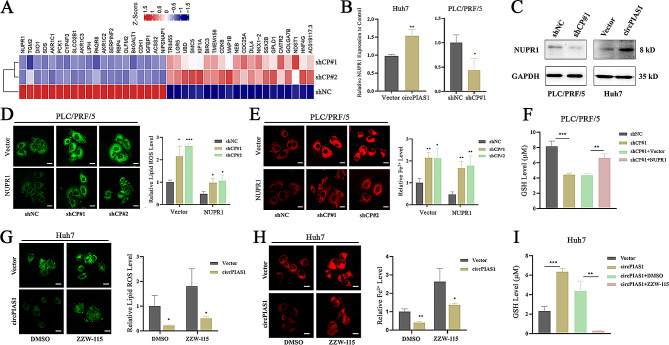
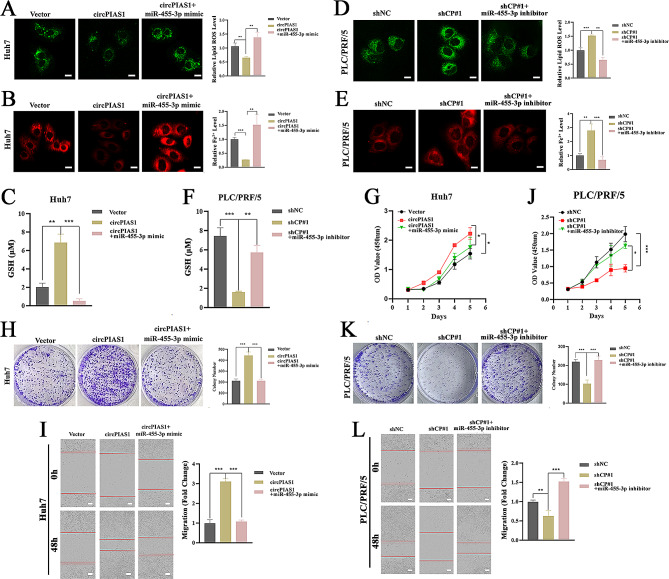
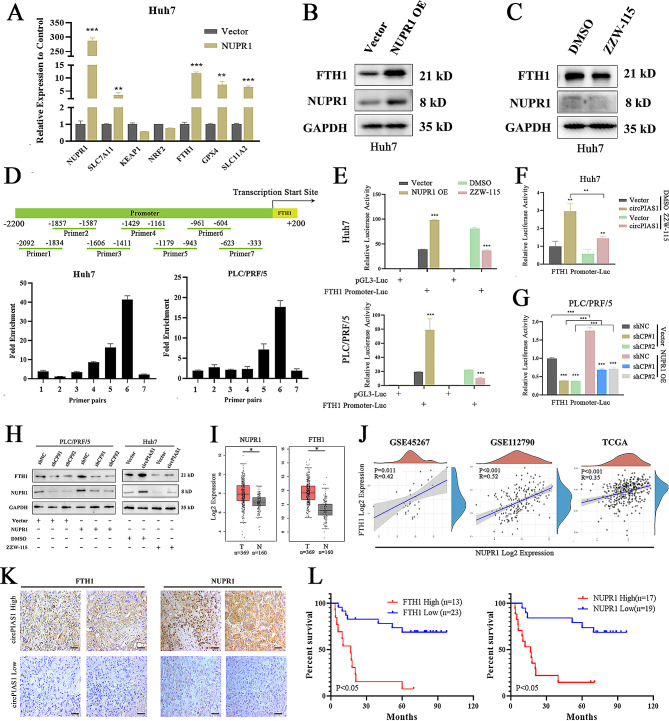
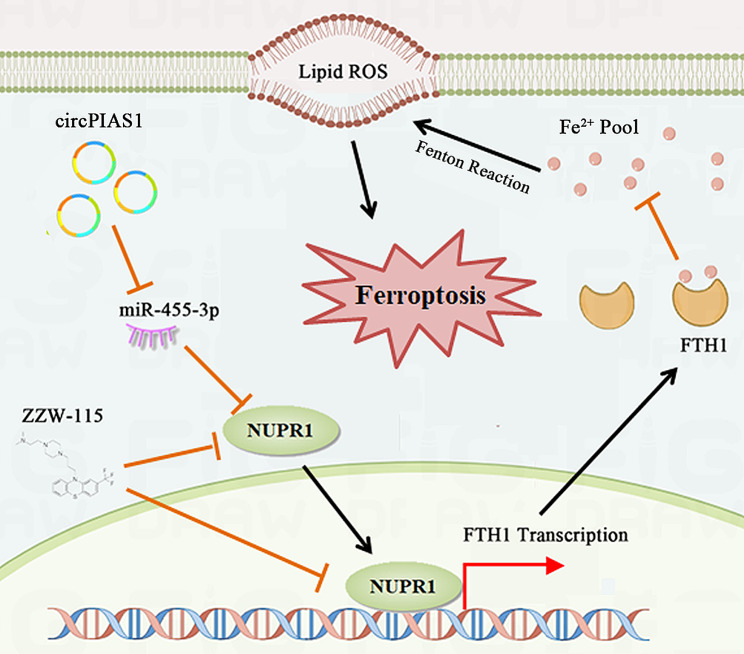
Results: CircPIAS1 expression was elevated in HCC tissues and cells. Silencing circPIAS1 suppressed HCC cell proliferation and migration both in vitro and in vivo. Mechanically, circPIAS1 overexpression inhibited ferroptosis by competitively binding to miR-455-3p, leading to upregulation of Nuclear Protein 1 (NUPR1). Furthermore, NUPR1 promoted FTH1 transcription, enhancing iron storage in HCC cells and conferring resistance to ferroptosis. Treatment with ZZW-115, an NUPR1 inhibitor, reversed the tumor-promoting effects of circPIAS1 and sensitized HCC cells to lenvatinib.

Conclusion: This study highlights the critical role of circPIAS1 in HCC progression through modulation of ferroptosis. Targeting the circPIAS1/miR-455-3p/NUPR1/FTH1 regulatory axis may represent a promising therapeutic strategy for HCC.

Keywords: Ferroptosis; Hepatocellular carcinoma; NUPR1; circPIAS1; miR-455-3p.


Conflict of interest statement

The authors have declared that no competing interest exists.

Figures

Fig. 1
Fig. 1
Expression and characterization of circPIAS1 in HCC. (A) Higher circPIAS1 expression in HCC tissues compared to normal tissues. (B) RNAScope assay images showing high and low circPIAS1 expression in HCC tissues. Scale bar = 200 µm. (C) Association of circPIAS1 expression with overall survival in HCC patients based on Kaplan-Meier analysis. (D) Elevated circPIAS1 expression in HCC cell lines compared to normal hepatic cells. (E) CircPIAS1 is derived from back-splicing of 4–10 exons of PIAS1 pre-mRNA. A black triangle indicates the“head-to-tail” splice junction site. (F) Confirmation of circPIAS1 back-splicing junction sequence by Sanger sequencing. (G) qPCR analysis of circPIAS1 and linear PIAS1 mRNA expressions with or without RNase R treatment for 30 min. (H) qPCR analysis of circPIAS1 and PIAS1 mRNA expressions in Huh7 and PLC/PRF/5 cells treated with actinomycin D (2 µg/mL) at the indicated time points. (I) RT-PCR analysis of circPIAS1 and linear PIAS1 mRNA using divergent and convergent primers in Huh7 cells. GAPDH acted as a control. (J) Subcellular localization of circPIAS1 in Huh7 cells assessed by qPCR analysis. (K) FISH assay demonstrating predominantly cytoplasmic localization of circPIAS1. Scale bar = 50 μm
Fig. 2
Fig. 2
CircPIAS1 promotes HCC cell proliferation and migration in vitro and in vivo. (A) qPCR analysis of circPIAS1 expression in PLC/PRF/5 cells treated with circPIAS1 shRNAs. (B) qPCR analysis of circPIAS1 expression in Huh7 cells after circPIAS1 overexpression. (C-D) CCK-8 assays assessing cell proliferation in circPIAS1 knockdown (C) or overexpression (D) HCC cells. (E-F) Plate colony formation assays in circPIAS1 knockdown (E) or overexpression (F) HCC cells. Left: representative images; Right: quantification of colony number. (G-H) Transwell assays measuring migration in circPIAS1 knockdown (G) or overexpression (H) HCC cells. Left: representative images; Right: quantification of migratory cell number. (I) Wound-healing assays in circPIAS1 knockdown or overexpression HCC cells. Left: representative images; Right: quantification of scratch width distance. The red line indicates the scratch edge. (J) Subcutaneous tumor xenografts from control and circPIAS1 overexpression groups. (K) Tumor growth curves of control and circPIAS1 overexpression xenografts. (L) Tumor weights of control and circPIAS1 overexpression xenografts at the end point. (M) Subcutaneous tumor xenografts from control and sh-circPIAS1 groups. (N) Tumor growth curves of control and sh-circPIAS1 xenografts. (O) Tumor weights of control and sh-circPIAS1 xenografts at the end point. (P) Left: representative images of H&E staining of lung metastasis loci. Right: percentage of net lung area occupied by metastases quantified for each group. Scale bar = 200 μm. shCP, sh-circPIAS1
Fig. 3
Fig. 3
CircPIAS1 inhibits ferroptosis in HCC cells. (A) GSEA result of differentially expressed gene pathways affected by circPIAS1 depletion in HCC cells. (B) Viability analysis of sh-circPIAS1 HCC cells treated with Z-VAD-FMK, Nec-1, Lipro-1, or Fer-1 for 24 h. (C) Measurement of lipid ROS levels using C11-BODIPY581/591 probe in circPIAS1 overexpression cells. Left: representative images; Right: quantification of lipid ROS level. (D) Detection of intracellular Fe2+ levels with FerroOrange probe in circPIAS1 overexpression cells. Left: representative images; Right: quantification of Fe2+ level. (E) Measurement of GSH levels using a GSH and GSSG Assay Kit in circPIAS1 overexpression cells. (F) Assessment of lipid ROS levels using C11-BODIPY581/591 probe in sh-circPIAS1 cells with or without Fer-1 or Lipro-1 treatment. Left: representative images; Right: quantification of lipid ROS level. (G) Detection of intracellular Fe2+ levels with FerroOrange probe in sh-circPIAS1 cells with or without Fer-1 or Lipro-1 treatment. Left: representative images; Right: quantification of Fe2+ level. (H) Measurement of GSH levels using a GSH and GSSG Assay Kit in sh-circPIAS1 cells with or without Fer-1 or Lipro-1 treatment. (I) Western blotting analysis of NUPR1, FTH1, KEAP1, SLC11A2, GPX4, SLC7A11, and NRF2 protein levels in circPIAS1 knockdown or overexpression HCC cells. Scale bar = 20 μm. shCP, sh-circPIAS1
Fig. 4
Fig. 4
CircPIAS1 regulates the sensitivity of HCC cells to ferroptosis through NUPR1 (A) Heatmap showing the top 20 differentially expressed genes in sh-circPIAS1 PLC/PRF/5 cells. Genes with fold change > 2 and p < 0.05 were considered significantly different. (B-C) Expression of NUPR mRNA and protein in circPIAS1 overexpression or knockdown HCC cells confirmed by qPCR analysis (B) or western blotting analysis (C). (D) Lipid ROS levels in sh-circPIAS1 cells with or without NUPR1 overexpression. Left: representative images; Right: quantification of lipid ROS level. (E) Intracellular Fe2+ levels in sh-circPIAS1 cells with or without NUPR1 overexpression. Left: representative images; Right: quantification of Fe2+ level. (F) GSH levels in sh-circPIAS1 cells with or without NUPR1 overexpression. (G) Lipid ROS levels in circPIAS1 overexpression cells with or without ZZW-115 treatment. Left: representative images; Right: quantification of lipid ROS level. (H) Intracellular Fe2+ levels in circPIAS1 overexpression cells with or without ZZW-115 treatment. Left: representative images; Right: quantification of Fe2+ level. (I) GSH levels in circPIAS1 overexpression cells with or without ZZW-115 treatment. Scale bar = 20 μm. shCP, sh-circPIAS1
Fig. 5
Fig. 5
CircPIAS1 regulates NUPR1 expression by sponging miR-455-3p in HCC cells. (A) Venn diagram depicting potential interacting miRNAs of circPIAS1 and NUPR1 3’ UTR. (B) Expression of miR-455-3p in HCC tumor and normal tissues from the GEPIA database. (C) Upper: Predicted binding sites between miR-455-3p and circPIAS1; Lower: Putative binding sequences of miR-455-3p on NUPR1 3’ UTR. (D) RIP assays showing the binding of circPIAS1 (left) and miR-455-3p (right) to the Ago2 complex in PLC/PRF/5 cells. (E) FISH assays revealing the co-localization of miR-455-3p and circPIAS1 in Huh7 and PLC/PRF/5 cells. Scale bar = 20 μm. (F) RNA pull-down assay demonstrating the enrichment of miR-455-3p in Huh7 cell lysates using a specific biotin-labeled circPIAS1 probe. (G-H) Dual luciferase reporter assays in HCC cells co-transfected with wild-type or mutant circPIAS1 reporter and miR-455-3p mimics (G) or inhibitor (H). (I-J) Dual luciferase reporter assays in HCC cells co-transfected with wild-type or mutant NUPR1 3’ UTR reporter and miR-455-3p mimics (I) or inhibitor (J). (K-L) NUPR1 protein expression in sh-circPIAS1 cells with or without transfection of miR-455-3p inhibitor (K), or in circPIAS1 overexpression cells with or without transfection of miR-455-3p mimics (L). WT, wild-type; MT, mutant; shCP, sh-circPIAS1
Fig. 6
Fig. 6
MiR-455-3p reverses circPIAS1-induced ferroptosis inhibition and aggressive phenotypes in HCC cells. (A) Lipid ROS levels in circPIAS1 overexpression cells with or without miR-455-3p mimic transfection. Left: representative images; Right: quantification of lipid ROS level. (B) Intracellular Fe2+ levels in circPIAS1 overexpression cells with or without miR-455-3p mimic transfection. Left: representative images; Right: quantification of Fe2+ level. (C) GSH levels in circPIAS1 overexpression cells with or without miR-455-3p mimic transfection. (D) Lipid ROS levels in sh-circPIAS1 cells with or without miR-455-3p inhibitor transfection. Left: representative images; Right: quantification of lipid ROS level. (E) Intracellular Fe2+ levels in sh-circPIAS1 cells with or without miR-455-3p inhibitor transfection. Left: representative images; Right: quantification of Fe2+ level. (F) GSH levels in sh-circPIAS1 cells with or without miR-455-3p inhibitor transfection. (G-I) Cell proliferation (G), colony formation (H), and wound-healing (I) abilities assessed in circPIAS1 overexpression cells with or without miR-455-3p mimic transfection. (J-L) Cell proliferation (J), colony formation (K), and wound-healing (L) abilities assessed in sh-circPIAS1 cells with or without miR-455-3p inhibitor transfection. The red line indicates the scratch edge. Scale bar = 20 μm. shCP, sh-circPIAS1
Fig. 7
Fig. 7
NUPR1 promotes the transcription of FTH1 by binding to its promoter region. (A) qRT-PCR analyses of NUPR1, FTH1, KEAP1, SLC11A2, GPX4, SLC7A11, and NRF2 expression in Huh7 cells after stable NUPR1 transfection. (B-C) Western blotting analyses of NUPR1 and FTH1 protein levels in Huh7 cells with NUPR1 overexpression (B) or ZZW-115 treatment (C). (D) ChIP-qPCR analysis of NUPR1 protein enrichment at the FTH1 gene promoter region. Upper panel: qPCR primer pairs covering the FTH1 gene promoter region; Lower panel: NUPR1 enrichment at the FTH1 gene promoter region. (E) Luciferase activity of the FTH1 promoter reporter in HCC cells with NUPR1 overexpression or ZZW-115 treatment. (F) Luciferase activity of the FTH1 promoter reporter in circPIAS1 overexpression cells with or without ZZW-115 treatment. (G) Luciferase activity of the FTH1 promoter reporter in sh-circPIAS1 cells with or without NUPR1 forced expression. (H) Western blotting analyses of NUPR1 and FTH1 protein levels in HCC cells under different treatments. (I) Upregulation of NUPR1 and FTH1 mRNA expression in tumors compared to normal controls from TCGA-HCC dataset. (J) Spearman’s correlations between NUPR1 and FTH1 mRNA expressions from GEPIA and GEO HCC datasets. (K) IHC analysis evaluating correlated FTH1 and NUPR1 protein expression with circPIAS1 in HCC tissues (n = 36). Scale bar = 200 μm. (L) Kaplan-Meier analysis of overall survival based on NUPR1 and FTH1 expression levels in HCC patients. shCP, sh-circPIAS1
Fig. 8
Fig. 8
ZZW-115-induced ferroptosis enhances the sensitivity of HCC cells to lenvatinib. (A) CircPIAS1 overexpression HCC cells were treated with lenvatinib, ZZW-115 alone, or in combination for 36 h, and cell growth was monitored using a live-cell imaging system. Left: representative images of cells at 36 h post-treatment, with cell boundaries marked with yellow lines. (B) Quantification of the percentage of cell confluence in (A). (C-E) Subcutaneous tumor xenografts (C), tumor weights (D), and tumor growth curves (E) at the endpoint from control and circPIAS1 overexpression groups treated with lenvatinib, ZZW-115 alone, or in combination. (F) Representative images of H&E staining of the tumor xenografts. (G-H) IHC analysis of NUPR1 (G) and FTH1 (H) levels in the tumor xenografts. Scale bar = 200 μm. shCP, sh-circPIAS1
Fig. 9
Fig. 9
Schematic diagram depicting the tumor-promoting effects of circPIAS1 in HCC

References

    1. Clark T, et al. Hepatocellular Carcinoma: review of Epidemiology, Screening, Imaging diagnosis, Response Assessment, and treatment. Curr Probl Diagn Radiol. 2015;44(6):479–86. doi: 10.1067/j.cpradiol.2015.04.004. - DOI - PubMed
    1. Berzigotti A, et al. Portal hypertension and the outcome of surgery for hepatocellular carcinoma in compensated cirrhosis: a systematic review and meta-analysis. Hepatology. 2015;61(2):526–36. doi: 10.1002/hep.27431. - DOI - PubMed
    1. Serper M, et al. Association of Provider Specialty and Multidisciplinary Care with Hepatocellular Carcinoma Treatment and Mortality. Gastroenterology. 2017;152(8):1954–64. doi: 10.1053/j.gastro.2017.02.040. - DOI - PMC - PubMed
    1. Chen LL. The biogenesis and emerging roles of circular RNAs. Nat Rev Mol Cell Biol. 2016;17(4):205–11. doi: 10.1038/nrm.2015.32. - DOI - PubMed
    1. Zhou WY, et al. Circular RNA: metabolism, functions and interactions with proteins. Mol Cancer. 2020;19(1):172. doi: 10.1186/s12943-020-01286-3. - DOI - PMC - PubMed

MeSH terms