. 2024 May 27;22(1):295.
doi: 10.1186/s12964-024-01669-9.

Extracellular vesicles containing MFGE8 from colorectal cancer facilitate macrophage efferocytosis

Affiliations

Extracellular vesicles containing MFGE8 from colorectal cancer facilitate macrophage efferocytosis

Zhixin Ma et al. Cell Commun Signal. .

Abstract

Background: Colorectal cancer (CRC) commonly exhibits tolerance to cisplatin treatment, but the underlying mechanisms remain unclear. Within the tumor microenvironment, macrophages play a role in resisting the cytotoxic effects of chemotherapy by engaging in efferocytosis to clear apoptotic cells induced by chemotherapeutic agents. The involvement of extracellular vesicles (EVs), an intercellular communicator within the tumor microenvironment, in regulating the efferocytosis for the promotion of drug resistance has not been thoroughly investigated.

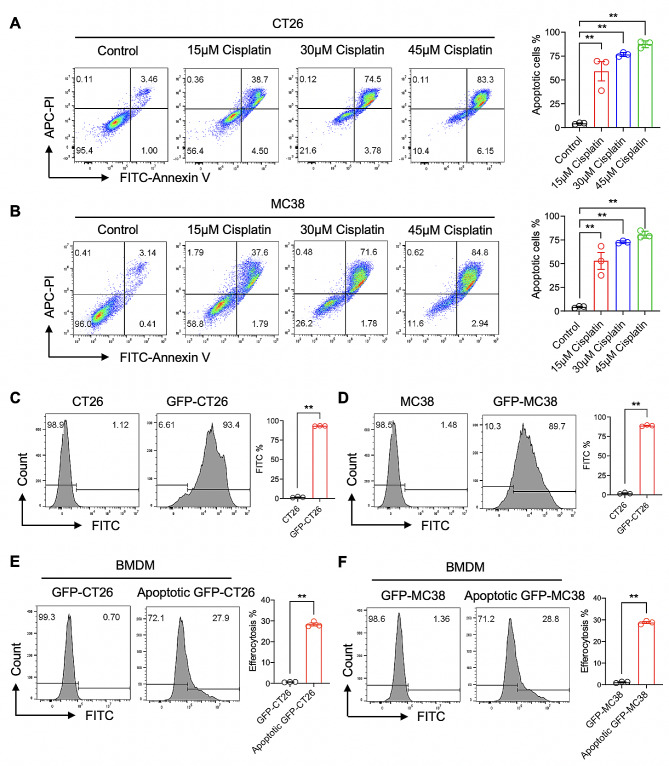
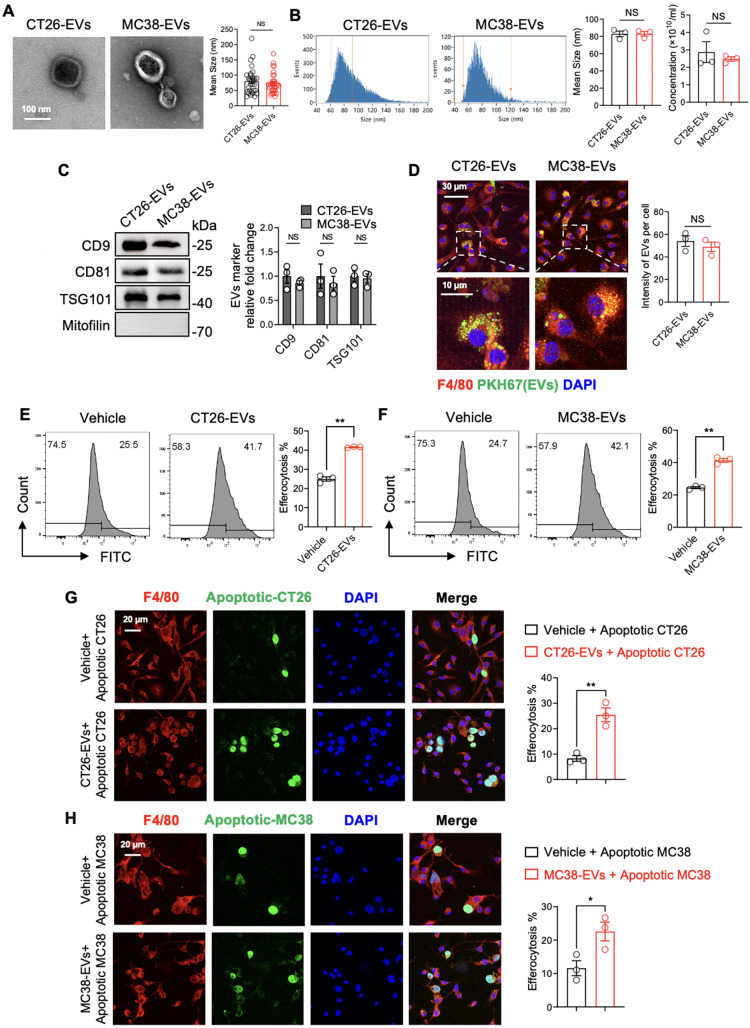
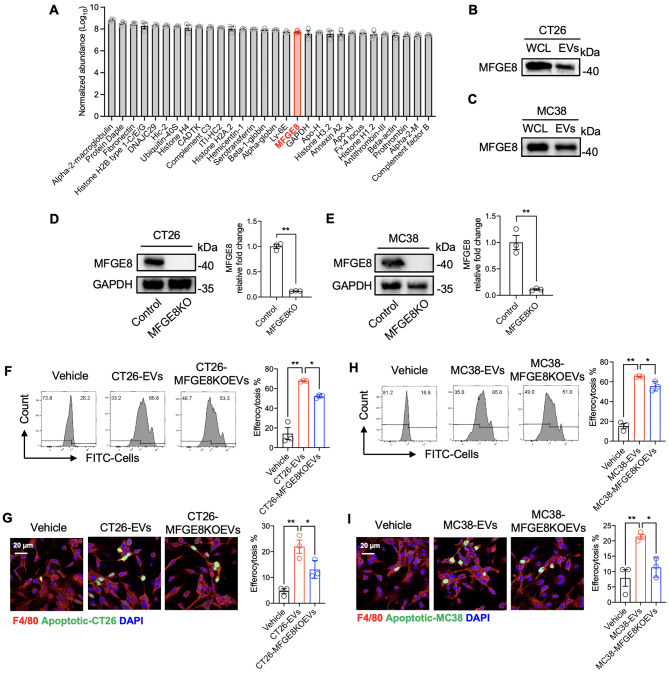
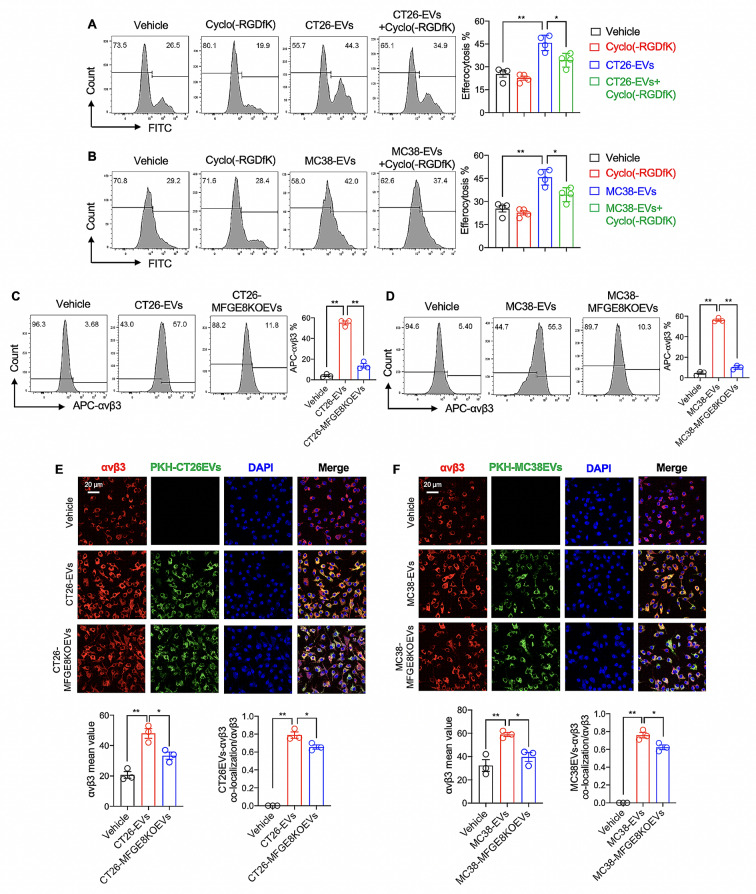
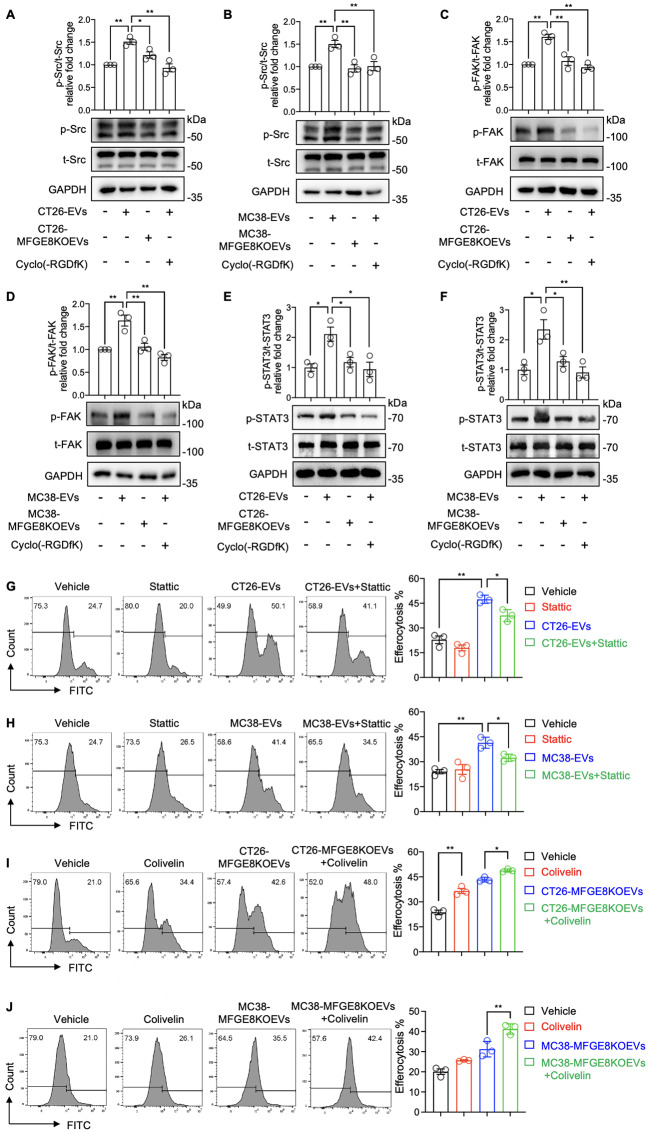
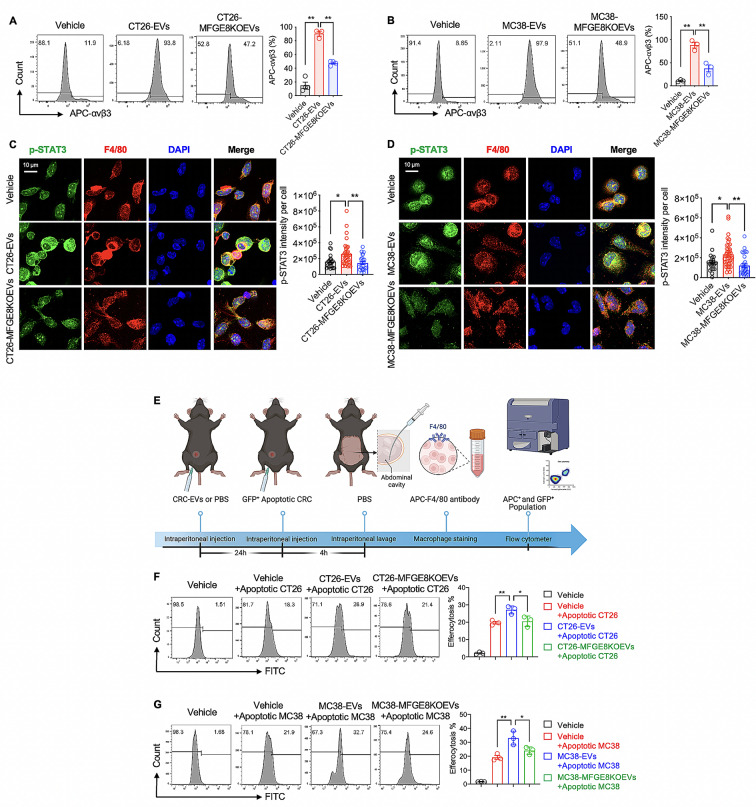
Methods: We constructed GFP fluorescent-expressing CRC cell lines (including GFP-CT26 and GFP-MC38) to detect macrophage efferocytosis through flow cytometric analysis. We isolated and purified CRC-secreted EVs using a multi-step ultracentrifugation method and identified them through electron microscopy and nanoflow cytometry. Proteomic analysis was conducted to identify the protein molecules carried by CRC-EVs. MFGE8 knockout CRC cell lines were constructed using CRISPR-Cas9, and their effects were validated through in vitro and in vivo experiments using Western blotting, immunofluorescence, and flow cytometric analysis, confirming that these EVs activate the macrophage αvβ3-Src-FAK-STAT3 signaling pathway, thereby promoting efferocytosis.

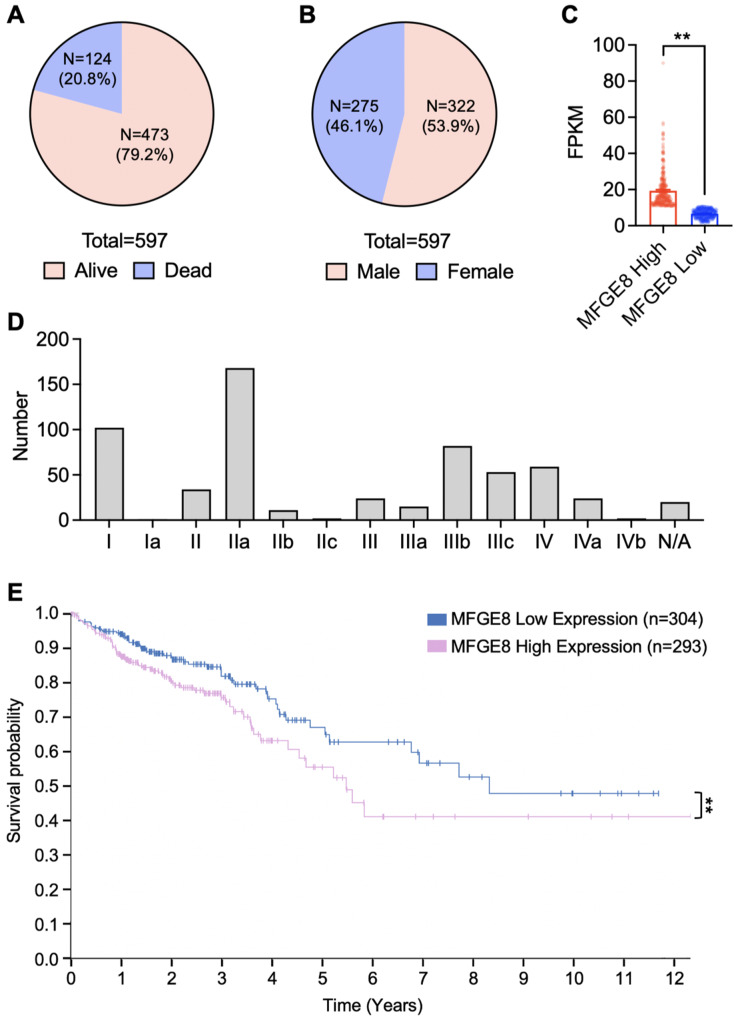
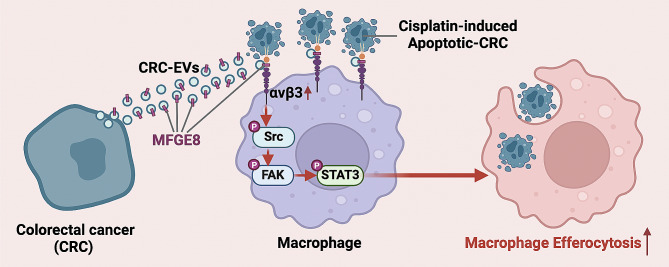
Results: In this study, we found that CRC-derived EVs (CRC-EVs) enhanced macrophage efferocytosis of cisplatin-induced apoptotic CRC cells. Analysis of The Cancer Genome Atlas (TCGA) database revealed a high expression of the efferocytosis-associated gene MFGE8 in CRC patients, suggesting a poorer prognosis. Additionally, mass spectrometry-based proteomic analysis identified a high abundance of MFGE8 protein in CRC-EVs. Utilizing CRISPR-Cas9 gene edition system, we generated MFGE8-knockout CRC cells, demonstrating that their EVs fail to upregulate macrophage efferocytosis in vitro and in vivo. Furthermore, we demonstrated that MFGE8 in CRC-EVs stimulated macrophage efferocytosis by increasing the expression of αvβ3 on the cell surface, thereby activating the intracellular Src-FAK-STAT3 signaling pathway.

Conclusions: Therefore, this study highlighted a mechanism in CRC-EVs carrying MFGE8 activated the macrophage efferocytosis. This activation promoted the clearance of cisplatin-induced apoptotic CRC cells, contributing to CRC resistance against cisplatin. These findings provide novel insights into the potential synergistic application of chemotherapy drugs, EVs inhibitors, and efferocytosis antagonists for CRC treatment.

Keywords: Colorectal cancer; Efferocytosis; Extracellular vesicle; MFGE8; Macrophage.


Conflict of interest statement

The authors declare no competing interests.

The authors declare no conflict of interest.

Figures

Fig. 1
Fig. 1
Macrophage efferocytosis of cisplatin-induced apoptotic CRC cells. (A and B) The apoptosis rates of CT26 and MC38 cells after exposure to cisplatin at concentrations of 0, 15, 30, or 45 µM for 48 h were determined by Annexin V and PI double staining and flow cytometry analysis. (C and D) Stable expression of GFP in CT26 and MC38 cells was established and verified by flow cytometry analysis of the percentage of the GFP + population. (E) The efferocytosis rate was evaluated by staining BMDMs with APC-F4/80 antibody after treatment with cisplatin-induced apoptotic GFP-CT26 cells (1:3 ratio for 4 h). The rate was determined by analyzing the percentage of the GFP + population in the APC-F4/80 + population via flow cytometry. (F) The efferocytosis rate was calculated by analyzing the percentage of the GFP + population in the APC-F4/80 + population after treatment with cisplatin-induced apoptotic GFP-MC38 cells (1:3 ratio for 4 h). Data was shown in mean ± SEM of n = 3 independent experiments per condition. **P < 0.01. Student’s t-test
Fig. 2
Fig. 2
CRC-EVs promoted macrophage efferocytosis. (A) Electron microscopy images represented the morphology of EVs derived from CT26 and MC38 cells (CT26-EVs and MC38-EVs), and the sizes of CT26-EVs and MC38-EVs were determined using electron microscopy. (B) The size and concentration of CT26-EVs and MC38-EVs were analyzed using nano-flow cytometry. (C) Small EV markers (CD9, CD81, and TSG101) and the large EV marker (Mitofilin) were identified through western blot analysis in CT26-EVs and MC38-EVs. (D) Immunofluorescence images demonstrating the uptake of PKH67-labeled CRC-EVs by BMDMs were shown. The statistics represent the mean grayscale values of EVs within cells. (E to H) BMDMs were exposed to Vehicle (PBS), CT26-EVs (10 µg/ml), or MC38-EVs (10 µg/ml) for 24 h. Then, BMDMs were treated with cisplatin-induced apoptotic CT26 or MC38 cells in a 1:3 ratio for 4 h. BMDMs were stained with APC-F4/80 antibody and the efferocytosis rate was measured by determining the percentage of BMDMs that had efferocytosis of apoptotic tumor cells using flow cytometry or confocal fluorescence microscopy. (E) The percentage of BMDMs that had efferocytosis of apoptotic CT26 cells after exposure to Vehicle or CT26-EVs was analyzed using flow cytometry. (F) The efferocytosis rate of BMDMs after exposure to Vehicle or MC38-EVs was determined by flow cytometry. (G) Confocal microscopy was used to analyze the percentage of BMDMs that had efferocytosis of cisplatin-induced apoptotic CT26 cells after exposure to Vehicle or CT26-EVs. (H) The efferocytosis rate of BMDMs after exposure to Vehicle or MC38-EVs was analyzed using confocal microscopy. The efferocytosis percentage, as measured by the confocal fluorescence microscope described above, refers to the ratio of macrophages engulfing green fluorescence to all red-stained macrophages. All statistical graph was generated based on immunofluorescence images obtained from three independent replicate experiments, with an average calculated from three random fields for each experimental group. Data was shown in mean ± SEM of n = 3–10 independent experiments per condition. *P < 0.05 or **P < 0.01. Student’s t-test
Fig. 3
Fig. 3
CRC-EVs carried MFGE8 to promote macrophage efferocytosis. (A) The histogram demonstrating the top 30 proteins with the highest concentration in the CT26-EVs proteomic analysis. (B and C) The MFGE8 expression in the whole cell lysates and the released EVs from CT26 and MC38 cells was measured by western blotting. (D and E) The protein expression of MFGE8 in CT26 and MC38 cells with MFGE8 knockouts was analyzed using western blotting. (F and G) BMDMs were treated with Vehicle (PBS), CT26-EVs (10 µg/ml) or MFGE8 knockout CT26-EVs (10 µg/ml) for 24 h, and then with apoptotic CT26 cells in a 1:3 ratio for 4 h. The percent of BMDMs that efferocytosis of the apoptotic CT26 cells was assessed by flow cytometry (F) and confocal fluorescence microscopy (G). (H and I) BMDMs were treated with PBS (control), MC38-EVs, or MFGE8 knockout MC38-EVs for 24 h and then with apoptotic MC38 cells for 4 h. The percent of BMDMs that efferocytosis of the apoptotic MC38 cells was measured by flow cytometry (H) and confocal fluorescence microscopy (I). The efferocytosis percentage, determined using the confocal fluorescence microscope described above, represents the proportion of macrophages engulfing green fluorescence to all red-stained macrophages. All statistical graphs were generated from immunofluorescence images obtained from three independent replicate experiments, with an average calculated from three random fields for each experimental group. Data was shown in mean ± SEM of n = 3–6 independent experiments per condition. *P < 0.05 or **P < 0.01. Student’s t-test or one-way ANOVA with Tukey post-hoc comparisons
Fig. 4
Fig. 4
High expression of MFGE8 in CRC is associated with poor prognosis. (A-B) The alive-to-death ratio (A) and gender distribution (B) among a total of 597 CRC patients from the TCGA (The Cancer Genome Atlas) database. (C) CRC patients with MFGE8 FPKM values greater than 10.75 were categorized as high MFGE8 expression, while those with FPKM values less than 10.75 were categorized as low MFGE8 expression. (D) Distribution of patients across different clinical stages, including stages I-IV and N/A (not staged). (E) Survival regression curves were represented for CRC patients with high and low MFGE8 expression
Fig. 5
Fig. 5
MFGE8 in CRC-EVs upregulated macrophage αvβ3 expression. (A and B) BMDMs were treated with Vehicle (DMSO), 20 µM Cyclo(-RGDfK), 10 µg/ml CRC-EVs (CT26-EVs or MC38-EVs), or 10 µg/ml CRC-EVs combined with 20 µM Cyclo(-RGDfK) for 24 h. Then, the BMDMs were exposed to cisplatin-induced apoptotic tumor cells in a 1:3 ratio for 4 h, and the efferocytosis percentage of the apoptotic tumor cells by the BMDMs was analyzed using flow cytometry. (C and D) BMDMs were treated with either Vehicle (PBS), 10 µg/ml CRC-EVs (CT26-EVs or MC38-EVs), or 10 µg/ml CRC-MFGE8KOEVs (CT26-MFGE8KOEVs or MC38-MFGE8KOEVs) for 24 h. The cell surface expression of αvβ3 on BMDMs was subsequently assessed using flow cytometry. (E and F) BMDMs were exposed to Vehicle (PBS), 10 µg/ml PKH67-labeled CRC-EVs (CT26-EVs or MC38-EVs), or 10 µg/ml PKH67-labeled CRC-MFGE8KOEVs (CT26-MFGE8KOEVs or MC38-MFGE8KOEVs) for 24 h. Following treatment, αvβ3 on BMDMs was stained with an αvβ3 antibody, and the co-localization of PKH67-labeled EVs and αvβ3 was measured using confocal microscopy. The intensity of αvβ3 fluorescence expression is assessed by computing the mean value of each image, while the co-localization ratio of PKH67-labeled EVs and αvβ3 is determined by comparing the overlapping fluorescence areas of PKH67-labeled EVs and αvβ3 to the total fluorescence area of αvβ3. All statistical graphs were derived from immunofluorescence images acquired from three independent replicate experiments, with averages computed from three random fields for each experimental group. Data was shown in mean ± SEM of n = 3–4 independent experiments per condition. *P < 0.05 or **P < 0.01. One-way ANOVA with Tukey post-hoc comparisons
Fig. 6
Fig. 6
MFGE8 in CRC-EVs promoted macrophage efferocytosis through αVβ3-STAT3 signaling pathway. (A to F) BMDMs were treated with PBS (Control), 10 µg/ml CRC-EVs (CT26-EVs or MC38-EVs), 10 µg/ml MFGE8KOEVs, or 10 µg/ml CRC-EVs combined with 20 µM Cyclo(-RGDfK). The expression of phosphorylated Src (p-Src), total Src (t-Src), phosphorylated FAK (p-FAK), total FAK (t-FAK), phosphorylated STAT3 (p-STAT3), total STAT3 (t-STAT3) was measured by western blot. (G and H) BMDMs were treated with Vehicle (DMSO), 10 µM Stattic, 10 µg/ml CRC-EVs (CT26-EVs or MC38-EVs), or 10 µg/ml CRC-EVs combined with 10 µM Stattic (Stattic was added 30 min before EV treatment) for 24 h, followed by exposure to cisplatin-induced apoptotic tumor cells for 4 h. The efferocytosis percentage was analyzed by flow cytometry. (I and J) BMDMs were treated with Vehicle (DMSO), 20 µM Colivelin, 10 µg/ml CRC-EVs (CT26-EVs or MC38-EVs), or 10 µg/ml CRC-EVs combined with 20 µM Colivelin for 24 h, followed by exposure to cisplatin-induced apoptotic tumor cells for 4 h. The efferocytosis percentage was analyzed by flow cytometry. Data was shown in mean ± SEM of n = 3–4 independent experiments per condition. *P < 0.05 or **P < 0.01. One-way ANOVA with Tukey post-hoc comparisons
Fig. 7
Fig. 7
MFGE8 in CRC-EVs enhanced peritoneal macrophage efferocytosis. (A-D) 12-week-old C57BL/6 mice were intraperitoneally administered Vehicle (200 µl PBS), CT26-EVs (50 µg per mouse in 200 µl PBS), or CT26-MFGE8KOEVs (50 µg per mouse in 200 µl PBS) for 24 h. The animal experiment was divided into three groups, with each group representing an independent replicate experiment using one mouse per group. (A-B) Peritoneal cells were obtained from peritoneal lavage and stained with FITC-F4/80 and APC-αvβ3. Flow cytometry was employed to analyze the percentage of APC-αvβ3 positive population in the FITC-F4/80 positive peritoneal macrophage population. (C-D) Peritoneal cells were obtained from peritoneal lavage and stained with p-STAT3 and F4/80. Confocal microscopy was used to measure the intensity levels of p-STAT3 fluorescence in peritoneal macrophages expressing F4/80 fluorescence. All immunofluorescence images were acquired from three to four independent replicate experiments, with averages computed from three random fields for each experimental group. (E) Schematic illustration of how CRC-EVs enhance the efferocytosis of apoptotic tumor cells by peritoneal macrophages in mice. This experiment is divided into four groups, with one mouse per group, and a total of three independent repeated experiments are conducted. (F) C57BL/6 mice, aged 12 weeks, were intraperitoneally administered Vehicle (200 µl PBS), CT26-EVs (50 µg per mouse in 200 µl PBS), or CT26-MFGE8KOEVs (50 µg per mouse 200 µl PBS) for 24 h. After that, they were injected intraperitoneally with 2 × 106 cisplatin-induced apoptotic GFP-CT26 cells for 4 h. The peritoneal cells were obtained from the peritoneal lavage and stained with APC-F4/80 antibody. The flow cytometry was used to analyze the proportion of peritoneal macrophages that efferocytosis of apoptotic GFP-CT26 cells (the percentage of GFP + cells in the APC + cell population). (G) C57BL/6 mice were intraperitoneally given Vehicle (200 µl PBS), MC38-EVs (50 µg per mouse in 200 µl PBS), or MC38-MFGE8KOEVs (50 µg per mouse in 200 µl PBS), followed by an intraperitoneal injection of cisplatin-induced apoptotic GFP-MC38 cells. The efferocytosis rate was determined by flow cytometry. Data was shown in mean ± SEM of n = 3–4 independent experiments per condition. *P < 0.05 or **P < 0.01. One-way ANOVA with Tukey post-hoc comparisons
Fig. 8
Fig. 8
Schematic model of CRC-EVs induced macrophage efferocytosis. In the process of treating colorectal cancer (CRC) with cisplatin, cisplatin can induce apoptosis in CRC cells. CRC cells that have not undergone apoptosis secrete EVs containing the MFGE8 protein, which are delivered to macrophages. Upon delivery, MFGE8 upregulates αvβ3 cell surface expression and subsequently activates the Src-FAK-STAT3 signaling pathway in macrophages. This activation promotes efferocytosis, facilitating the clearance of apoptotic tumor cells induced by cisplatin. Ultimately, this resistance to the therapeutic effects of cisplatin promotes the progression of CRC tumors

References

    1. Siegel RL, Miller KD, Wagle NS, Jemal A. Cancer statistics, 2023. CA Cancer J Clin. 2023;73:17–48. doi: 10.3322/caac.21763. - DOI - PubMed
    1. Siegel RL, Miller KD, Goding Sauer A, Fedewa SA, Butterly LF, Anderson JC, Cercek A, Smith RA, Jemal A. Colorectal cancer statistics, 2020. CA Cancer J Clin. 2020;70:145–64. doi: 10.3322/caac.21601. - DOI - PubMed
    1. Koberle B, Schoch S. Platinum complexes in Colorectal Cancer and other solid tumors. Cancers (Basel) 2021, 13. - PMC - PubMed
    1. Fan WH, Wang FC, Jin Z, Zhu L, Zhang JX. Curcumin synergizes with Cisplatin to inhibit Colon cancer through targeting the MicroRNA-137-Glutaminase Axis. Curr Med Sci. 2022;42:108–17. doi: 10.1007/s11596-021-2469-0. - DOI - PubMed
    1. Wang Y, Lina L, Xu L, Yang Z, Qian Z, Zhou J, Suoni L. Arctigenin enhances the sensitivity of cisplatin resistant colorectal cancer cell by activating autophagy. Biochem Biophys Res Commun. 2019;520:20–6. doi: 10.1016/j.bbrc.2019.09.086. - DOI - PubMed

Publication types