. 2024 May 27;21(1):46.
doi: 10.1186/s12987-024-00547-3.

The circadian clock in the choroid plexus drives rhythms in multiple cellular processes under the control of the suprachiasmatic nucleus

Affiliations

The circadian clock in the choroid plexus drives rhythms in multiple cellular processes under the control of the suprachiasmatic nucleus

Martin Sládek et al. Fluids Barriers CNS. .

Abstract

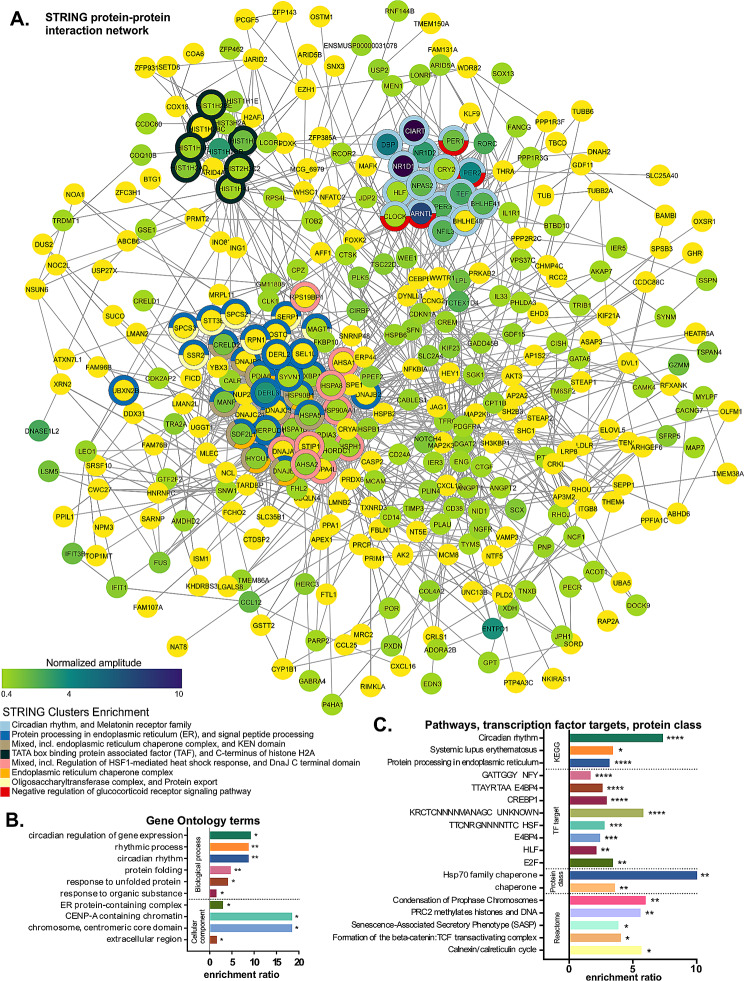
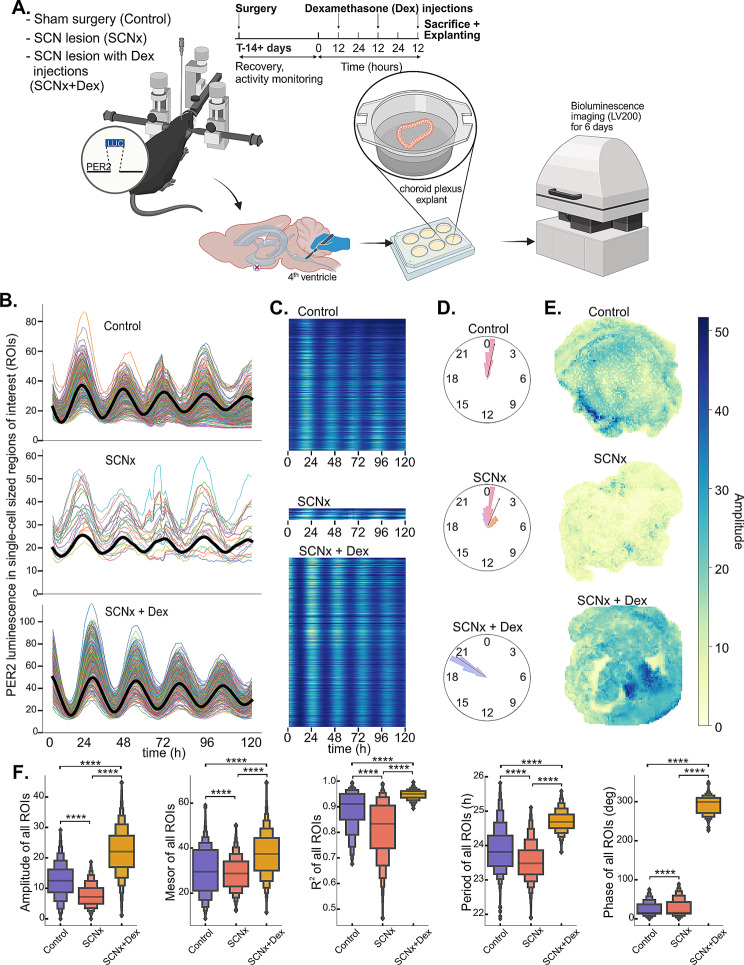
Choroid plexus (ChP), the brain structure primarily responsible for cerebrospinal fluid production, contains a robust circadian clock, whose role remains to be elucidated. The aim of our study was to [1] identify rhythmically controlled cellular processes in the mouse ChP and [2] assess the role and nature of signals derived from the master clock in the suprachiasmatic nuclei (SCN) that control ChP rhythms. To accomplish this goal, we used various mouse models (WT, mPer2Luc, ChP-specific Bmal1 knockout) and combined multiple experimental approaches, including surgical lesion of the SCN (SCNx), time-resolved transcriptomics, and single cell luminescence microscopy. In ChP of control (Ctrl) mice collected every 4 h over 2 circadian cycles in darkness, we found that the ChP clock regulates many processes, including the cerebrospinal fluid circadian secretome, precisely times endoplasmic reticulum stress response, and controls genes involved in neurodegenerative diseases (Alzheimer's disease, Huntington's disease, and frontotemporal dementia). In ChP of SCNx mice, the rhythmicity detected in vivo and ex vivo was severely dampened to a comparable extent as in mice with ChP-specific Bmal1 knockout, and the dampened cellular rhythms were restored by daily injections of dexamethasone in mice. Our data demonstrate that the ChP clock controls tissue-specific gene expression and is strongly dependent on the presence of a functional connection with the SCN. The results may contribute to the search for a novel link between ChP clock disruption and impaired brain health.

Keywords: mPer2 Luc mouse; Choroid plexus; Circadian clock; Circadian transcriptome; Glucocorticoid; Mouse; Suprachiasmatic nuclei.


Conflict of interest statement

The authors declare no competing interests.

Figures

Fig. 1
Fig. 1
Suprachiasmatic nucleus lesion (SCNx) disrupts circadian transcriptome in choroid plexus (ChP) of the 4th ventricle, comparably to genetic disruption of local ChP clock. (A) Cartoon depicting the workflow; created with BioRender.com. (B) Representative double-plotted actogram of a mouse with sham surgery (controls) and SCN lesion (SCNx) recorded in constant darkness (DD); black and grey boxes indicate the time of lights off and on during the previous light-dark regime, respectively. (C) Corresponding Chi-square periodograms of the activity rhythms shown in Fig. 1B, Qp – Chi-square statistics. (D) Histology showing the SCN of a representative sham-operated mouse and of the SCNx mouse from Fig. 1B. (E) Volcano plot of genes identified as differentially expressed (DEGs) by pairwise DESeq2 analysis between Control and SCNx samples pooled across all time points using the dataset of genes with an average TPM ≥ 1 (referred to as filtered background). Selected genes are annotated; 174 up- (green) and downregulated (blue) genes submitted to further analysis are highlighted. (F) DEGs with Benjamini-Hochberg false discovery rate adjusted P value (FDR) < 0.25 were submitted to over-representation analysis (ORA) against filtered background. Volcano plot shows the most enriched Gene Ontology (GO) terms (annotated non-redundant terms). (G) The rhythmicity threshold (Q < 0.4) was chosen after plotting the number of cycling genes in Control (blue) and SCNx (red) against FDR Q value of three independent detection methods (eJTK, BIO_CYCLE, ARSER). (H) Venn diagram of genes identified as rhythmic in Control (red) and SCNx (green). (I) Heatmap of genes identified as significantly rhythmic in Control (left) or SCNx (right) samples, normalized and sorted by phase. Representative genes of distinct phase clusters are annotated. (J) Polar histogram of genes identified as rhythmic in Control (left) and SCNx (right) with calculated Rayleigh vector showing the mean phase. K. Histogram of log-transformed amplitudes of all genes identified as rhythmic in Control (left) and SCNx (right), Mann-Whitney test. L. Histograms of log-transformed amplitudes of all genes identified as rhythmic in Control and the same genes in SCNx (left), or vice versa (right), compared by Wilcoxon signed-rank test. M. Absolute values of normalized day-night differences of only the most cycling transcripts (Q < 0.1, n = 38) between the three groups (1 sample / time point). Dunn’s test, mean ± 95% CI (confidential interval), ** P < 0.01, **** P < 0.0001
Fig. 2
Fig. 2
Circadian oscillating genes are dominantly enriched for Circadian rhythm, Endoplasmic reticulum and Histone-related terms. (A) Rhythmic genes from Control samples were analyzed for protein-protein interactions using the STRING database. Out of 641 genes recognized by Cytoscape, 494 formed the largest subnetwork, which was further simplified down to nearest neighbors resulting in 345 visualized gene nodes. Normalized amplitude of each rhythmic gene is depicted by color gradient (vivid yellow to blackcurrant, from lowest to highest amplitude). Rhythmic genes functionally annotated via STRING database that were significantly (FDR < 0.05) enriched against the filtered background are marked by color-coded donut charts, see for example genes that are part of the significantly enriched STRING Cluster “Circadian rhythm” in light blue (see legend). Note the three main subnetworks formed by clock genes, chaperones and histones. (B) Rhythmic genes from Control samples were submitted to ORA against filtered background. Bar plot of significantly enriched GO Biological process and Cellular component terms showing fold enrichment with asterisks denoting FDR. (C) Bar plot of significantly enriched pathways (KEGG, Reactome databases), Transcription factor (TF) targets and PANTHER Protein Classes. * FDR < 0.05, ** FDR < 0.01, *** FDR < 0.001, **** FDR < 0.0001
Fig. 3
Fig. 3
Rhythmically controlled ChP functions cluster in specific phase windows, mainly during subjective night. (A) Normalized expression of all rhythmic genes from Control samples. (B) Rhythmic genes from Control were divided to 6 groups using K-means clustering. Plot shows principal component analysis with color codes used to differentiate individual clusters 1–6, which correspond to phase-aligned genes. (C) Genes from each cluster were subjected to ORA against filtered background. Bar plot of significantly enriched GO terms, TF targets and KEGG pathways showing fold enrichment with asterisks denoting FDR. On the right are traces of normalized expression of each rhythmic gene in each analyzed cluster
Fig. 4
Fig. 4
Examples of 48-h traces of rhythmically expressed ChP genes. (A) Canonical clock and clock-controlled genes. (B) Selected endoplasmic reticulum stress (ERS) response genes. (C) Previously described genes with important ChP-specific function that are significantly rhythmic. (D) Selected genes with important ChP-specific function that are not significantly rhythmic on mRNA level. (E) Non-clock genes with highest circadian amplitude. (F) Rhythmic genes coding ion channels. (G) Rhythmic genes coding membrane receptors. (H) Rhythmic genes coding signaling proteins secreted to CSF. (I) Evidence for rhythmic response to glucocorticoid receptor activation. Circadian time (CT) in hours is on X-axis, transcripts per million (TPM) on Y-axis. Control samples blue full line, SCNx samples red dashed line. Genes that are not significantly rhythmic in Control are marked with #
Fig. 5
Fig. 5
ChP explants from SCNx mPer2Luc mice have compromised circadian rhythms ex vivo, which can be restored by a repeated in vivo injection of glucocorticoid analog dexamethasone. (A) Cartoon depicting the workflow and the three experimental groups – mice with sham surgery (Control), SCN lesion (SCNx) and SCN lesion with three consecutive dexamethasone injections (SCNx + Dex); created with BioRender.com. (B) Circadian PER2::LUCIFERASE rhythms in approximately single-cell sized regions of interest (ROIs) across a whole representative explanted ChP from either Control, SCNx or SCNx + Dex mouse recorded for 5 days ex vivo using Luminoview LV200 (Olympus). Only traces that could be fitted with cosine curve with period between 18–35 h and goodness of fit R2 > 0.97 are shown. Average cosine fit is shown in black. (C) Heatmap of the same data, showing that there were many more rhythmic cells with R2 > 0.97 in Control than in SCNx explants and Dex efficiently restored the number of rhythmic rois. (D) Polar histogram of all rhythmic ROIs in Control, SCNx and SCNx + Dex explants with calculated Rayleigh vector showing the mean phase. (E) Positional heatmaps showing spatial distribution of all rhythmic ROIs across representative explants from Control, SCNx and SCNx + Dex mice. (F) Violin plots showing comparison between circadian parameters (from left: amplitude, mesor, R2, period, phase) of all rhythmic ROIs (excluding outliers outside 3 standard deviations) across individual ChP explants from Control (blue), SCNx (red) and SCNx + Dex (orange) mice (Kruskal-Wallis with Dunn’s post-hoc test, asterisks depict significant difference between each group on P < 0.0001, number of mice and individual explants n = 3–6 / group, number of analyzed ROIs n = 4684–6434 / explant)

References

    1. Redzic ZB, Segal MB. The structure of the choroid plexus and the physiology of the choroid plexus epithelium. Adv Drug Deliv Rev. 2004;56(12):1695–716. doi: 10.1016/j.addr.2004.07.005. - DOI - PubMed
    1. Rennels ML, Gregory TF, Blaumanis OR, Fujimoto K, Grady PA. Evidence for a ‘paravascular’ fluid circulation in the mammalian central nervous system, provided by the rapid distribution of tracer protein throughout the brain from the subarachnoid space. Brain Res. 1985;326(1):47–63. doi: 10.1016/0006-8993(85)91383-6. - DOI - PubMed
    1. Damkier HH, Brown PD, Praetorius J. Cerebrospinal fluid secretion by the choroid plexus. Physiol Rev. 2013;93(4):1847–92. doi: 10.1152/physrev.00004.2013. - DOI - PubMed
    1. Speake T, Whitwell C, Kajita H, Majid A, Brown PD. Mechanisms of CSF secretion by the choroid plexus. Microsc Res Tech. 2001;52(1):49–59. doi: 10.1002/1097-0029(20010101)52:1<49::AID-JEMT7>3.0.CO;2-C. - DOI - PubMed
    1. Milhorat TH, Hammock MK, Fenstermacher JD, Levin VA. Cerebrospinal fluid production by the choroid plexus and brain. Science. 1971;173(3994):330–2. doi: 10.1126/science.173.3994.330. - DOI - PubMed

Substances