. 2024 May 21;7(8):e202302554.
doi: 10.26508/lsa.202302554. Print 2024 Aug.

IGHMBP2 deletion suppresses translation and activates the integrated stress response

Affiliations

IGHMBP2 deletion suppresses translation and activates the integrated stress response

Jesslyn Park et al. Life Sci Alliance. .

Abstract

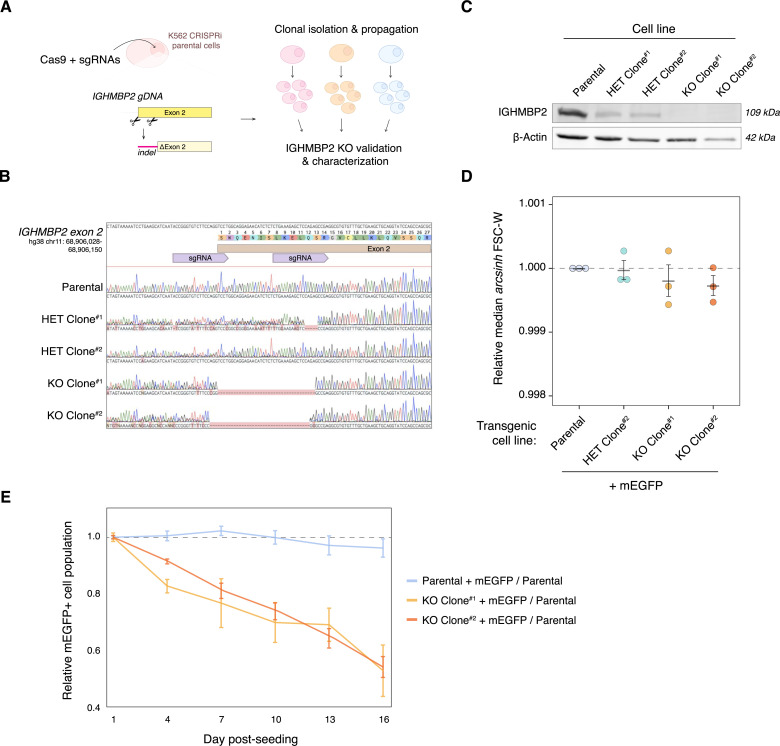
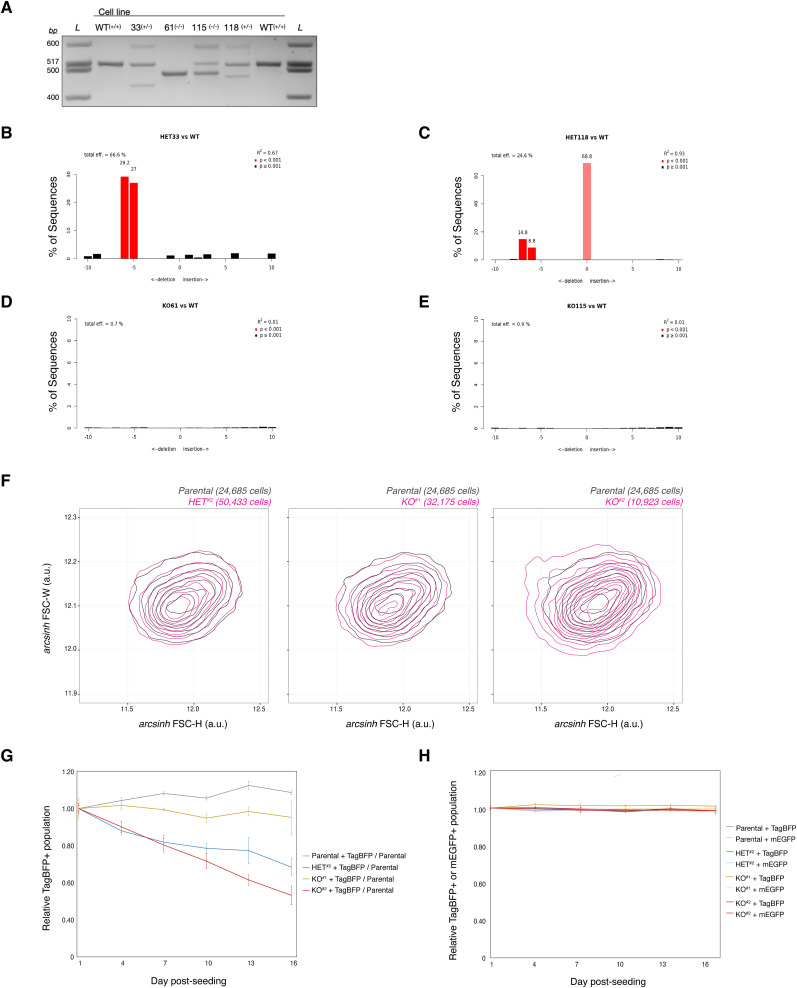
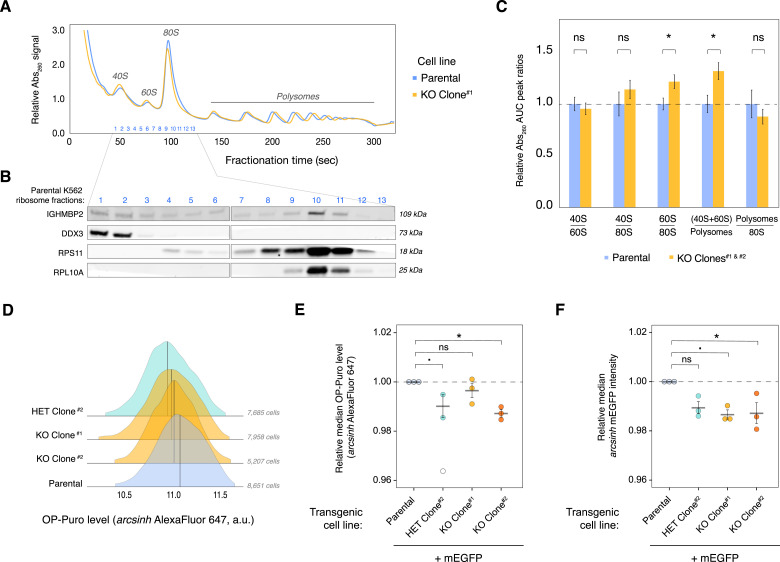
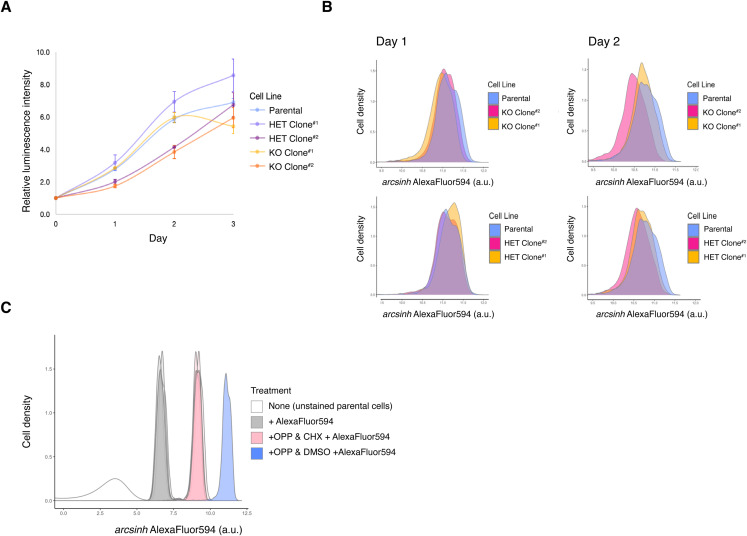
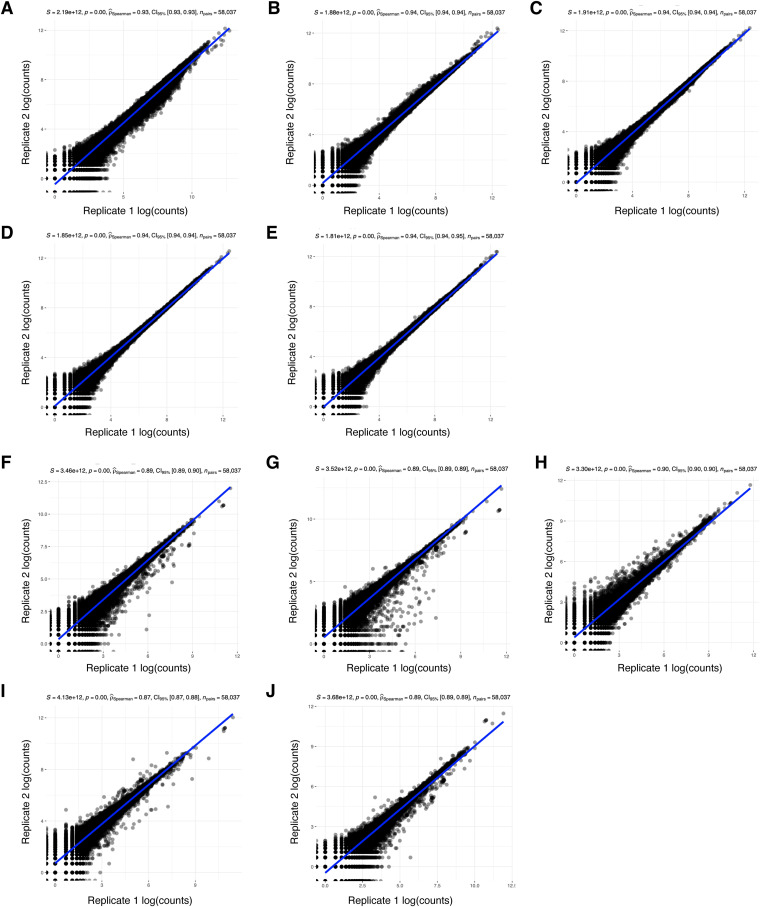
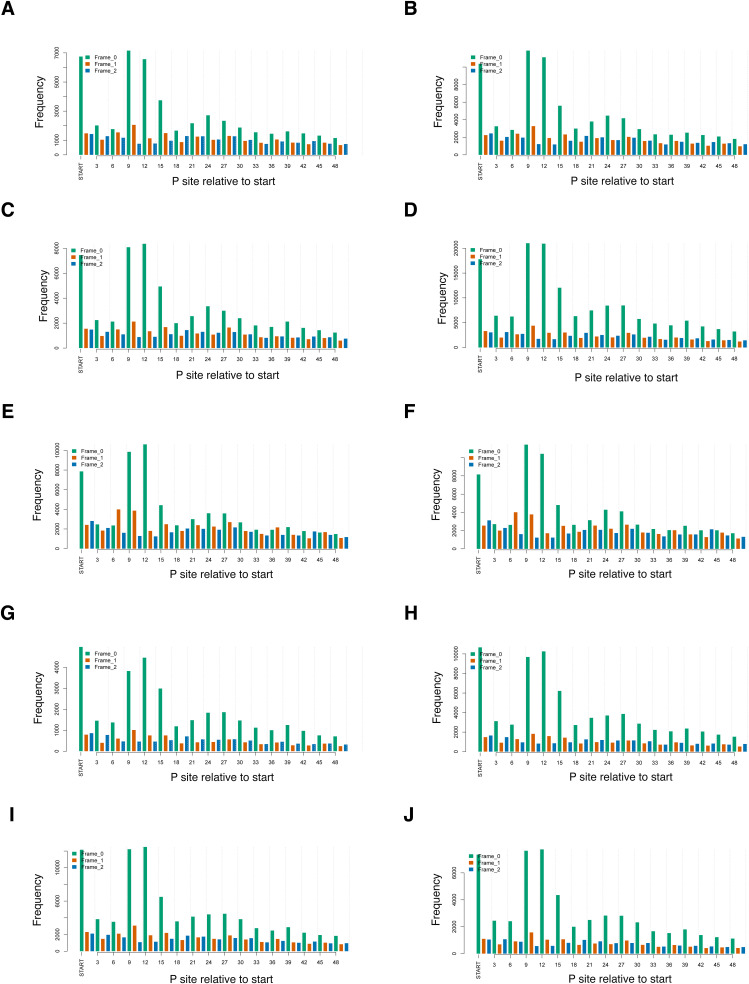
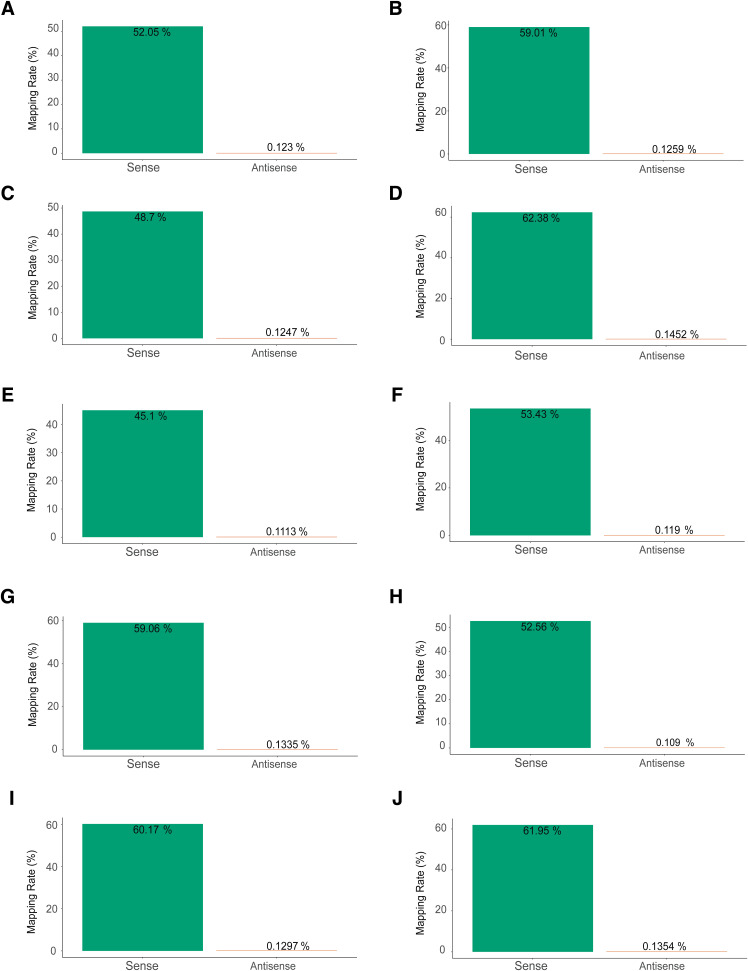
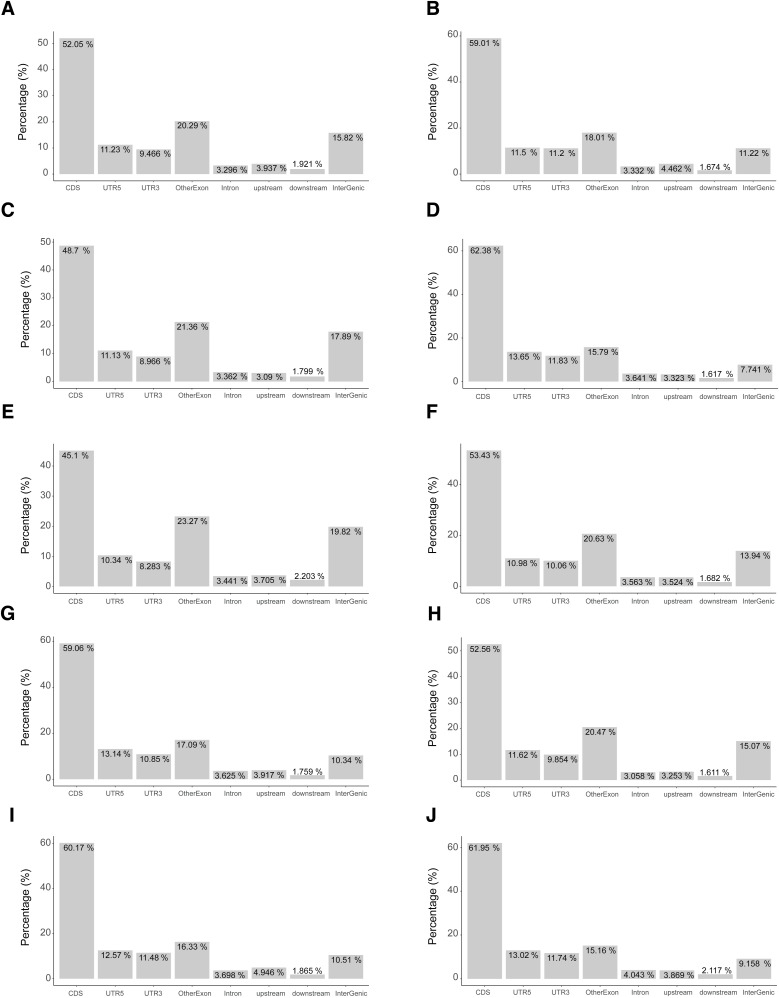
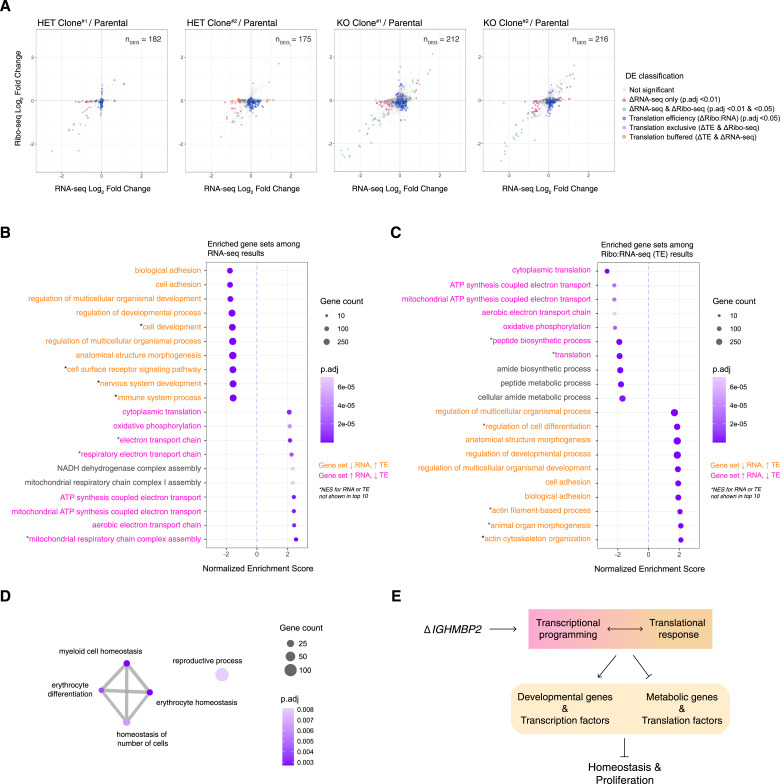
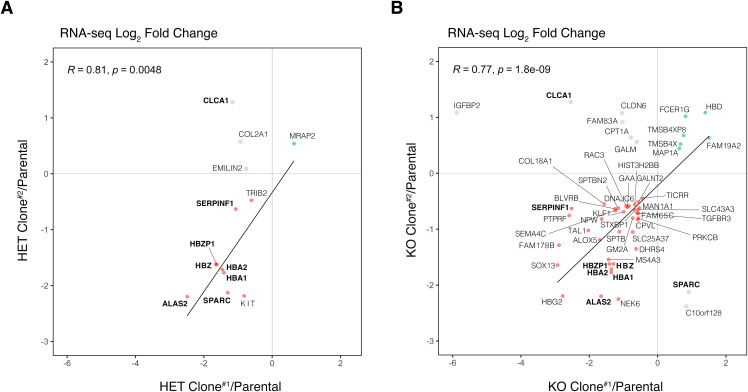
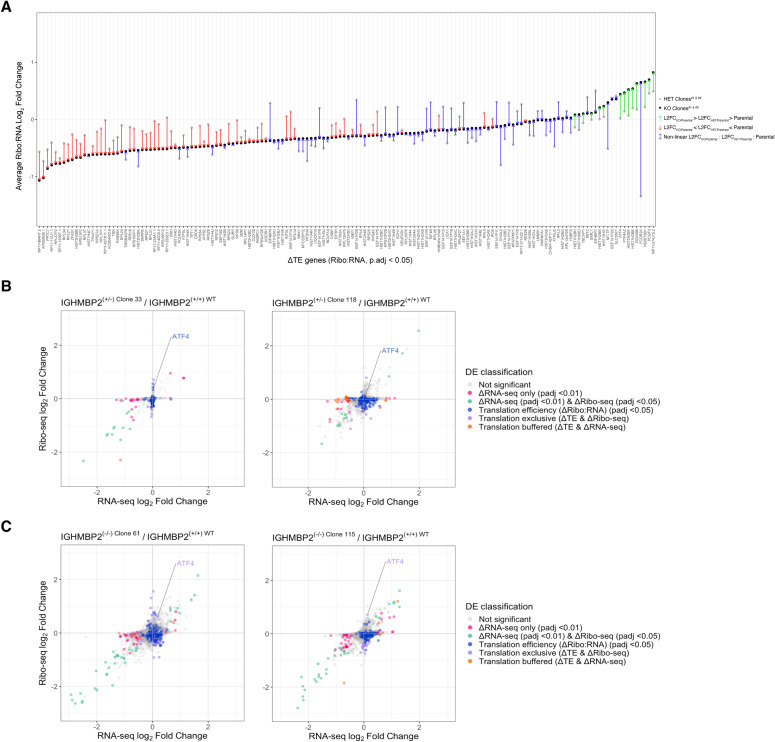
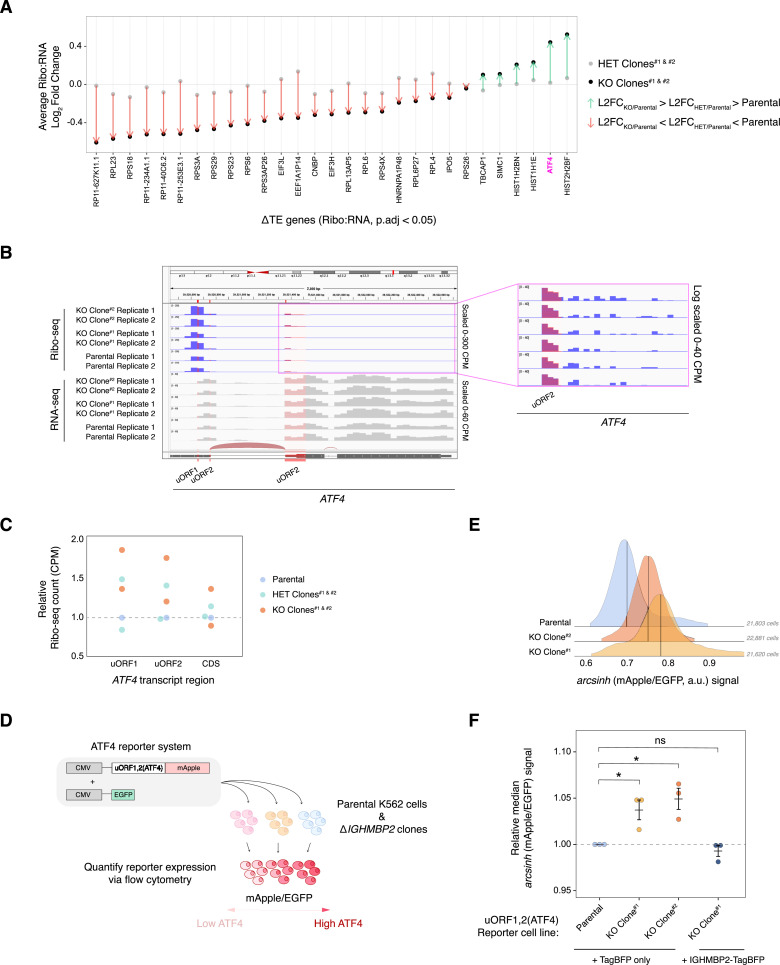
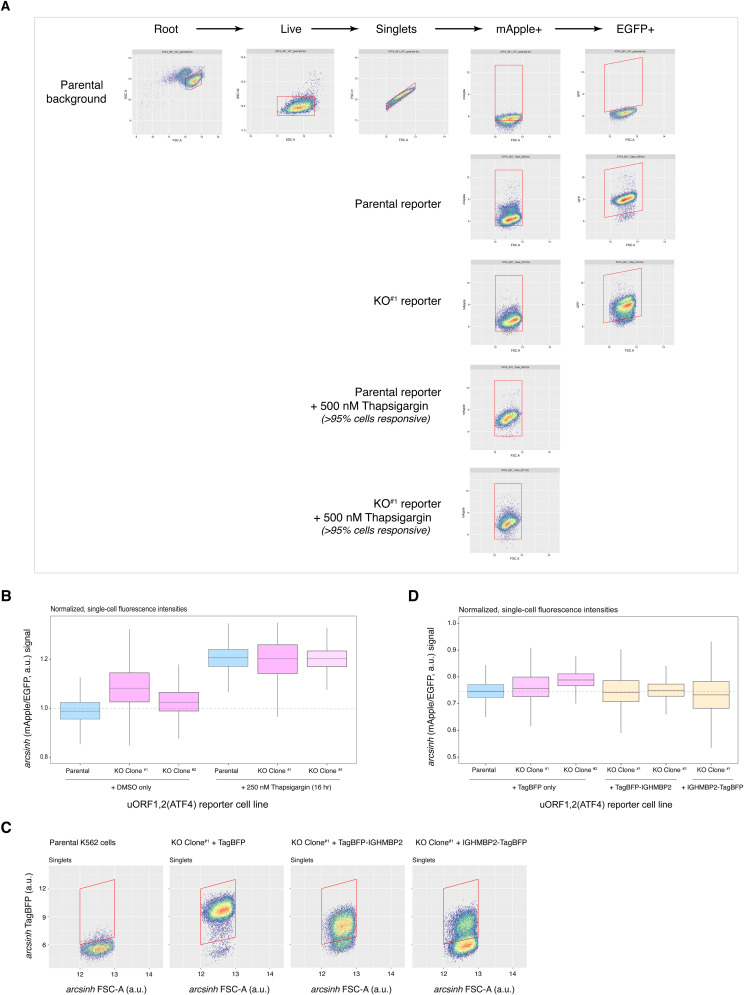
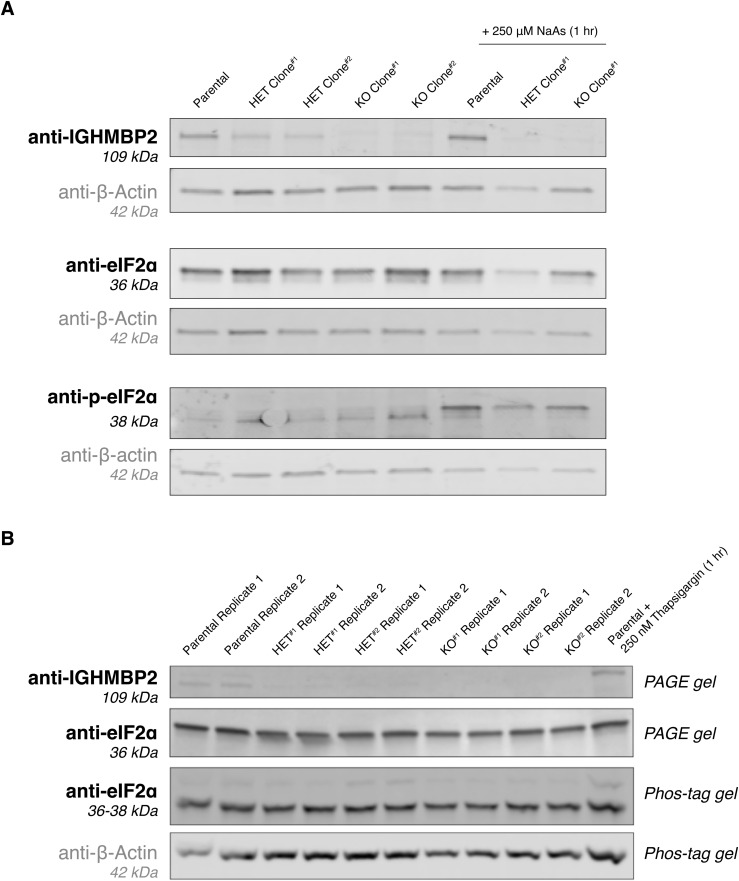
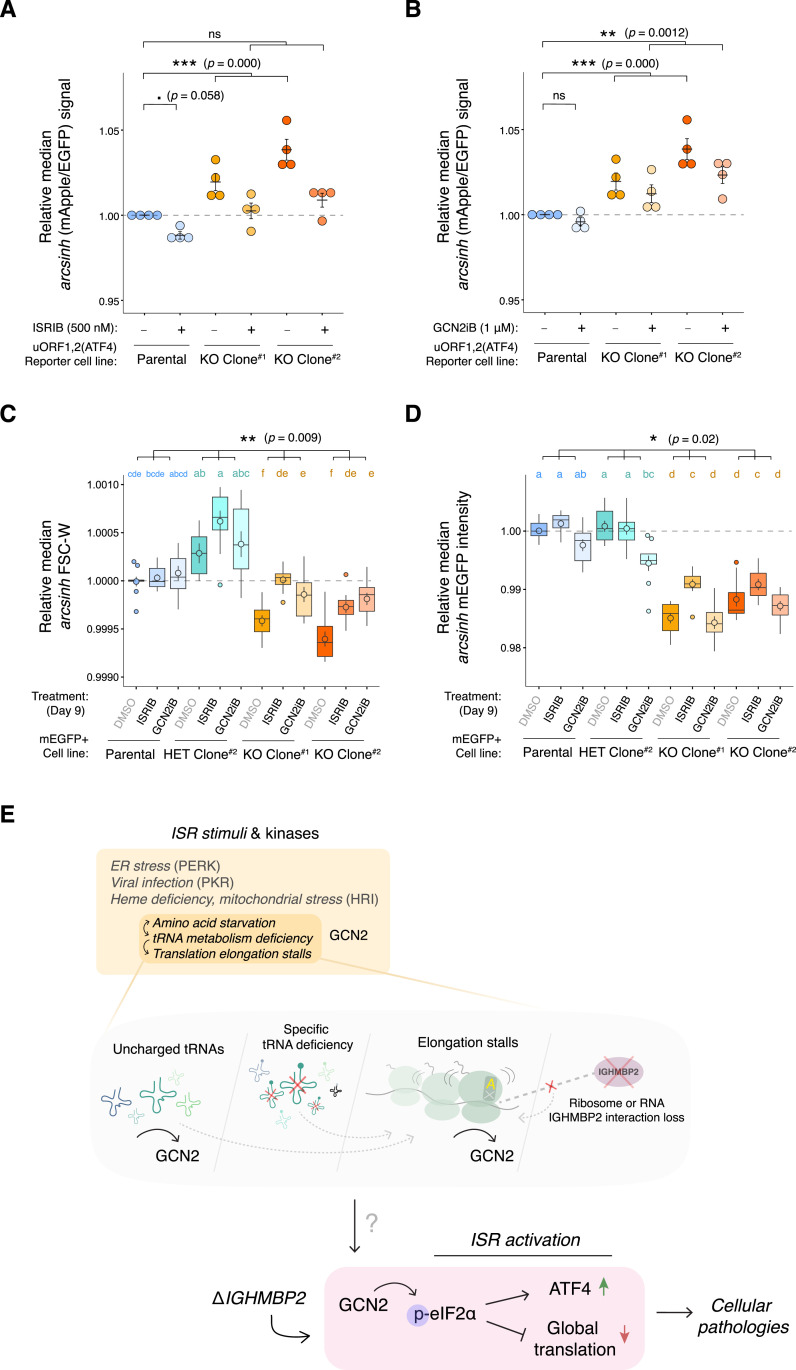
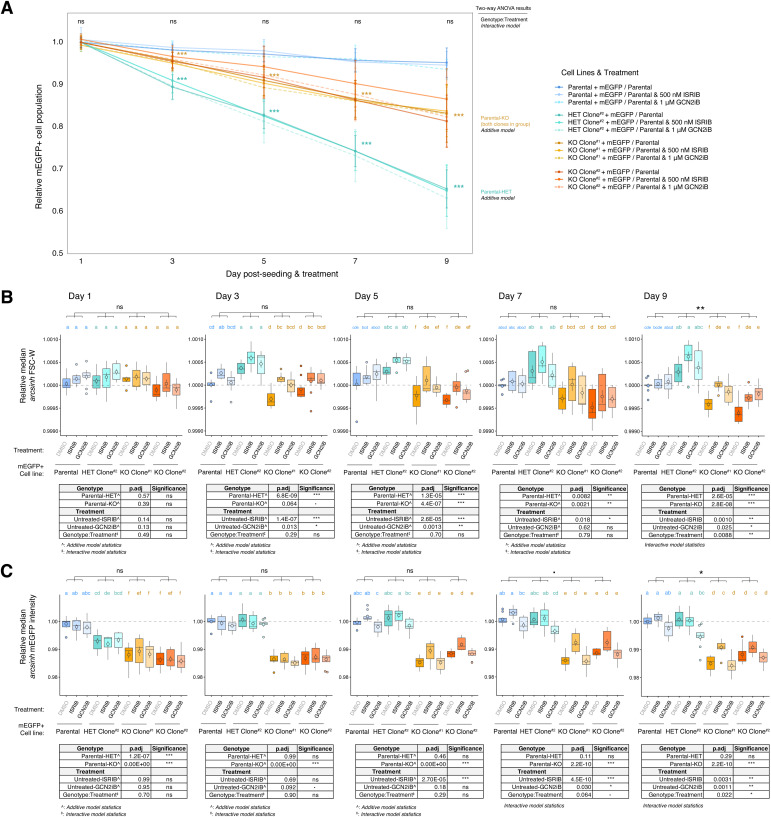
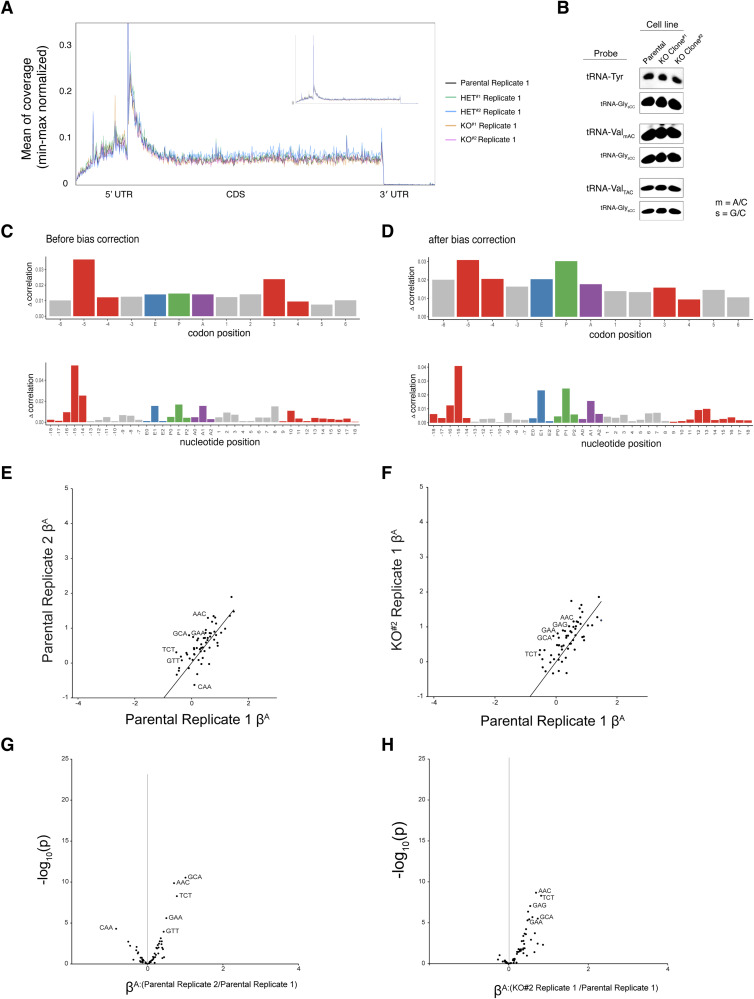
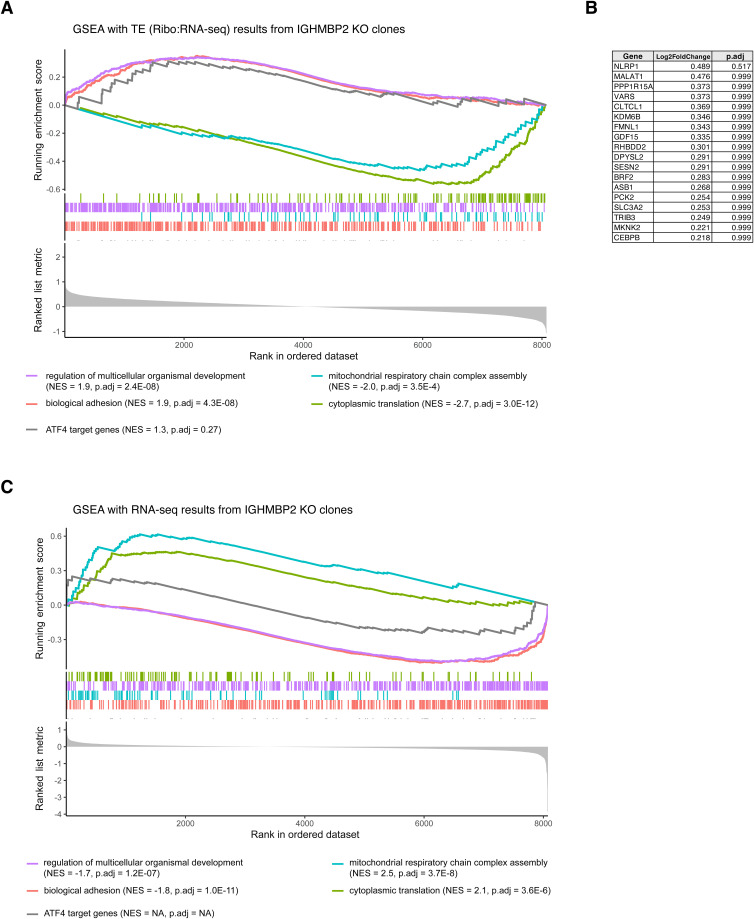
IGHMBP2 is a nonessential, superfamily 1 DNA/RNA helicase that is mutated in patients with rare neuromuscular diseases SMARD1 and CMT2S. IGHMBP2 is implicated in translational and transcriptional regulation via biochemical association with ribosomal proteins, pre-rRNA processing factors, and tRNA-related species. To uncover the cellular consequences of perturbing IGHMBP2, we generated full and partial IGHMBP2 deletion K562 cell lines. Using polysome profiling and a nascent protein synthesis assay, we found that IGHMBP2 deletion modestly reduces global translation. We performed Ribo-seq and RNA-seq and identified diverse gene expression changes due to IGHMBP2 deletion, including ATF4 up-regulation. With recent studies showing the integrated stress response (ISR) can contribute to tRNA metabolism-linked neuropathies, we asked whether perturbing IGHMBP2 promotes ISR activation. We generated ATF4 reporter cell lines and found IGHMBP2 knockout cells demonstrate basal, chronic ISR activation. Our work expands upon the impact of IGHMBP2 in translation and elucidates molecular mechanisms that may link mutant IGHMBP2 to severe clinical phenotypes.


Conflict of interest statement

The authors declare that they have no conflict of interest.

Figures

Figure 1.
Figure 1.. IGHMBP2 deletion decreases proliferation of cells.
(A) Cas9-mediated IGHMBP2 deletion in K562 CRISPRi cells (parental). (B) Sanger sequencing of gDNA surrounding the IGHMBP2 exon 2 cut-site in clones screened for indels via PCR. Cas9-sgRNA-targeted regions are shown in purple. (C) Western blot visualizing IGHMBP2 expression in clones depicted in (B), validating reduced IGHMBP2 protein levels in IGHMBP2 HET Clones #1 and #2 and full deletion in IGHMBP2 KO Clones #1 and #2. (D) Median forward-scatter widths (FSC-W) among ΔIGHMBP2 cell lines normalized to the median FSC-W of parental cells per day of measurement for three separate days (n = 3), derived from flow cytometry measurements of at least 2,500 cells per sample 1 d post-passaging. Horizontal black lines show the mean, and error bars show SEM of normalized medians. (E) Representative competitive proliferation trends between ΔIGHMBP2 cell lines stably expressing mEGFP seeded with 50% non-fluorescent parental cells. Samples were plated in triplicate wells on Day 0 and independently passaged on each day of measurement. The mEGFP+ fraction per well was normalized to the mean Day 1 fraction per cell line among triplicate wells measured by flow cytometry, and error bars show the coefficient of variation. Source data are available for this figure.
Figure S1.
Figure S1.. ΔIGHMBP2 clone genotyping and characterization.
(A) Genotyping of select clones via PCR around the IGHMBP2 gDNA exon 2 cut-site. (A, B, C, D, E) TIDE alignment using Sanger sequencing results of PCR products shown in (A). Quantified indel frequencies among alleles per clone are shown. (F) Forward-scatter height (FSC-H) versus width (FSC-W) distributions among ΔIGHMBP2 cell lines. (G) Competitive proliferation trends between ΔIGHMBP2 cell lines stably expressing TagBFP seeded with 50% non-fluorescent parental cells. Each sample was seeded in triplicate on Day 0 and independently passaged on each day of measurement. (H) Proportion of fluorescent populations over 2 wk in cell lines expressing transgenic TagBFP or mEGFP. For (G, H), error bars reflect the coefficient of variation of normalized triplicate results per day.
Figure 2.
Figure 2.. IGHMBP2 deletion reduces global translation in cells.
(A) Representative polysome profiles from parental K562 (blue) and IGHMBP2 KO Clone #1 (yellow) cell lines. (A, B) Western blot of fractions from the parental polysome profile in (A). (C) Area under the curve quantification of polysome profiles, for parental (n = 5) and IGHMBP2 deletion clone (n = 7) samples collected from separate flasks, measured on three different days, and normalized to the mean parental signal per day of measurement. Unpaired, two-tailed, two-sample t test was performed between parental versus KO polysome area under the curve ratios (*P.adj ≤ 0.05), and error bars show SEM. (D) Representative O-propargyl-puromycin levels in ΔIGHMBP2 cell lines quantified via flow cytometry. This experiment was performed three times with comparable results using either Alexa Fluor 647 as shown or Alexa Fluor 594 (Fig S2). Medians are indicated with black lines. (E) O-propargyl-puromycin assay results using ΔIGHMBP2 cell lines expressing mEGFP. Values beyond 2.5 SD from the mean of all data points were considered outliers omitted from statistical interpretations (SD = 2.6 for single outlier in HET clone; shown unfilled). (F) Relative mEGFP expression in samples from (E). For (E, F), the median fluorescence per cell line is normalized to the median fluorescence of parental cells from the same day, repeated on three separate days (n = 3). Fluorescence of at least 2,300 cells in the final gate per sample was measured by flow cytometry. Horizontal black lines show the mean and error bars show SEM of normalized median values. (E, F) One-way ANOVA (Kruskal–Wallis) was performed against all four cell lines, and we rejected the null hypothesis with P = 0.07 for both (E, F). Pairwise statistics were determined via Conover–Iman post hoc testing and shown relative to parental (ns: P.adj > 0.1, .: P.adj ≤ 0.1, *: P.adj ≤ 0.05). Source data are available for this figure.
Figure S2.
Figure S2.. Nascent polypeptide synthesis assay with ΔIGHMBP2 cell lines.
(A) Metabolic profiles of ΔIGHMBP2 cell lines via CellTiter-Glo assay. Error bars are SD between technical replicate luminescence readings. (B) Relative levels of global translation between ΔIGHMBP2 cell lines as a function of Alexa Fluor 594 intensities via nascent protein synthesis assay (via OP-Puro), measured by flow cytometry. (A) Cells were harvested at logarithmic metabolic time points Day 1 and 2 reflected in (A). (C) Representative O-propargyl-puromycin (OPP) assay control results showing fluorescence dynamic range among unstained cells, cells stained with Alexa Fluor 594 only, cells co-treated with cycloheximide and OPP before staining with Alexa Fluor 594, and +OPP +Alexa Fluor 594 DMSO-treated cells.
Figure S3.
Figure S3.. RNA-seq and Ribo-seq count correlation among replicate samples of ΔIGHMBP2 cell lines.
(A, B, C, D, E) Spearman’s correlation analysis between replicate log-transformed RNA-seq counts among parental cells, (B, C) IGHMBP2 HET Clones #1 and #2, and (D, E) IGHMBP2 KO Clones #1 and #2, respectively. (F, G, H, I, J) Spearman’s correlation analysis between replicate log-transformed Ribo-seq counts among parental cells, (G, H) IGHMBP2 HET Clones #1 and #2, and (I, J) IGHMBP2 KO Clones #1 and #2, respectively.
Figure S4.
Figure S4.. Periodicity profiles among Ribo-seq reads from replicate samples of ΔIGHMBP2 cell lines.
(A, B, C, D, E, F, G, H, I, J) 3-nt periodicity among Ribo-seq reads for replicates 1 and 2 of parental cells, (C, D) IGHMBP2 HET Clone #1, (E, F) IGHMBP2 HET Clone #2, (G, H) IGHMBP2 KO Clone #1, and (I, J) IGHMBP2 KO Clone #2, respectively.
Figure S5.
Figure S5.. Strand sense analysis with Ribo-seq reads from replicate samples of ΔIGHMBP2 cell lines.
(A, B, C, D, E, F, G, H, I, J) Strand sense quantification among Ribo-seq reads is shown for replicates 1 and 2 of parental cells, (C, D) IGHMBP2 HET Clone #1, (E, F) IGHMBP2 HET Clone #2, (G, H) IGHMBP2 KO Clone #1, and (I, J) IGHMBP2 KO Clone #2, respectively.
Figure S6.
Figure S6.. Read mapping classifications among Ribo-seq reads from replicate samples of ΔIGHMBP2 cell lines.
(A, B, C, D, E, F, G, H, I, J) Proportion of mapped reads corresponding to genomic classifications such as CDS, UTR, and others shown for replicates 1 and 2 of parental cells, (C, D) IGHMBP2 HET Clone #1, (E, F) IGHMBP2 HET Clone #2, (G, H) IGHMBP2 KO Clone #1, and (I, J) IGHMBP2 KO Clone #2, respectively.
Figure 3.
Figure 3.. IGHMBP2 loss alters translation of diverse mRNAs.
(A) Ribo-seq versus RNA-seq shrunken log2 fold change (L2FC) per gene from partial or full IGHMBP2 deletion clones relative to parental cells. Differential expression (DE) analysis was performed using Wald test, and P-values were adjusted (P.adj) via Benjamini–Hochberg method. Cut-offs used for DE classifications are P.adj < 0.01 for ΔRNA-seq (pink, green, and orange), and P.adj < 0.05 for ΔRibo-seq (green and violet) and Δtranslation efficiency (ΔTE; blue, violet, and orange). ΔTE genes across all clones were identified via likelihood ratio test against the Ribo:RNA-seq interaction term across all samples. Genes of both ΔTE and ΔRibo-seq are identified as translation exclusive (violet). Genes of ΔTE and ΔRNA-seq are classified as translation buffered (orange). The number of differentially expressed genes (nDEG) are shown per cell line. (B, C) Top 10 up versus down-regulated enriched gene sets using ranked fold-changes from RNA-seq and (C) Ribo:RNA-seq results. (B, C) GS labels are orange or pink if expression trends between (B, C) are opposing positively or negatively from RNA to TE levels, respectively. (D) Enrichment network map of gene set enrichment analysis results with Ribo-seq L2FCs. In (B, C, D), gene set enrichment analysis was computed using the Biological Process ontology; min GS size = 25, max GS size = 1,000 with 100,000 permutations. (E) Overview of the cellular impact of IGHMBP2 disruption.
Figure S7.
Figure S7.. RNA-seq differentially expressed gene comparison between replicate samples of ΔIGHMBP2 clones.
(A, B) Scatterplot depicting differentially expressed genes with significant (P < 0.01) RNA-seq L2FCs in IGHMBP2 HET Clones #1 and #2 or (B) IGHMBP2 KO Clones #1 and #2. Genes overlapping within all four clones have bolded labels. Only directionally overlapping hits (red if down-regulated, green if up-regulated) were used for linear regression line fitting and Pearson’s correlation determination. Non-directionally overlapping hits are shown in grey.
Figure S8.
Figure S8.. Translational efficiency of ATF4 is differentially up-regulated in ΔIGHMBP2 cells.
(A) Average L2FCs of ΔTE differentially expressed genes in heterozygous and full IGHMBP2 deletion clones relative to parental cells. All differentially expressed genes were sorted low to high based on L2FCAvg in IGHMBP2 KO clones. L2FCAvg in IGHMBP2 HET clones were then plotted and connected with arrows colored and oriented by relative directionality between IGHMBP2 KO, HET, and parental samples, where linear changes are colored red for down-regulation, green for up-regulation, or blue for nonlinear scenarios with respect to parental expression. (B, C) Ribo-seq versus RNA-seq shrunken L2FC per gene from partial or (C) full IGHMBP2 deletion clones relative to parental cells. ATF4 is highlighted, demonstrating translation-exclusive classification is gained in IGHMBP2 KO clones with comparable changes. DE analysis was performed using Wald test, and P-values were adjusted via Benjamini–Hochberg method. Cut-offs used for DE classifications are P.adj < 0.01 for ΔRNA-seq (pink, green, and orange), and P.adj < 0.05 for ΔRibo-seq (green and violet) and Δtranslation efficiency (ΔTE; blue, violet, and orange). ΔTE genes across all clones were identified via likelihood ratio test against the Ribo:RNA-seq interaction term across all samples. Genes of both ΔTE and ΔRibo-seq are identified as translation exclusive (violet). Genes of ΔTE and ΔRNA-seq are classified as translation buffered (orange).
Figure 4.
Figure 4.. ATF4 is up-regulated in IGHMBP2 deletion cells.
(A) Average L2FC of a subset of ΔTE genes in full versus heterozygous IGHMBP2 deletion clones relative to expression in parental cells. ΔTE-classified genes were filtered for genes exhibiting average FC within 10% in HET clones and if L2FCAvg was intermediate in IGHMBP2 HET clones relative to L2FCAvg in IGHMBP2 KO clones. (B) Ribo-seq reads from IGHMBP2 deletion versus parental samples normalized by counts per million (CPM) and mapped to the uORF regions of ATF4. (C) Quantification of relative Ribo-seq counts corresponding to ATF4 transcript regions among ΔIGHMBP2 cell lines. The uORF2 overlap with CDS of ATF4 was excluded from uORF2 count quantification. Each dot represents the average CPM between two replicates per clone normalized to the parental CPM per indicated ATF4 region. (D) Schematic of ATF4 reporter system. Transcription of lentivirally integrated mApple and EGFP reporters is driven by separate CMV promoters. An integrated stress response-sensitive, synthetic 5′-UTR encoding two uORFs (derived from ATF4) is upstream of the mApple ORF. (E) uORF1,2(ATF4)-mApple expression normalized to promoter and translational activity (EGFP) in ΔIGHMBP2 reporter cell lines. Medians are indicated with black lines. (F) Relative median mApple/EGFP intensities among reporter cell lines expressing TagBFP or IGHMBP2-TagBFP measured by flow cytometry. Measurements were collected on three different days (n = 3), and single-cell mApple/EGFP signals were normalized to the median mApple/EGFP of parental cells from at least 3,000 cells in the final gate per sample. Horizontal black lines show the mean, and error bars reflect SEM of normalized median values. One-way ANOVA (Kruskal–Wallis) was performed against all four cell lines, and we rejected the null hypothesis with P = 0.03. Pairwise statistics were determined via Conover–Iman post hoc testing and shown relative to parental (ns: P.adj > 0.1, .: P.adj ≤ 0.1, *: P.adj ≤ 0.05, **: P.adj ≤ 0.01).
Figure S9.
Figure S9.. Characterization of ΔIGHMBP2 ATF4 reporter cell lines.
(A) Flow cytometry gating strategy for ΔIGHMBP2 ATF4 reporter cell lines. (B) uORF1,2(ATF4)-mApple expression normalized to promoter and translational activity (EGFP) in ΔIGHMBP2 reporter cell lines at steady state in DMSO or treated with 250 nM thapsigargin overnight. (C, D) TagBFP+ cell gating among IGHMBP2 KO ATF4 reporter cell lines expressing TagBPF only, TagBFP-IGHMBP2, or IGHMBP2-TagBFP and (D) relative mApple/EGFP intensities. Source data are available for this figure.
Figure S10.
Figure S10.. Differential p-eIF2α levels at steady state in ΔIGHMBP2 cell lines is not detected by Western blot.
(A, B) Western blots via PAGE with 50 μg total protein loaded per lane and (B) PAGE versus Phos-Tag gels loaded with 20 μg total protein per lane from ΔIGHMBP2 cell lines. The control PAGE gel was run in parallel to confirm p-eIF2α Phos-tag gel shifts would not be attributed to degraded eIF2α. Expected molecular weights per antibody target shown were confirmed via protein ladder run in each gel (included in source data file).
Figure 5.
Figure 5.. The integrated stress response is activated in IGHMBP2 deletion cells.
(A, B) Dotplots of relative median mApple/EGFP signal among ΔIGHMBP2 reporter cell lines treated with 500 nM ISRIB or (B) 1 μM GCN2iB for 24 h, measured by flow cytometry. Single-cell mApple/EGFP intensities were normalized to the median mApple/EGFP of untreated (DMSO only) parental cells per day of measurement. For (A, B), normalized medians derived from final gated populations of at least 4,500 cells per sample were determined from experiments performed on four different days (n = 4). Black horizontal lines indicate mean, and error bars show SEM of normalized medians. One-way ANOVA (Kruskal–Wallis) was performed on DMSO, ISRIB, and GCN2iB rank-transformed results under one dataset. The null hypothesis was rejected with P.adj = 0 (P << 0.0001) and Conover–Iman post hoc test result statistics are shown. (C, D) Boxplots of relative median FSC-W and (D) mEGFP fluorescence intensities among mEGFP+ cell lines treated with 500 nM ISRIB or 1 μM GCN2iB for 9 d, normalized to the average Day 1 untreated parental signal from the same plate. Final gated populations of at least 3,000 cells from three independently passaged wells collected across three separate experiments were analyzed (n = 9). Points within boxes indicate mean, and error bars represent SEM of normalized medians. A two-way ANOVA followed by pairwise means comparison via Tukey’s post hoc test was performed among rank-transformed parental, heterozygous, and IGHMBP2 KO results to visualize differences between groups. Pairwise compact letter display coloring corresponds to parental (blue), heterozygous (teal), and IGHMBP2 KO (gold) groups for interaction results. The Genotype:Treatment statistics are shown above brackets. For (A, B, C, D), significance codes represent ns: P > 0.1, .: P ≤ 0.1, *: P ≤ 0.05, **: P ≤ 0.01, ***: P ≤ 0.001. (E) Possible models for how IGHMBP2 deletion results in GCN2-mediated chronic ISR activation.
Figure S11.
Figure S11.. Effects of ISRIB or GCN2iB treatment among ΔIGHMBP2 cells across time.
(A) Competitive proliferation trends between ΔIGHMBP2 mEGFP+ cell lines seeded with 50% non-fluorescent parental cells under DMSO, ISRIB, or GCN2iB treatment. Samples were seeded in triplicate on Day 0 in three plates from separately passaged flasks, and one plate was seeded and measured on different days. Cells were held in constant treatment conditions when independently passaged on each day of measurement. For (A), the average proportion of each mEGFP+ population per each plate are shown (n = 3) per time point. Error bars represent coefficient of variation of mEGFP+ cell line proportions normalized to the corresponding Day 1 untreated (DMSO) mean mEGFP+ cell line fraction per plate. (A, B, C) Boxplots of relative median FSC-W and (C) mEGFP signal among mEGFP+ cell lines treated with 500 μM ISRIB or 1 μM GCN2iB across 9 d from (A). (B, C) For each day of measurement depicted in (B, C), median signals from three independently passaged were normalized to the average median signal from untreated parental mEGFP+ cells per plate. Normalized medians (three per plate) from three separate plates are shown (n = 9). Points inside boxplots indicate mean, and their error bars represent SEM. A two-way ANOVA followed by pairwise means comparison via Tukey’s test was performed among rank-transformed parental, heterozygous, and grouped IGHMBP2 KO results per time point. If the Genotype:Treatment term (statistic labeled in black) is insignificant with an interaction model, group statistics with an additive model are shown. (A, B) Coloring for significance codes in (A) and pairwise compact letter display in (B) corresponds to parental (blue), heterozygous (teal), and KO (gold) ΔIGHMBP2 groups. Significance codes are ns: P > 0.1, P ≤ 0.1, *P ≤ 0.05, **P ≤ 0.01, ***P ≤ 0.001.
Figure S12.
Figure S12.. Ribosome footprint analyses across transcript regions and codons with Ribo-seq reads from ΔIGHMBP2 cell lines.
(A) Representative metagene analyses with Ribo-seq results from one replicate per ΔIGHMBP2 cell line. Zoom-out view capturing the entire TSS peak is inset. (B) Northern blot visualizing tRNA-Tyr (all isodecoders), tRNA-ValmAC (GUU/C/G isodecoders), tRNA-ValTAC (GUA isodecoders), and tRNA-GlysCC (GGC/U/G isodecoders) abundances in ΔIGHMBP2 cell lines. 5 μg total RNA was loaded per lane. (C, D) Representative before and after footprint position bias-correction for parental cell line Ribo-seq results processed with choros. (E, F) A-site codon regression coefficients (βA) between parental replicate results and (F) IGHMBP2 KO Clone #2 relative to a parental sample. (G, H) Differential A-site codon enrichment visualized by regression coefficient interaction terms between parental replicates and (H) IGHMBP2 KO Clone #2 relative to a parental sample. (E, G) are shown to visualize expected noise among control comparisons. Source data are available for this figure.
Figure S13.
Figure S13.. Gene set enrichment analysis with ATF4 target gene list among sequencing results from IGHMBP2 deletion cells.
(A) Ranked gene profile of ATF4 target gene list (grey) among TE L2FCAvg results from IGHMBP2 KO clones. (A, B) ATF4 target gene list results depicted in (A), with L2FCAvg and P-adjusted values shown per gene among IGHMBP2 KO clones #1 and #2. (C) Ranked gene profile of ATF4 target gene list (grey) among RNA-seq L2FCAvg results from IGHMBP2 KO clones. For (A, C), representative significantly enriched gene sets are shown for comparison. Gene set enrichment analysis was computed using the Biological Processes ontology; min GS size = 25, max GS size = 1,000 with 100,000 permutations.

Update of

Similar articles

Cited by

References

    1. Bohnsack KE, Yi S, Venus S, Jankowsky E, Bohnsack MT (2023) Cellular functions of eukaryotic RNA helicases and their links to human diseases. Nat Rev Mol Cell Biol 24: 749–769. 10.1038/s41580-023-00628-5 - DOI - PubMed
    1. Calviello L, Sydow D, Harnett D, Ohler U (2019) Ribo-seQC: Comprehensive analysis of cytoplasmic and organellar ribosome profiling data. BioRxiv. 10.1101/601468 (Preprint posted April 08, 2019). - DOI
    1. Calviello L, Venkataramanan S, Rogowski KJ, Wyler E, Wilkins K, Tejura M, Thai B, Krol J, Filipowicz W, Landthaler M, et al. (2021) DDX3 depletion represses translation of mRNAs with complex 5′ UTRs. Nucleic Acids Res 49: 5336–5350. 10.1093/nar/gkab287 - DOI - PMC - PubMed
    1. Chothani S, Adami E, Ouyang JF, Viswanathan S, Hubner N, Cook SA, Schafer S, Rackham OJL (2019) deltaTE: Detection of translationally regulated genes by integrative analysis of Ribo‐seq and RNA‐seq data. Curr Protoc Mol Biol 129: e108. 10.1002/cpmb.108 - DOI - PMC - PubMed
    1. Costa-Mattioli M, Walter P (2020) The integrated stress response: From mechanism to disease. Science 368: eaat5314. 10.1126/science.aat5314 - DOI - PMC - PubMed

MeSH terms