. 2024 May 9:18:1320784.
doi: 10.3389/fncel.2024.1320784. eCollection 2024.

Autism risk gene Cul3 alters neuronal morphology via caspase-3 activity in mouse hippocampal neurons

Affiliations

Autism risk gene Cul3 alters neuronal morphology via caspase-3 activity in mouse hippocampal neurons

Qiang-Qiang Xia et al. Front Cell Neurosci. .

Abstract

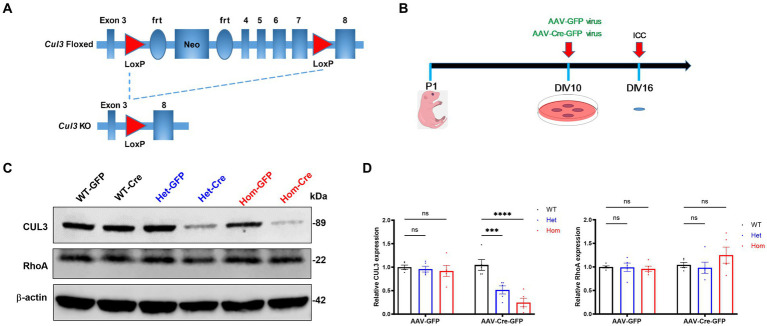
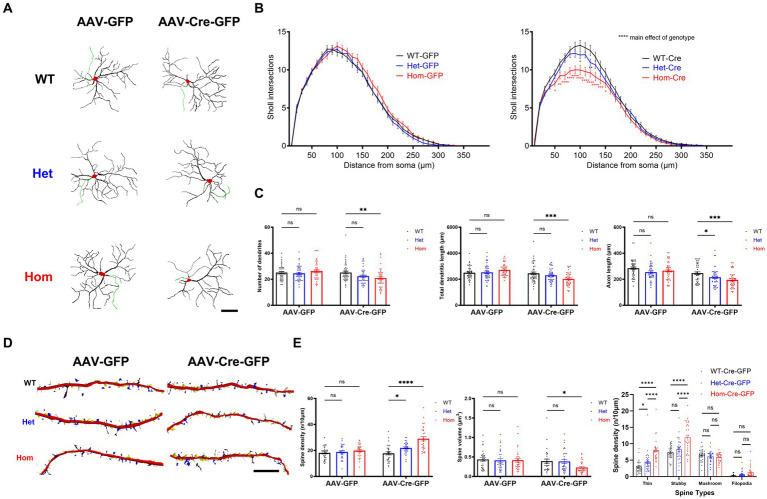
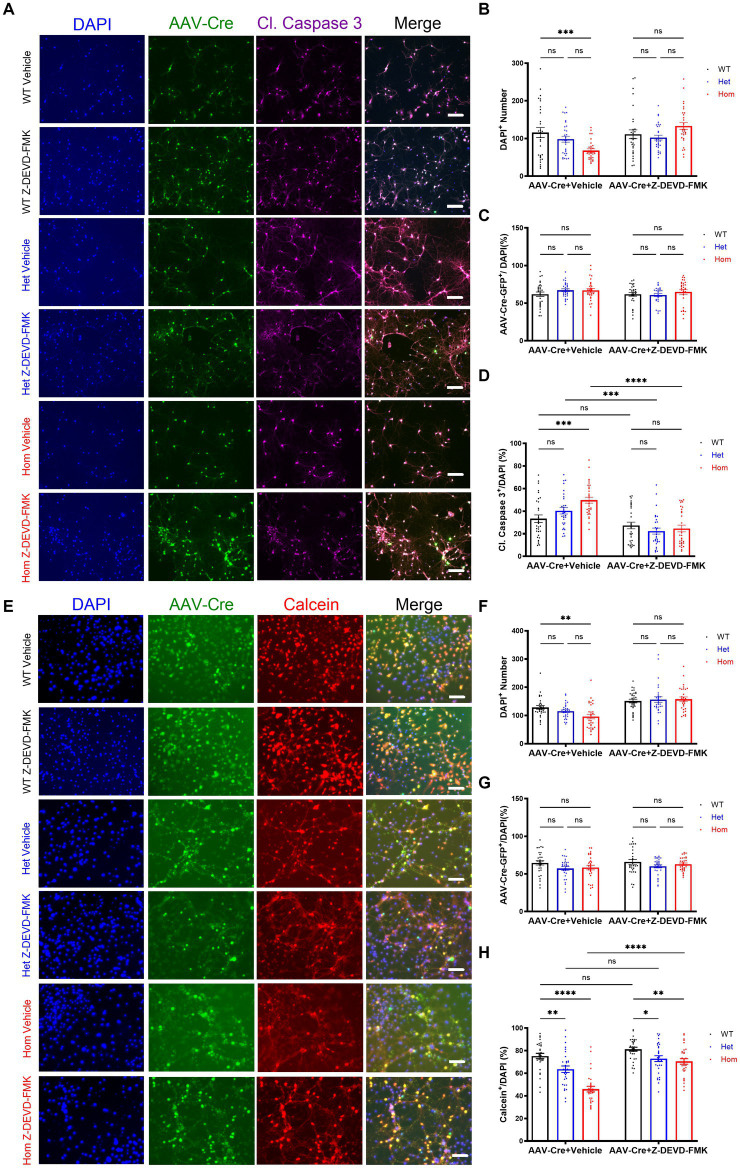
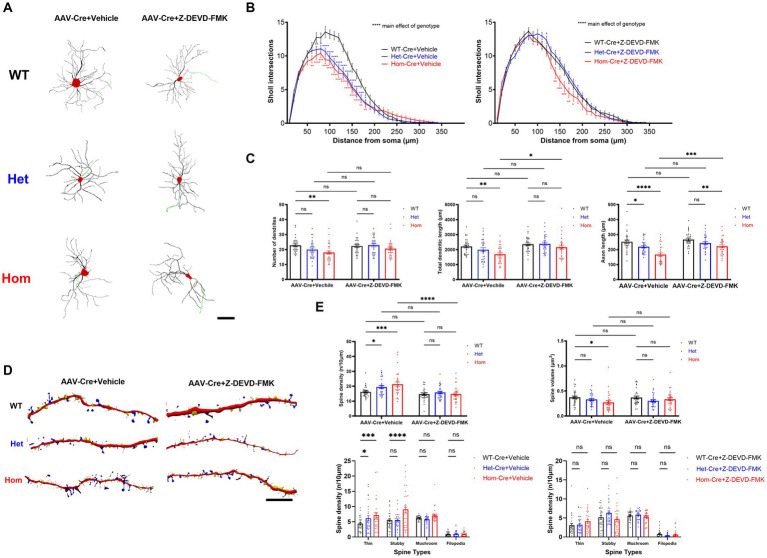
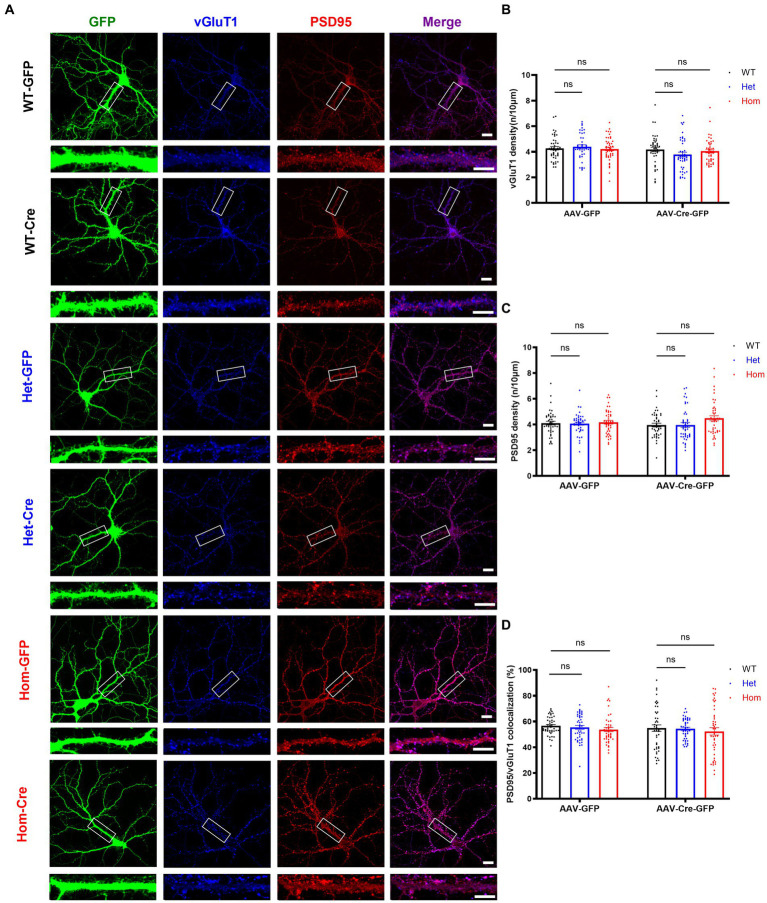
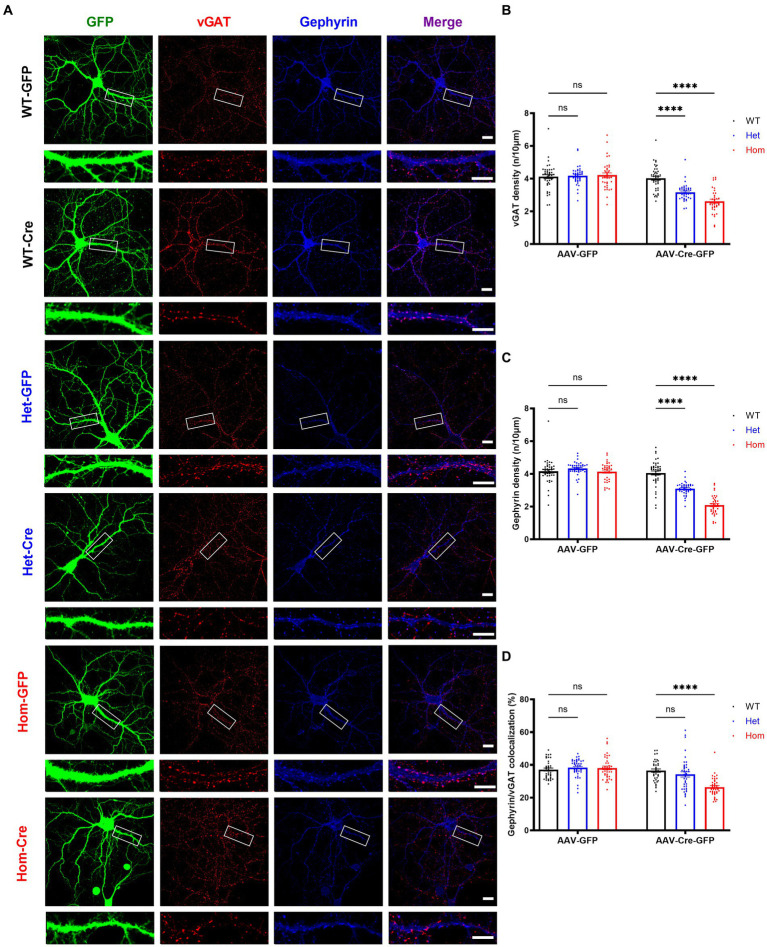
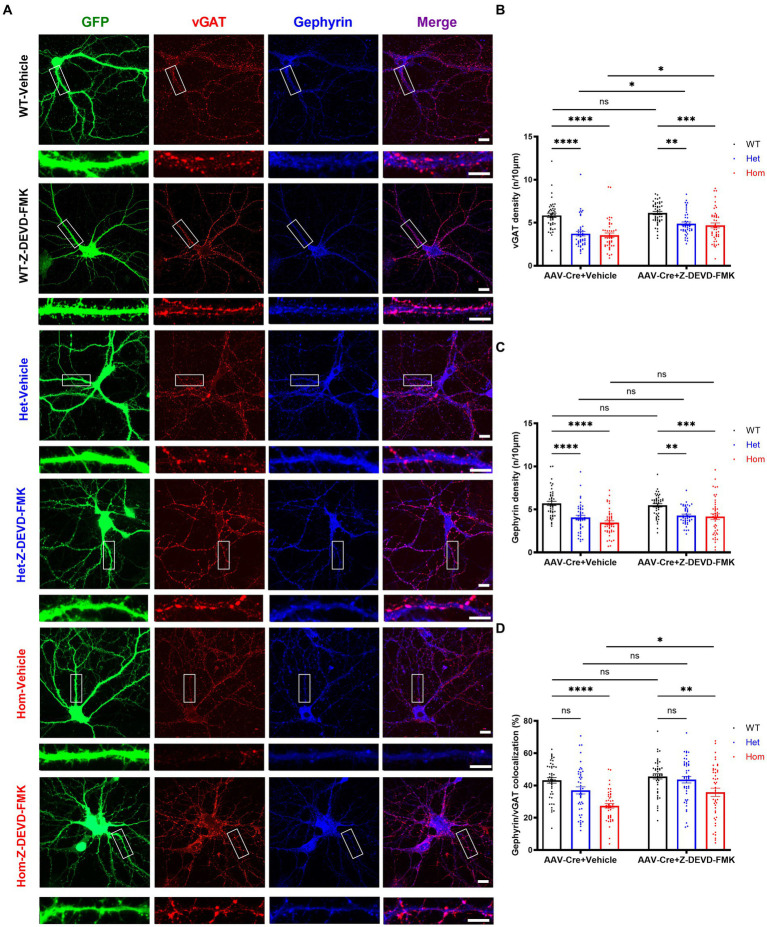
Autism Spectrum Disorders (ASDs) are neurodevelopmental disorders (NDDs) in which children display differences in social interaction/communication and repetitive stereotyped behaviors along with variable associated features. Cul3, a gene linked to ASD, encodes CUL3 (CULLIN-3), a protein that serves as a key component of a ubiquitin ligase complex with unclear function in neurons. Cul3 homozygous deletion in mice is embryonic lethal; thus, we examine the role of Cul3 deletion in early synapse development and neuronal morphology in hippocampal primary neuronal cultures. Homozygous deletion of Cul3 significantly decreased dendritic complexity and dendritic length, as well as axon formation. Synaptic spine density significantly increased, mainly in thin and stubby spines along with decreased average spine volume in Cul3 knockouts. Both heterozygous and homozygous knockout of Cul3 caused significant reductions in the density and colocalization of gephyrin/vGAT puncta, providing evidence of decreased inhibitory synapse number, while excitatory synaptic puncta vGulT1/PSD95 density remained unchanged. Based on previous studies implicating elevated caspase-3 after Cul3 deletion, we demonstrated increased caspase-3 in our neuronal cultures and decreased neuronal cell viability. We then examined the efficacy of the caspase-3 inhibitor Z-DEVD-FMK to rescue the decrease in neuronal cell viability, demonstrating reversal of the cell viability phenotype with caspase-3 inhibition. Studies have also implicated caspase-3 in neuronal morphological changes. We found that caspase-3 inhibition largely reversed the dendrite, axon, and spine morphological changes along with the inhibitory synaptic puncta changes. Overall, these data provide additional evidence that Cul3 regulates the formation or maintenance of cell morphology, GABAergic synaptic puncta, and neuronal viability in developing hippocampal neurons in culture.

Keywords: axon; caspase-3; cullin-3; dendrite; spine; synapse.


Conflict of interest statement

CP has been funded in the past by Novartis and reimbursed for travel to speak once each at Dainippon Sumitomo Pharma Co., Pfizer, Roche, Astra-Zeneca, and Psychogenics. CP has also served once as a paid expert witness for attorneys representing Johnson & Johnson, Inc., among other defendants. The remaining authors declare that the research was conducted in the absence of any commercial or financial relationships that could be construed as a potential conflict of interest.

Figures

Figure 1
Figure 1
Cul3 knockout strategy and validation in primary cultured hippocampal neurons. (A) Schematic representation of fCul3 mouse model and viral transduction Cre-LoxP knockout strategy. Exons 3–8 of Cul3 are represented along with loxP, neomycin-resistance, and frt (flippase recognition target) sites. Transduction of neurons with AAV-Cre-GFP results in recombination and loss of Cul3 exons 4–7. AAV-GFP transduction is used as a negative control (not depicted). (B) Experimental timeline of neuronal culture and AAV transduction. fCul3 mouse pups are sacrificed at P1, cultures transduced with AAV viruses at DIV10, then examined for outcome measures at DIV16, 6 days after transduction (ICC, immunocytochemistry). (C,D) Representative immunoblot [left, (C)] and graph of group data [right, (D)] for anti-CUL3,anti-β-actin and anti-RhoA blots following either AAV-Cre-GFP (WT-Cre, Het-Cre, Hom-Cre) or AAV-GFP (WT-GFP, Het-GFP, Hom-GFP) transduction in cultured fCul3 hippocampal neurons. *p < 0.05, **p < 0.01, ***p < 0.001, ****p < 0.0001, ordinary two-way AVONA with Dunnett’s multiple comparisons test; bars represent mean ± SEM, 5 separately derived neuronal cultures.
Figure 2
Figure 2
Cul3 deletion decreases dendrite elaboration or maintenance and increases dendritic spines of reduced volume in primary cultured hippocampal neurons. (A) Representative tracings (derived from Neurolucida 360 analysis of confocal images) of WT, Het, or Hom fCul3 cultured hippocampal neurons transduced with either AAV-GFP (left column) or AAV-Cre-GFP (right column). Red, cell soma; Black, dendrite; Green, axon. Scale bar, 50 μm. (B) Sholl analysis of WT-Cre, Het-Cre, and Hom-Cre Cul3 knockouts (right) demonstrates significantly decreased dendritic branching in both Het and Hom Cul3 mutant neurons. No change in dendritic branching is observed in control AAV-GFP transduced fCul3 neurons (left; WT-GFP, Het-GFP, Hom-GFP). (C) Number of dendrites (left), total dendritic length (middle) and axon length (right) significantly decreased in Cul3 homozygous knockout neurons (Hom-Cre) compared to control, fCul3 wildtype treated with AAV-Cre (WT-Cre). (D) Representative tracings (Neurolucida 360 analysis of confocal images) of WT, Het, and Hom fCul3 cultured hippocampal neuron dendritic spines transduced with AAV-GFP or AAV-Cre-GFP. White, thin; yellow, stubby; blue, mushroom; brown, filopodia. Scale bar, 20 μm. (E) Dendritic spine density significantly increased both in Het-Cre and Hom-Cre compared to control wildtype fCul3 neurons transduced with AAV-Cre (left). Average spine volume significantly reduced in homozygous Cul3 knockout neurons (Hom-Cre) compared to control homozygous fCul3 neurons transduced with AAV-GFP (middle). Density of various spine subtypes increased for thin and stubby spines only (right). *p < 0.05, **p < 0.01, ***p < 0.001, ****p < 0.0001, ordinary two-way AVONA with Dunnett’s multiple comparisons test; graphs depict mean ± SEM. N = 30 neurons from 3 separately derived neuronal cultures (10 neurons for each group).
Figure 3
Figure 3
Cul3 modulates cell viability through caspase-3 activity in primary cultured hippocampal neurons. (A) Representative images of WT, heterozygous, and homozygous fCul3 cultured hippocampal neurons treated with Z-DEVD-FMK or vehicle transduced with AAV-Cre-GFP viruses (WT-Cre, Het-Cre, Hom-Cre). DAPI, cell nucleus marker. Cl. Caspase-3, cleaved caspase-3. Scale bar, 50 μm. (B) Neuron number counted based on DAPI signal. (C) AAV virus transduction efficiency was comparable among all groups. (D) Caspase-3 positive signal was divided by DAPI signal to determine the caspase-3-positive cell rate. Increased caspase-3 activity is largely reversed by Z-DEVD-FMK treatment in Hom group. (E) Representative images of WT, heterozygous, and homozygous fCul3 cultured hippocampal neurons treated with Z-DEVD-FMK or vehicle transduced with AAV-Cre-GFP viruses (WT-Cre, Het-Cre, Hom-Cre). Calcein, viable cell marker. Scale bar, 50 μm. (F) Neuron number based on DAPI signal. (G) AAV virus transduction efficiency was comparable among all groups. (H) Calcein positive signal was divided by DAPI signal to determine viable cell rate. Decreased viable cell rate is largely reversed by Z-DEVD-FMK treatment in both Het and Hom group. *p < 0.05, **p < 0.01, ***p < 0.001, ****p < 0.0001, ordinary two-way AVONA with Dunnett’s multiple comparisons test; graphs depict mean ± SEM. N = 30 neurons from 3 separately derived neuronal cultures (10 neurons for each group).
Figure 4
Figure 4
Cul3 regulates dendritic complexity and spine generation through caspase-3 activity in primary cultured hippocampal neurons. (A) Representative tracings (derived from Neurolucida 360 analysis of confocal images) of WT, heterozygous, and homozygous fCul3 cultured hippocampal neurons treated with Z-DEVD-FMK or vehicle transduced with AAV-Cre-GFP viruses (WT-Cre, Het-Cre, Hom-Cre). Red, cell soma; Black, dendrite; Green, axon. Scale bar, 50 μm. (B) Sholl analysis of WT-Cre, Het-Cre, and Hom-Cre Cul3 knockouts (left) demonstrates significantly decreased dendritic branching in both Het and Hom Cul3 mutant neurons. Decreased dendritic branching is largely reversed by Z-DEVD-FMK treatment in both Het and Hom group (right). (C) Number of dendrites (left), total dendritic length (middle) and axon length (right) significantly decreased in Cul3 homozygous knockout neurons (Hom-Cre) compared to control, fCul3 wildtype treated with AAV-Cre (WT-Cre). Decreased number of dendrites, total dendritic length and axon length were largely reversed by Z-DEVD-FMK treatment in Hom group. (D) Representative tracings (Neurolucida 360 analysis of confocal images) of WT, Het, and Hom fCul3 cultured hippocampal neuronal dendritic spines treated with Z-DEVD-FMK or vehicle transduced with AAV-Cre-GFP viruses (WT-Cre, Het-Cre, Hom-Cre). White, thin; yellow, stubby; blue, mushroom; brown, filopodia. Scale bar, 20 μm. (E) Dendritic spine density significantly increased in heterozygous and homozygous Cul3 knockout neurons were reversed by Z-DEVD-FMK treatment (upper left). Average spine volume significantly reduced in homozygous Cul3 knockout neurons was reversed by Z-DEVD-FMK treatment (upper right). Increased spine density with Cul3 deletion was largely due to increased thin and stubby spines increasing (lower left), and this was reversed by Z-DEVD-FMK (lower right). *p < 0.05, **p < 0.01, ***p < 0.001, ****p < 0.0001, ordinary two-way AVONA with Dunnett’s multiple comparisons test; graphs depict mean ± SEM. N = 30 neurons from 3 separately derived neuronal cultures (10 neurons for each group).
Figure 5
Figure 5
Cul3 homozygous deletion and heterozygous reduction lead to unchanged excitatory synapses in primary cultured hippocampal neurons. (A) Representative images of excitatory synaptic puncta in WT, heterozygous, and homozygous fCul3 cultured hippocampal neurons transduced with either AAV-GFP (WT-GFP, Het-GFP, Hom-GFP) or AAV-Cre-GFP (WT-Cre, Het-Cre, Hom-Cre). Scale bars represent 50 μm for the larger images and 20 μm for the magnified dendrite images. (B) Presynaptic excitatory synapse marker vGluT1 puncta density is comparable in both heterozygous and homozygous Cul3 knockout neurons (Het-Cre and Hom-Cre) compared to control heterozygous and homozygous fCul3 neurons transduced with AAV-GFP (Het-GFP and Hom-GFP). (C) Postsynaptic excitatory synapse marker PSD95 puncta density is unchanged in both heterozygous and homozygous Cul3 knockout neurons (Het-Cre and Hom-Cre) compared to control heterozygous and homozygous fCul3 neurons transduced with AAV-GFP. (D) Percentage of co-localized PSD95/vGluT1 puncta is unchanged in homozygous Cul3 knockout neurons (Hom-Cre) compared to homozygous fCul3 neurons transduced with AAV-GFP (Hom-GFP). *p < 0.05, **p < 0.01, ***p < 0.001, ****p < 0.0001, ordinary two-way AVONA with Dunnett’s multiple comparisons test; graphs depict mean ± SEM. N = 45 neurons from 3 separately derived neuronal cultures (15 neurons for each group).
Figure 6
Figure 6
Cul3 homozygous deletion and heterozygous reduction lead to reduced inhibitory synapses in primary cultured hippocampal neurons. (A) Representative images of inhibitory synaptic puncta in WT, heterozygous, and homozygous fCul3 cultured hippocampal neurons transduced with either AAV-GFP (WT-GFP, Het-GFP, Hom-GFP) or AAV-Cre-GFP (WT-Cre, Het-Cre, Hom-Cre). Scale bars represent 50 μm for the larger images and 20 μm for the magnified dendrite images. (B) Presynaptic inhibitory synapse marker vGAT puncta density significantly decreased in both heterozygous and homozygous Cul3 knockout neurons (Het-Cre and Hom-Cre) compared to control heterozygous and homozygous fCul3 neurons transduced with AAV-GFP (Het-GFP and Hom-GFP). (C) Postsynaptic inhibitory synapse marker gephyrin puncta density significantly decreased in both heterozygous and homozygous Cul3 knockout neurons (Het-Cre and Hom-Cre) compared to control heterozygous and homozygous fCul3 neurons transduced with AAV-GFP (Het-GFP and Hom-GFP). (D) Percentage of co-localized gephyrin/vGAT puncta significantly decreased in homozygous Cul3 knockout neurons (Hom-Cre) compared to homozygous fCul3 neurons transduced with AAV-GFP (Hom-GFP). *p < 0.05, **p < 0.01, ***p < 0.001, ****p < 0.0001, ordinary two-way AVONA with Dunnett’s multiple comparisons test; graphs depict mean ± SEM. N = 45 neurons from 3 separately derived neuronal cultures (15 neurons for each group).
Figure 7
Figure 7
Caspase-3 inhibition partially rescues Cul3 deletion mediated reduced inhibitory synapses in primary cultured hippocampal neurons. (A) Representative images of inhibitory synaptic puncta in WT, heterozygous, and homozygous fCul3 cultured hippocampal neurons transduced with either Z-DEVD-FMK or vehicle transduced with AAV-Cre-GFP viruses (WT-Cre, Het-Cre, Hom-Cre). Scale bars represent 50 μm for the larger images and 20 μm for the magnified dendrite images. (B) Presynaptic inhibitory synapse marker vGAT puncta density significantly decreased in both heterozygous and homozygous Cul3 knockout neurons (Het-Cre and Hom-Cre) compared to control fCul3 neurons (WT-Cre). Decreased vGAT density is largely reversed by Z-DEVD-FMK treatment in both Het and Hom group. (C) Postsynaptic inhibitory synapse marker gephyrin puncta density significantly decreased in both heterozygous and homozygous Cul3 knockout neurons (Het-Cre and Hom-Cre) compared to control fCul3 neurons (WT-Cre). Decreased gephyrin density is largely reversed by Z-DEVD-FMK treatment in both Het and Hom group. (D) Percentage of co-localized gephyrin/vGAT puncta significantly decreased in homozygous Cul3 knockout neurons (Hom-Cre) which can be partially rescued by Z-DEVD-FMK. *p < 0.05, **p < 0.01, ***p < 0.001, ****p < 0.0001, ordinary two-way AVONA with Dunnett’s multiple comparisons test; graphs depict mean ± SEM. N = 45 neurons from 3 separately derived neuronal cultures (15 neurons for each group).

Similar articles

References

    1. Abrahams B. S., Geschwind D. H. (2010). Connecting genes to brain in the autism spectrum disorders. Arch. Neurol. 67, 395–399. doi: 10.1001/archneurol.2010.47, PMID: - DOI - PMC - PubMed
    1. Acarin L., Villapol S., Faiz M., Rohn T. T., Castellano B., Gonzalez B. (2007). Caspase-3 activation in astrocytes following postnatal excitotoxic damage correlates with cytoskeletal remodeling but not with cell death or proliferation. Glia 55, 954–965. doi: 10.1002/glia.20518 - DOI - PubMed
    1. Alharris E., Singh N. P., Nagarkatti P. S., Nagarkatti M. (2019). Role of mi RNA in the regulation of cannabidiol-mediated apoptosis in neuroblastoma cells. Oncotarget 10, 45–59. doi: 10.18632/oncotarget.26534, PMID: - DOI - PMC - PubMed
    1. Amar M., Pramod A. B., Yu N. K., Herrera V. M., Qiu L. R., Moran-Losada P., et al. . (2021). Autism-linked Cullin 3 germline haploinsufficiency impacts cytoskeletal dynamics and cortical neurogenesis through rho a signaling. Mol. Psychiatry 26, 3586–3613. doi: 10.1038/s41380-021-01052-x, PMID: - DOI - PMC - PubMed
    1. American Psychiatric Association . Task force on DSM-IV. diagnostic and statistical manual of mental disorders: DSM-IV-TR. 4th Washington, DC: American Psychiatric Association; (2000).